
Artificial Tendons and Ligaments Market Size and Share
Market Overview
| Study Period | 2020 - 2031 |
|---|---|
| Market Size (2026) | USD 50.53 Million |
| Market Size (2031) | USD 90.47 Million |
| Growth Rate (2026 - 2031) | 12.36 % |
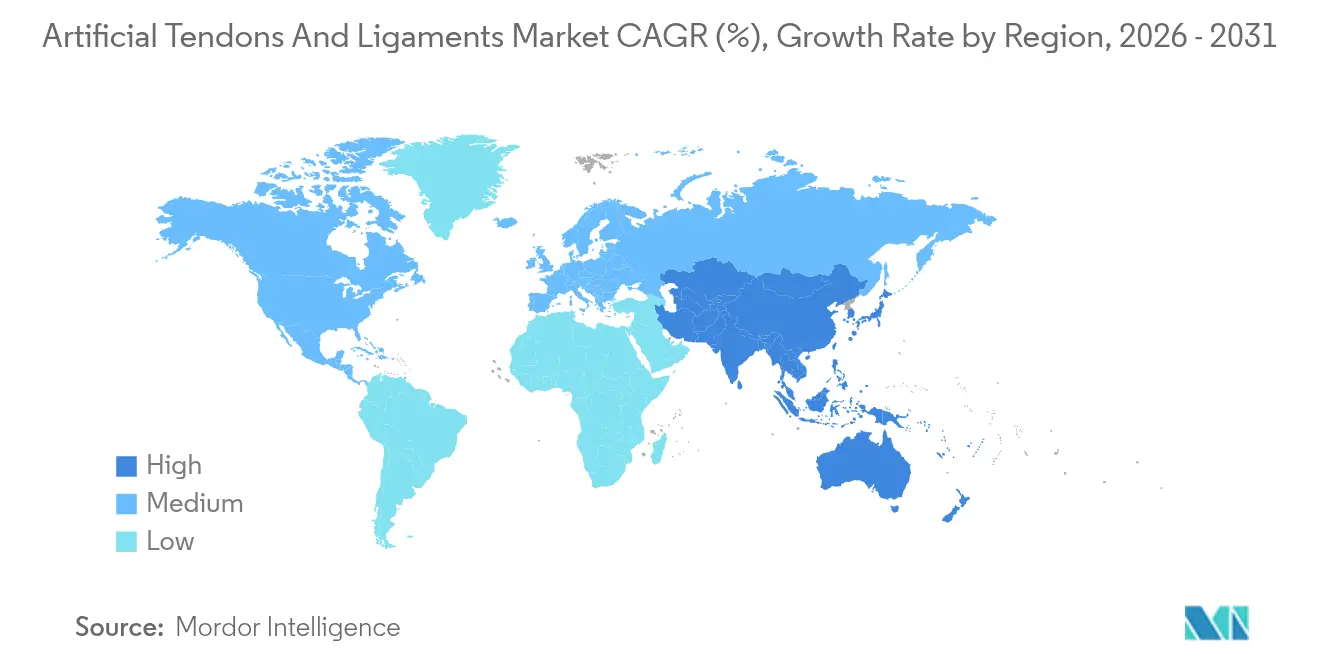
| Fastest Growing Market | Asia Pacific |
| Largest Market | Europe |
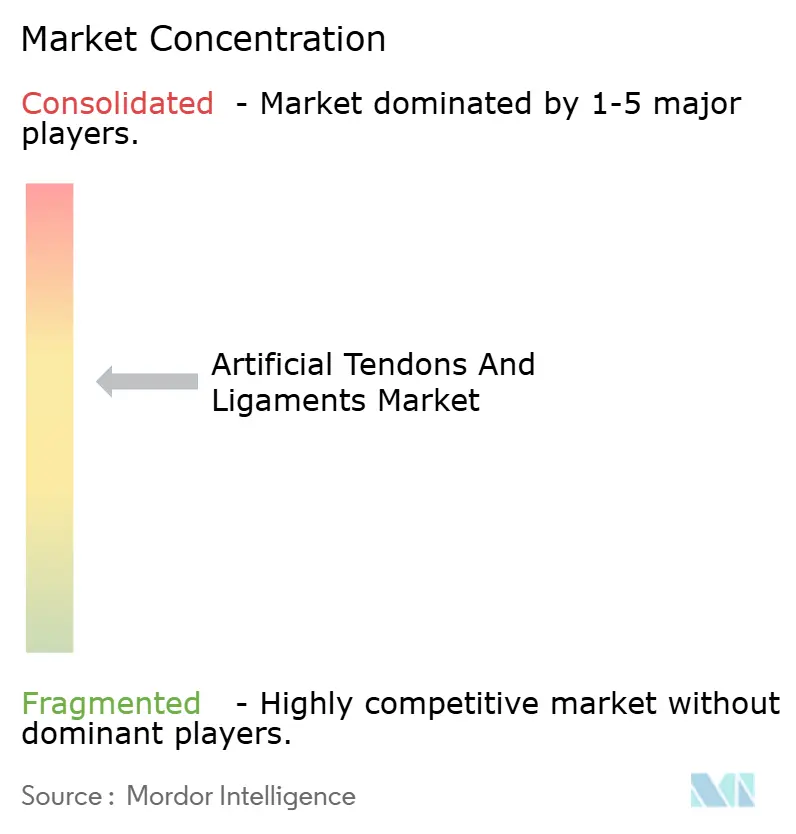
| Market Concentration | Medium |
Major Players *Disclaimer: Major Players sorted in no particular order Image © Mordor Intelligence. Reuse requires attribution under CC BY 4.0. | |
Artificial Tendons and Ligaments Market Analysis by Mordor Intelligence
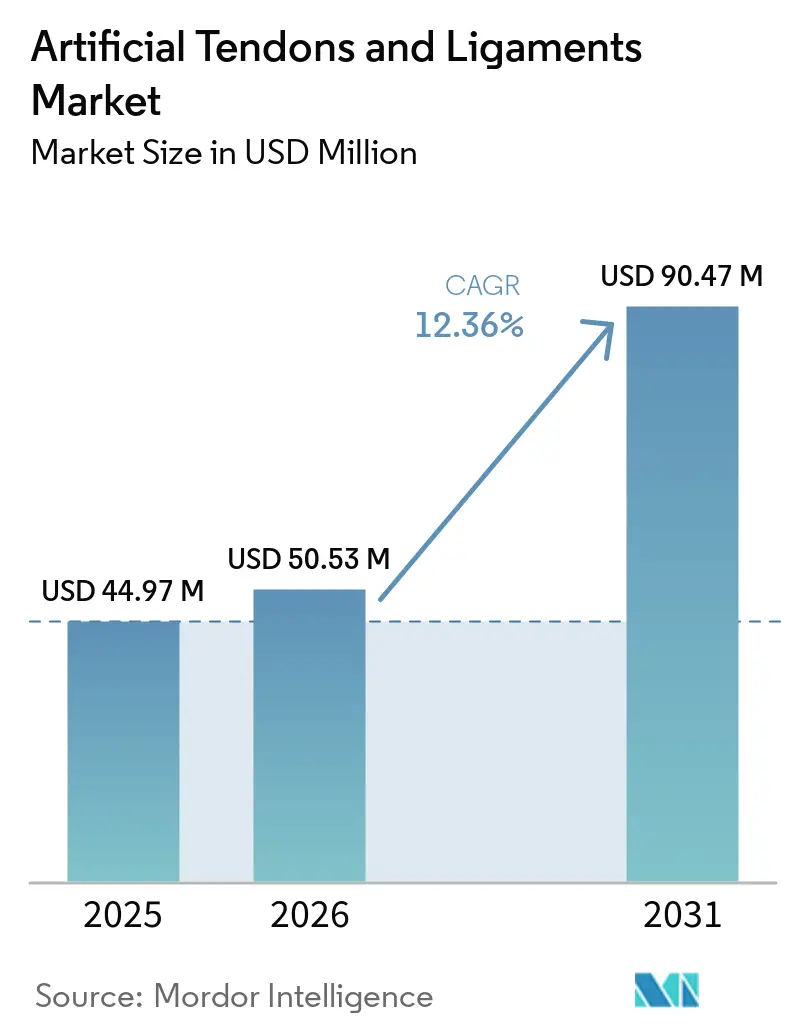
The artificial tendons and ligaments market size in 2026 is estimated at USD 50.53 million, growing from 2025 value of USD 44.97 million with 2031 projections showing USD 90.47 million, growing at 12.36% CAGR over 2026-2031. Rising sports-related ligament trauma, the shift to minimally invasive techniques, and rapid outpatient surgery growth are reinforcing demand. Europe maintains leadership with 38% revenue share, while Asia-Pacific posts the quickest 13.1% CAGR as regional sports participation climbs. Knee injuries dominate volume at 58% share, yet foot and ankle procedures accelerate at 13.8%. Competitive intensity centers on synthetic PET-LARS systems, but hybrid 3D-printed scaffolds—expanding 17.2%—signal a technological pivot. Hospitals deliver most cases today, though ambulatory surgical centers expand orthopedic capability and account for the market’s fastest end-user growth. Strategic acquisitions such as Stryker’s purchase of Artelon underscore industry consolidation and the quest for differentiated biomaterials.
Key Report Takeaways
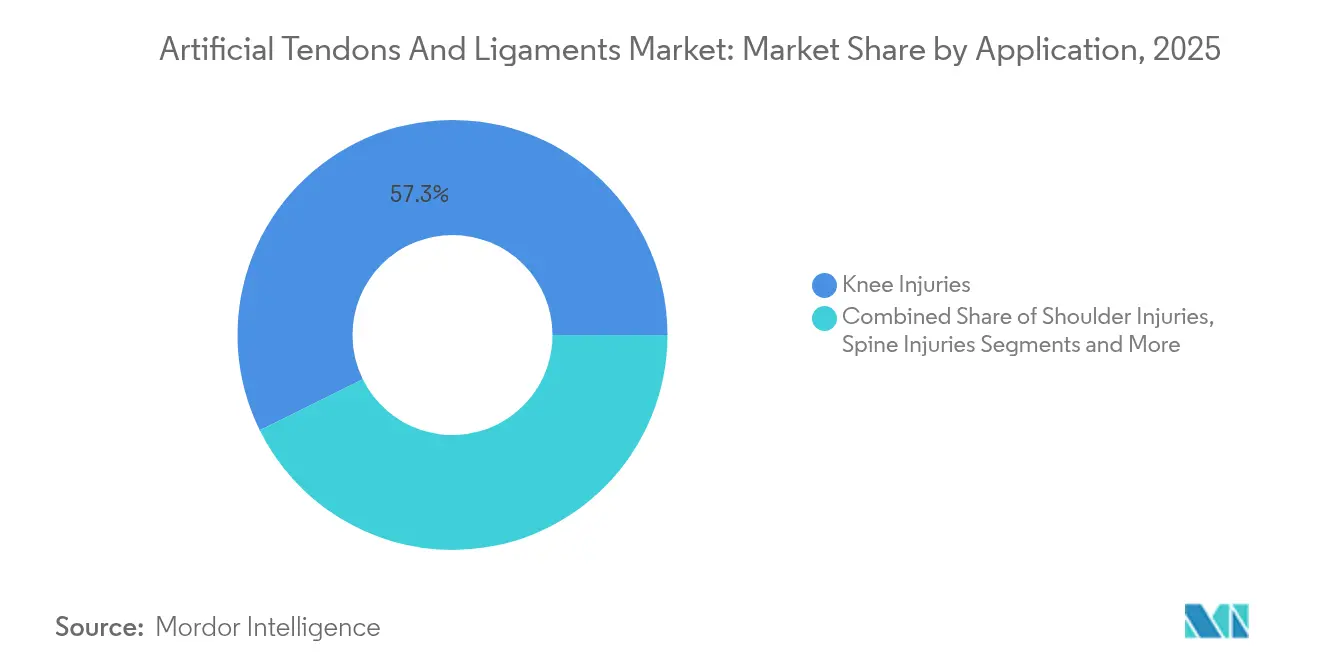
- By application, knee injuries held 57.30% artificial tendons and ligaments market share in 2025; foot and ankle is forecast to expand at a 13.62% CAGR through 2031.
- By implant type, synthetic PET-LARS commanded 63.20% share of the artificial tendons and ligaments market size in 2025, whereas hybrid 3D-printed scaffolds are projected to grow at a 16.85% CAGR to 2031.
- By material, PET maintained 65.10% revenue share in 2025; silk is set to register a 15.05% CAGR through 2031.
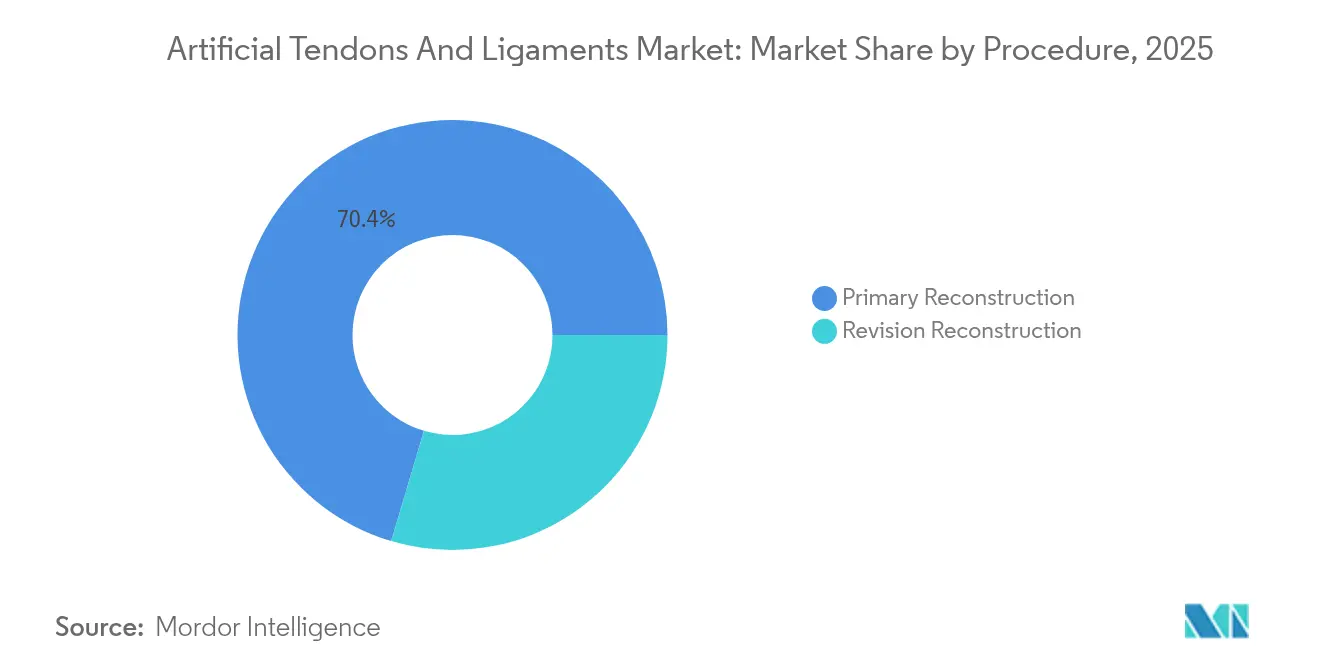
- By procedure, primary reconstruction accounted for 70.40% of the artificial tendons and ligaments market size in 2025, while revision reconstruction is advancing at a 13.67% CAGR to 2031.
- By end user, hospitals and specialty orthopedic centers led with 61.10% share in 2025; ambulatory surgical centers record the highest projected 13.54% CAGR to 2031.
- By geography, Europe led with 37.60% revenue in 2025; Asia-Pacific is projected to post the fastest 12.92% CAGR to 2031.
Note: Market size and forecast figures in this report are generated using Mordor Intelligence’s proprietary estimation framework, updated with the latest available data and insights as of 2026.
Market Trends and Insights
Drivers Impact Analysis of Artificial Tendons and Ligaments Market*
| Driver | (~) % Impact on CAGR Forecast | Geographic Relevance | Impact Timeline |
|---|---|---|---|
| Sports-related ligament trauma surge | +3.2% | Global (North America, Europe highest) | Short term (≤ 2 years) |
| Preference for minimally invasive techniques | +2.8% | Global | Medium term (2-4 years) |
| Outpatient orthopedic surgery expansion | +1.9% | North America, Europe, developed APAC | Medium term (2-4 years) |
| Accumulating next-generation clinical data | +1.7% | Global | Medium term (2-4 years) |
| OEM investment in hybrid bio-synthetics | +2.5% | Global (early gains North America, Europe) | Long term (≥ 4 years) |
| Source: Mordor Intelligence | |||
Rising Global Incidence of Sports-Related Ligament Trauma
Annual ACL reconstructions now reach 400,000, translating to 18 injuries per 100,000 population and higher incidence among athletes. The economic burden extends to rehabilitation and productivity losses, propelling demand for solutions that shorten recovery periods. North America and Europe feel the strongest pull due to organized sports participation and insurance coverage that reimburses ligament reconstruction. Emerging sports leagues in Asia-Pacific add new procedure volumes and last-mile growth. Consequently, hospitals and ASCs invest in advanced graft options that offer immediate mechanical stability and quicker return-to-play timelines.
Growing Preference for Minimally Invasive Techniques
Arthroscopic methods now constitute more than 85% of ligament reconstructions[1]Li Ma et al., “Silk Fibroin-Based Scaffolds for Tissue Engineering,” Frontiers in Bioengineering and Biotechnology, frontiersin.org. Clinical evidence from 2024 shows higher functional scores at 1- and 3-month check-ups when autologous tendons are augmented with LARS devices compared with traditional techniques. Surgeons favor all-inside approaches that lessen soft-tissue disruption, reduce narcotic use, and enable same-day discharge. Device makers respond with thinner, pre-loaded synthetic grafts compatible with single-portal instrumentation, supporting current procedural trends across high-volume ASC networks.
Expansion of Outpatient Orthopedic Surgery Infrastructure
ASC orthopedic case counts climbed 84% from 2022 to 2023, and projections show 68% of orthopedic procedures moving to ASCs by the mid-2020s. The cost of ASC-based ligament reconstruction runs 35-45% lower than hospital pricing, enticing payers and self-insured employers. CMS has broadened coverage codes for ASC ligament repairs, further accelerating volume migration. Medicare’s dedicated codes for outpatient tendon repair accelerate the adoption of premium biologics and support the use of bundled payment models. Manufacturers that supply disposable instrumentation kits and pre-sterilized implants aligned with ASC workflows attract premium shelf space and surgeon loyalty.
A 2025 meta-analysis showed synthetic augmentation reduces re-rupture odds ratio to 0.17 and lifts return-to-sport odds ratio to 1.58 versus conventional grafts. The LARS system reports Lysholm scores at 90.61 and low 3.8% failure rates in middle-aged patients. FDA-approved BEAR implants have treated more than 4,000 patients since 2020 with registry data confirming favorable outcomes. Such evidence mitigates decades-old skepticism and opens payer pathways for premium device reimbursement.
Restraints Impact Analysis of Artificial Tendons and Ligaments Market*
| Restraint | (~) % Impact on CAGR Forecast | Geographic Relevance | Impact Timeline |
|---|---|---|---|
| Surgeon skepticism from historical failures | -1.8% | Global | Medium term (2-4 years) |
| High implant and procedure costs | -1.4% | APAC, Latin America, MEA | Short term (≤ 2 years) |
| Tightening regulatory requirements | -1.2% | Europe, North America | Medium term (2-4 years) |
| Source: Mordor Intelligence | |||
Persistent Surgeon Skepticism from Historical Failures
Early synthetic grafts were withdrawn due to mechanical failure and synovitis, as detailed in 2024 literature reviews. Surgeons trained in that period remain cautious and delay adoption until 10-year follow-up data becomes available. Educational symposiums and registry reporting aim to bridge the trust gap, yet skepticism still slows purchasing cycles, particularly in community hospitals.
High Implant and Procedure Costs in Cost-Sensitive Economies
Premium hybrid grafts can cost 3-5× more than autograft solutions. Lower-middle-income countries face higher out-of-pocket payment ratios, reducing patient uptake and forcing surgeons to select budget options. Even in developed settings, payers request health-economic dossiers to justify premium reimbursement. Consequently, pricing pressure may temper adoption outside major urban centers.
*Our forecasts treat driver/restraint impacts as directional, not additive. The impact forecasts reflect baseline growth, mix effects, and variable interactions.
Artificial Tendons and Ligaments Market Segment Analysis
By Application:
Knee Dominates, Foot & Ankle AccelerateKnee reconstruction commanded 57.30% artificial tendons and ligaments market share in 2025 as roughly 400,000 ACL surgeries occurred worldwide. The artificial tendons and ligaments market size for knee treatments is forecast to climb steadily on the back of sports medicine volumes, rising older-adult activity, and evidence favoring PET-LARS augmentation in revision scenarios.
Foot and ankle injuries grow fastest at 13.62% CAGR, assisted by new implants tailored to lateral ligament complexes. Medline’s 2025 ATFL augmentation device demonstrates the sector’s commercial momentum. Surgeons seek synthetic options that improve mechanical stability where autograft harvest is limited. Hospitals in high-volume podiatry centers now bundle ankle ligament repairs with same-day rehabilitation protocols, expanding revenue per episode.
Shoulder repairs benefit from synthetic augmentation solutions that address rotator cuff re-tear rates, while spine and hip applications stay niche but gather momentum from specialized 3D-printed designs. Collectively, non-knee applications expand overall artificial tendons and ligaments market breadth and improve product mix profitability.


By Implant Type:
PET-LARS Leads, Hybrid Scaffolds SurgeSynthetic PET-LARS implants held 63.20% share in 2025, supported by four decades of mechanical reliability data. The artificial tendons and ligaments market size for PET devices scales with broad regulatory clearance and surgeon familiarity. Evidence indicates a 0.17 odds ratio for re-rupture when PET-LARS augments ACL repair.
Hybrid 3D-printed constructs register a 16.85% CAGR to 2031, reflecting demand for devices combining immediate strength with biologic integration. OEMs employ multiscale biomimicry—porous tendon sheaths and nanohybrid collagen-mimetic fibers—to hasten tissue ingrowth. Early adopters situate hybrid grafts in revision and complex primary cases, where mechanical stability and biology both matter. This segment’s rapid expansion realigns R&D budgets and acquisition targets toward materials science innovators.
By Material:
PET Remains Mainstay, Silk EmergesPET continues leadership at 65.10% market share thanks to its tensile resilience and decades-long clinical track record. Manufacturers pursue surface etching and bioactive coatings to enhance cell adhesion without sacrificing PET’s fatigue resistance. Silk rises as a disruptive candidate, expanding 15.05% CAGR amid breakthroughs in artificial spider silk that replicates native protein motifs. Early silk devices show promising elasticity and biodegradation profiles, positioning the material for broad orthopedic utility pending regulatory traction.
By Procedure:
Primary Dominates, Revision OutpacesPrimary reconstruction accounts for 70.40% of cases as first-time injuries remain common in contact and pivot sports. Artificial tendons and ligaments market share for revision surgeries increases swiftly because synthetic grafts circumvent tunnel widening and scarce autograft supply. Revision CAGR of 13.67% owes to single-stage techniques using fast-setting bone graft substitutes that convert two-stage operations into one procedure. Payers support revision adoption when synthetic grafts shorten OR time and hospital stay.
By End User:
Hospitals Rule, ASCs ScaleHospitals retain 61.10% share due to complex multi-ligament workload and access to imaging, but ASC volumes rise 13.54% CAGR. Artificial tendons and ligaments market size growth in ASCs mirrors payer push for site-of-care cost-containment and patient preference for shorter stays. Device makers optimize packaging, instrumentation, and sterilization cycles to suit ASC throughput and staff constraints.
Geography Analysis
Europe Artificial Tendons and Ligaments Market
Europe leads with 37.60% share, aided by historical openness to synthetic ligaments and reimbursement structures that fund premium devices. Countries such as France and Germany widely implant LARS grafts, while new MDR compliance adds regulatory workload that can slow novel product launches. Sports such as soccer and skiing, coupled with aging athlete populations, preserve high procedure demand.
North America Artificial Tendons and Ligaments Market
North America places second, underpinned by roughly 200,000 ACL reconstructions annually and accelerating BEAR implant uptick. The outpatient shift dominates strategic planning, with ASCs performing 68% of orthopedic procedures. Early adoption channels foster demand for minimally invasive, hybrid grafts compatible with single-portal techniques.
APAC Artificial Tendons and Ligaments Market
Asia-Pacific marks the fastest 12.92% CAGR on broader insurance coverage, sports league growth, and robust medical tourism. China’s domestic players increase pricing pressures, whereas Japan contributes silk-based biomaterial breakthroughs that feed global pipeline innovation. India’s urban sports medicine clinics bolster shoulder and foot-ankle markets despite persistent price sensitivity.
MEA and South America Artificial Tendons and Ligaments Market
South America and Middle East & Africa show moderate growth centered in major metros. Brazil leverages a passionate soccer culture that elevates ACL volumes, while GCC nations allocate sovereign funds to sports medicine centers serving both residents and inbound medical tourists. Currency fluctuations and unequal insurance access shape purchasing decisions for premium implants.

Regulatory Landscape
In the United States, the FDA 510(k) pathway remains the primary access route for synthetic tendon and ligament implants used in orthopedic repair. Substantial equivalence dossiers, bench performance testing, sterilization validation, and biocompatibility assessments are central elements of the submission approach, with requirements mapped to FDA-recognized consensus standards.
In Europe, Medical Device Regulation (EU) 2017/745 tightens expectations for clinical evidence and post-market surveillance, including PMS under Articles 83-86. The resulting MDR constraints on relying on equivalence increase the burden on new entrants, since clinical investigations and ongoing PMCF are expected for higher-risk indications and novel biomaterials.
Competitive Landscape
The market remains moderately fragmented yet consolidating. Stryker’s 2024 acquisition of Artelon adds differentiated synthetic fixation products to its sports medicine line[3]Stryker, “Stryker Announces Definitive Agreement to Acquire Artelon, Inc.,” stryker.com. Corin’s LARS system maintains brand equity as the longest-standing synthetic graft. Zimmer Biomet and Smith+Nephew pursue silk and hybrid technologies through university collaborations to diversify beyond PET.
Hybrid scaffold innovators gain traction by licensing additive-manufacturing IP to multinationals seeking portfolio refreshment. Competitive intensity focuses on showing non-inferiority to autograft in randomized trials and securing payer coverage amid higher acquisition costs. White-space opportunities lie in defense health systems, where ligament injuries during training occur at 0.42 per 1,000 exposures. Market entry success often hinges on offering rugged, field-suitable kits and rapid rehabilitation outcomes. Academic-industry partnerships accelerate biopolymer and surface-chemistry enhancements, aiming to secure long-term outcome data that finally allays surgeon reservations.
Artificial Tendons and Ligaments Industry Leaders
Arthrex Inc.
Stryker Corp.
Corin Group
Xiros Ltd. / Neoligaments
Cousin Biotech
- *Disclaimer: Major Players sorted in no particular order
Artificial Tendons and Ligaments Market Companies Covered in this Report
- Arthrex
- Stryker
- Corin Group
- Xiros Ltd. / Neoligaments
- Mathys
- Orthomed
- FH Orthopedics (Enovis)
- Cousin Biotech
- FX Solutions
- Shanghai PINE & POWER Biotech
- Artelon
- Smith+Nephew plc
- Zimmer Biomet
- Integra LifeSciences
- Miach Orthopaedics
- Bioretec Ltd.
- AlloSource
- MTF Biologics

Market Opportunities and Future Outlook
Regulatory clearances and related commercial actions in 2026 point to openings for broader U.S. adoption of synthetic ligament platforms beyond the knee. Movmedix announced its U.S. commercial entry after FDA 510(k) clearance on June 10, 2026 for its LARS ACJ synthetic ligament system, which reflects continued channel build-out for upper-extremity ligament stabilization.
At the same time, AlloSource launched an FDA 510(k)-cleared ReConnex Pre-Sutured Tendon for all-inside ACL procedures. The positioning aligns with minimally invasive techniques and outpatient throughput priorities, where pre-sutured device formats can better fit ASC workflow expectations.
Recent Industry Developments in Artificial Tendons and Ligaments Market
- July 2026: AlloSource introduced the FDA 510(k)-cleared ReConnex Pre-Sutured Tendon for all-inside ACL reconstruction. The pre-sutured configuration reduces intraoperative prep time and supports consistent technique in high-throughput ambulatory settings, expanding the practical utility of PET-based ligament constructs.
- June 2026: Movmedix announced U.S. commercial entry following FDA 510(k) clearance on June 10, 2026 for its LARS ACJ synthetic ligament system. The announcement broadens the U.S. sports-medicine channel for upper-extremity ligament stabilization and increases competitive focus on clinical evidence and surgeon training.
- June 2024: Stryker completed its acquisition of Artelon, adding synthetic soft-tissue fixation and biomaterial capabilities into its sports medicine portfolio. The deal strengthened Stryker’s ability to bundle implants and fixation solutions across tendon and ligament repair workflows.


Artificial Tendons and Ligaments Market Report Scope and Research Methodology
Market Definition and Coverage
This market covers revenue generated from artificial tendon and ligament implants used to reconstruct or reinforce damaged soft tissue in orthopedic procedures, including primary and revision surgeries, across hospitals and ambulatory surgical centers.
Scope exclusions: It excludes biologic graft harvesting services, general suture and fixation-only products, and physical therapy or rehabilitation services after surgery.
Segments Covered in This Report
- By Application
- Knee Injuries (ACL, PCL)
- Shoulder Injuries (RC, SLAP)
- Foot & Ankle Injuries (ATFL, Achilles)
- Spine Injuries
- Hip Injuries
- By Implant Type
- Synthetic (PET-LARS, Carbon-Fiber, UHMWPE)
- Biological Augmented (Collagen-Coated PET, Porcine SIS)
- Hybrid 3-D Printed Scaffolds
- By Material
- Polyethylene Terephthalate (PET)
- Polypropylene
- Carbon Fiber
- Silk & Other Bio-polymers
- By Procedure
- Primary Reconstruction
- Revision Reconstruction
- By End User
- Hospitals & Specialty Orthopedic Centers
- Ambulatory Surgical Centers
- Sports Medicine Clinics
- Defense & Military Hospitals
- By Geography
- North America
- United States
- Canada
- Mexico
- Europe
- Germany
- United Kingdom
- France
- Italy
- Spain
- Rest of Europe
- Asia-Pacific
- China
- Japan
- India
- South Korea
- Australia
- Rest of Asia-Pacific
- Rest of the World
- North America
Data Sources, Market Sizing, and Validation
Desk Research
Desk research started with mapping the surgery and implant context, so we could anchor the model to real procedure flows and adoption constraints. Public sources such as the US FDA device databases, the US CDC injury and procedure statistics, the OECD health statistics, and World Bank population and health spending indicators were used to build the base demand signals. We also referenced peer-reviewed orthopedic and sports medicine journals to understand revision rates, typical indications (knee, shoulder, foot and ankle), and how outcomes influence surgeon preference.
Next, we used company annual reports, investor presentations, and reputable medical association websites to frame pricing corridors and channel structures, which are then checked against broader health system signals. Where helpful, a paid subscription covering company financials and news, and a paid patent database, were used to validate timelines for product launches and technology shifts that can change average selling prices. The desk sources listed here are illustrative only, and many other public documents were used for clarification, cross-checks, and final validation.
Primary Interviews and Surveys
Primary interviews and surveys were used to pressure test the desk assumptions around procedure mix, implant adoption, and pricing changes that tend to shift as surgeons move between synthetic and newer scaffold approaches. We spoke with orthopedic surgeons, sports medicine specialists, ambulatory surgery center administrators, and procurement focused roles, and then we validated the same themes with distributors and device-focused subject experts across APAC, EMEA, and the Americas.
Distribution of primary research fieldwork respondents
| Company type | Respondent position | Region |
|---|---|---|
| Top tier: 32% | CXOs: 18% | APAC: 43% |
| Mid tier: 49% | Functional/Unit leaders: 30% | EMEA: 35% |
| Smaller Players: 19% | Managers: 52% | Americas: 22% |
Market-Sizing & Forecasting
The sizing model is built using a top-down approach where procedure volumes and treated-case pools are reconstructed by country, and then converted to implant demand using penetration rates for artificial tendons and ligaments. Once the treated pool is formed, pricing is applied through region-specific average selling prices that reflect typical reimbursement realities and site-of-care mix, and the totals are aggregated to regional and global values.
To keep the model grounded, the main inputs include sports injury incidence, orthopedic reconstruction procedure counts, revision reconstruction share, hospital versus ambulatory surgery center split, and observed price movements for synthetic ligament systems. Where data is thin, gaps are handled by using proxy indicators such as orthopedic surgeon density, elective surgery recovery trends, and health expenditure per capita, followed by careful normalization so small countries are not overstated.
Forecasting was done using scenario analysis supported by exponential smoothing on procedure volumes, and then adjusted using expert views on adoption and pricing. In parallel, we corroborated the totals with selective bottom-up approximations, such as sampling average selling prices from procurement discussions and multiplying by implied unit demand from procedure checks, and then tuning assumptions where mismatches were consistently observed.
Data Validation & Update Cycle
Validation happens in steps, starting with cross-checking the model outputs against independent signals like orthopedic procedure trends, site-of-care shifts, and regional health spending direction. If a country-level estimate looks unusually high or low, the assumptions behind penetration, pricing, and revision share are revisited, and targeted follow-up conversations are triggered to resolve the gap.
Before sign-off, the work is reviewed by another analyst who checks arithmetic, unit logic, and whether the narrative matches the quantified drivers. Reports are refreshed annually, and interim updates are made when material events occur, such as policy changes affecting elective surgeries or meaningful technology launches. Right before delivery, a final pass is done so clients receive the most current view available.
Mordor Intelligence's Artificial Tendons and Ligaments Market Sizing Compared With Other Published Estimates
Published market sizes for artificial tendons and ligaments can differ even when they are describing the same clinical area, because scope boundaries and unit-to-revenue conversions are not aligned. Differences usually come from what gets counted as an implant, which procedures are included, and how pricing is averaged across hospitals and outpatient settings.
By tracking procedure mix and refresh timing, Mordor Intelligence links the market to treated reconstruction demand and applies pricing by end user, which reduces inflation from adjacent soft tissue repair products that are sometimes grouped into the same bucket. Gaps can also come from aggressive versus conservative adoption assumptions for newer scaffold designs, and from currency conversion choices when regional numbers are rolled into a global total.
Benchmark comparison
| Source | Market Size | Gaps in Research Methodology |
|---|---|---|
| Mordor Intelligence | USD 50.53 M (2026) | |
| Industry Publisher A | USD 49.34 M (2026) | Uses a longer forecast window and may smooth pricing across regions, which can understate near-term ASP uplift where outpatient volume is rising faster. |
| Research Firm B | USD 38.92 M (2025) | Starts from an earlier base year and relies more on historical revenue progression, which can miss the step change in procedure recovery and penetration after elective surgery normalization. |
The spread in the table is mostly explained by the year selected, how procedure-driven demand is converted into units, and how pricing is averaged across care settings. When the assumptions are made explicit and checked against surgery activity signals, the resulting market size becomes easier to reproduce and to update as new clinical and pricing information comes in.


Key Questions Answered in the Report
What is the projected value of the artificial tendons and ligaments market in 2031?
The market is forecast to reach USD 90.47 million by 2031 on a 12.36% CAGR trajectory.
Which application segment is expanding the fastest?
Foot and ankle ligament repairs lead growth at 13.62% CAGR for 2026-2031.
How dominant is PET-LARS in implant type share?
PET-LARS systems represented 63.20% of revenue in 2025, maintaining segment leadership.
Why are ambulatory surgical centers important to market growth?
ASCs provide cost savings of 35-45% and are expected to handle 68% of orthopedic cases by the mid-2020s, driving implant demand.
What material shows the highest growth potential after PET?
Silk-based biomaterials are advancing 15.05% CAGR due to superior biocompatibility and biomimetic properties.
Which region is growing fastest and why?
Asia-Pacific posts a 12.92% CAGR, propelled by rising sports participation, expanding healthcare infrastructure, and growing medical tourism.
Page last updated on:


 Your data is secure and never sold or shared.


