
Artificial Skin Market Size and Share
Market Overview
| Study Period | 2020 - 2031 |
|---|---|
| Market Size (2026) | USD 3.41 Billion |
| Market Size (2031) | USD 4.60 Billion |
| Growth Rate (2026 - 2031) | 6.15 % |
| Fastest Growing Market | Asia Pacific |
| Largest Market | North America |
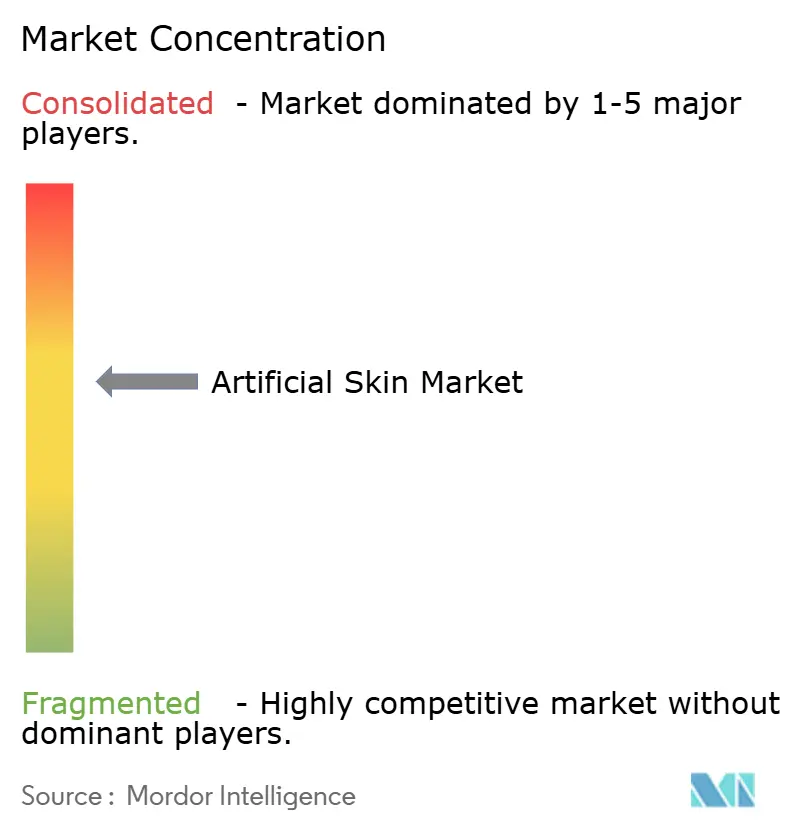
| Market Concentration | Medium |
Major Players *Disclaimer: Major Players sorted in no particular order Image © Mordor Intelligence. Reuse requires attribution under CC BY 4.0. | |
Artificial Skin Market Analysis by Mordor Intelligence
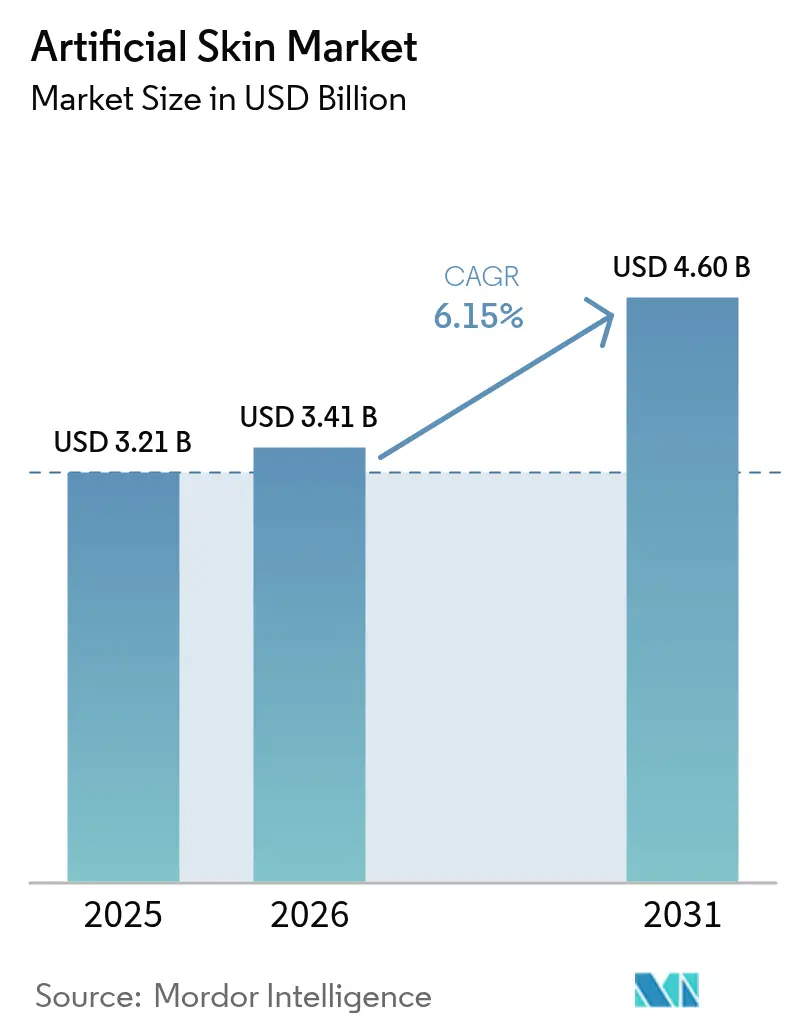
The global artificial skin market size, valued at USD 3.21 billion in 2025 and rising to USD 3.41 billion in 2026, is forecast to reach USD 4.60 billion by 2031, registering a 6.15% CAGR during 2026–2031. Payers and surgeons are pivoting toward solutions that shorten healing time, reduce readmission risk, and integrate monitoring, thereby shifting demand from disposable temporary grafts to composite constructs that offer longer residence and functional restoration. Embedded-sensor substitutes and 3D-bioprinted, patient-specific grafts that entered mid-stage trials in 2025 are expanding revenue streams through newly created remote-monitoring reimbursement codes. Defense and space-agency funding for extreme-environment grafts is accelerating dual-use R&D that incumbents can repurpose for civilian trauma care. Finally, supply-chain fragility in biological raw materials is pushing manufacturers to adopt bio-hybrid polymers that offer reproducible quality and lower cost volatility, further shaping product-mix dynamics inside the artificial skin market.
Key Report Takeaways
- By product type, temporary grafts led with 44.55% of the artificial skin market share in 2025, while composite/hybrid constructs are forecast to grow at an 8.85% CAGR through 2031.
- By replacement area, dermal replacement held 55.53% share of the artificial skin market size in 2025, and full-thickness composite solutions are advancing at an 8.75% CAGR through 2031.
- By material, natural collagen-based scaffolds captured 48.15% of the market in 2025, whereas bio-hybrid constructs are projected to expand at a 9.82% CAGR through 2031.
- By application, acute wounds accounted for 46.52% of revenue share in 2025; chronic wounds are set to grow at a 9.12% CAGR during 2026-2031.
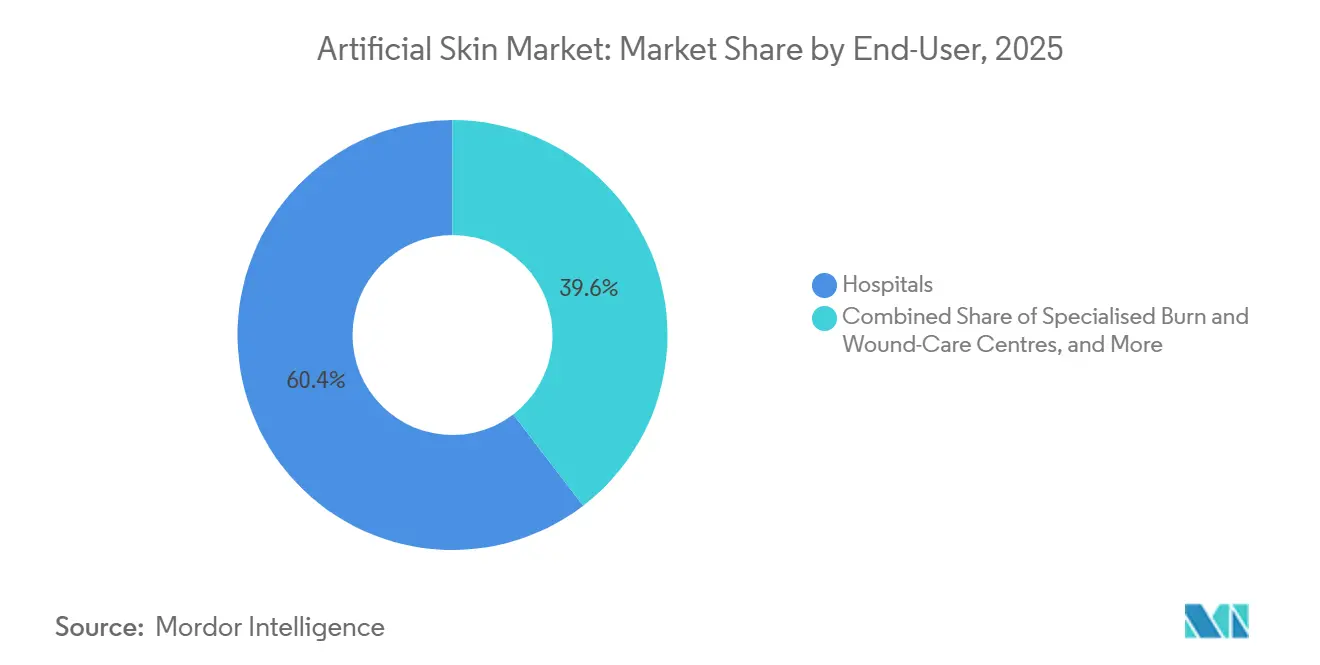
- By end user, hospitals accounted for 60.45% of 2025 revenue, yet ambulatory surgical centers are projected to exhibit the highest 10.62% CAGR to 2031.
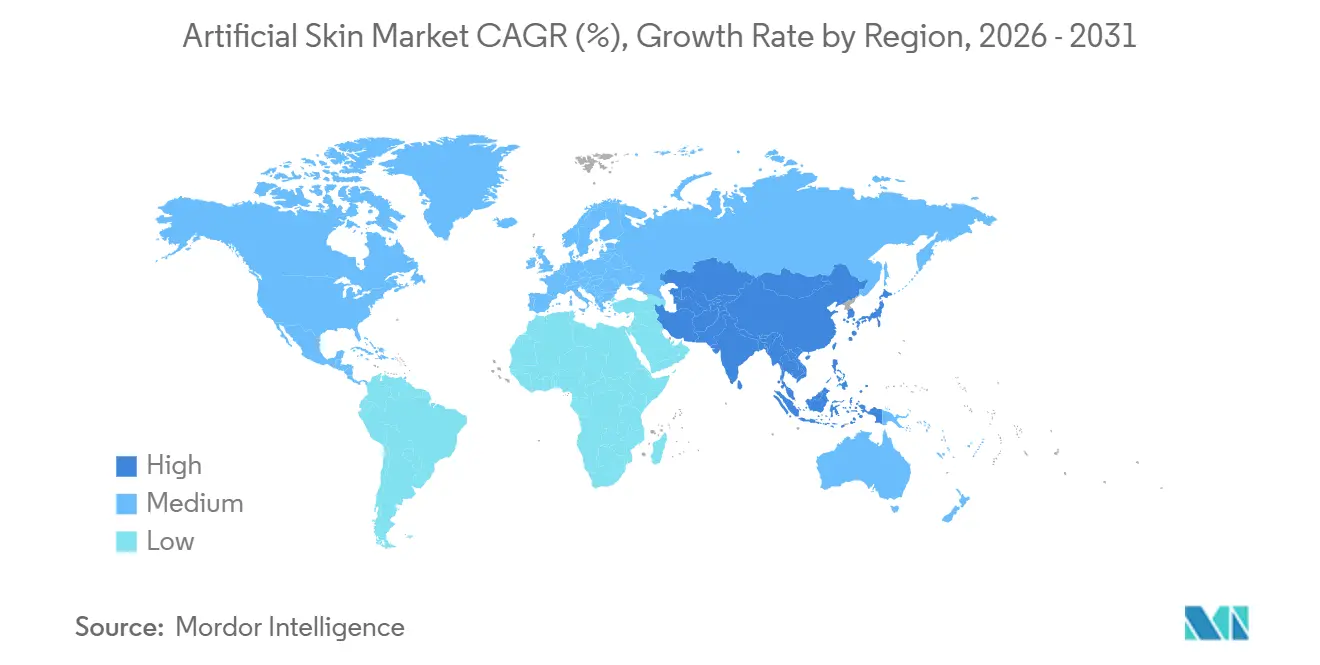
- By geography, North America dominated with a 39.55% share in 2025, while Asia-Pacific is on track for an 8.72% CAGR through 2031 as regulatory harmonization accelerates approvals.
Note: Market size and forecast figures in this report are generated using Mordor Intelligence’s proprietary estimation framework, updated with the latest available data and insights as of 2026.
Market Trends and Insights
Drivers Impact Analysis of Artificial Skin Market*
| Driver | (≈) % Impact on CAGR Forecast | Geographic Relevance | Impact Timeline |
|---|---|---|---|
| Technological Innovations in Regenerative Medicine | +1.2% | North America, EU | Medium term (2-4 years) |
| Increasing Incidence of Chronic & Acute Skin Injuries | +1.5% | Global, aging OECD | Long term (≥ 4 years) |
| Rising Geriatric & Diabetic Population | +1.3% | North America, Europe, APAC | Long term (≥ 4 years) |
| 3D-Bioprinted, Patient-Specific Grafts Entering Trials | +0.8% | North America, EU | Medium term (2-4 years) |
| Smart Sensor-Embedded Substitutes Unlocking Remote Reimbursement | +0.7% | North America, selective EU | Short term (≤ 2 years) |
| Defense & Space Grants Accelerating Extreme-Environment Graft R&D | +0.5% | North America, limited EU | Long term (≥ 4 years) |
| Source: Mordor Intelligence | |||
Technological Innovations in Regenerative Medicine
Electrospun nanofiber scaffolds that mimic extracellular matrix architecture gained FDA clearance in 2024 and cut re-epithelialization time by 40%, enabling outpatient autologous cell seeding and shifting procedures away from hospitals. Japan authorized iPSC-derived keratinocytes for clinical use in 2025, offering an unlimited cell source without donor-site morbidity. Patent activity around self-assembling peptide hydrogels rose 60% year-over-year in 2025, highlighting the push for injectable formulations that harden in situ and remove surgical debridement costs. Collectively, these advances reposition the artificial skin market toward faster, less invasive care settings, underpinned by materials that accelerate healing and widen provider adoption.
Increasing Incidence of Chronic and Acute Skin Injuries
The CDC recorded 6.3 million U.S. adults living with diabetic foot ulcers in 2025, and recurrence exceeds 40% within a year, even with standard care. Although burn admissions fell 8% between 2020 and 2025, average burn surface area per patient climbed 12%, strengthening demand for high-complexity grafts. Pressure ulcer incidence in long-term care facilities rose to 2.8 per 1,000 patient-days in 2025, underscoring the need for durable coverage that withstands extended immobilization. These trends collectively lift baseline demand for artificial skin products that promise durable closure, infection control, and cost-effective repeat use[1].
Rising Geriatric and Diabetic Population
Adults aged 65 years and older will represent 16% of the global population by 2030, while global diabetes prevalence reached 537 million in 2025. Geriatric skin fragility and neuropathic ulcers lengthen healing times, creating sustained pull for advanced grafts. Japan bundled artificial skin substitutes with continuous glucose monitoring in its 2025 reimbursement schedule, cementing the link between metabolic control and wound outcomes. Manufacturers are therefore integrating sensors and diagnostics to address chronic-care pathways, locking in higher lifecycle revenues inside the artificial skin market.
3D-Bioprinted, Patient-Specific Grafts Entering Trials
Organovo’s Phase II data, released in 2025, showed autologous bioprinted grafts lowering rejection rates to below 5% versus 18% for allogeneic options, saving USD 15,000-25,000 per year in immunosuppression. Production timelines fell from six weeks in 2023 to 72 hours in 2025, making on-demand grafting feasible for regional burn centers. Yet FDA treats bioprinted constructs as combination products, adding 18-24 months to approval, favoring well-capitalized firms with in-house regulatory scale[2].
Restraints Impact Analysis of Artificial Skin Market*
| Restraint | (≈) % Impact on CAGR Forecast | Geographic Relevance | Impact Timeline |
|---|---|---|---|
| High Treatment Costs & Budget Constraints | −1.1% | Emerging APAC, Latin America | Short term (≤ 2 years) |
| Stringent Multi-Regional Regulatory Frameworks | −0.9% | EU, Japan | Medium term (2-4 years) |
| Supply-Chain Fragility for Biological Raw Materials | −0.6% | Global, collagen dependent | Short term (≤ 2 years) |
| Limited Vascularization & Engraftment >20 Cm² | −0.7% | Global burn centers | Long term (≥ 4 years) |
| Source: Mordor Intelligence | |||
High Treatment Costs & Budget Constraints
Advanced biologic grafts cost USD 1,500-8,000 per 100 cm² while Medicare reimburses USD 12,000-18,000 per burn admission, forcing hospitals to absorb up to 40% of costs. In India, national reimbursement is USD 200-300 per burn procedure, effectively excluding premium grafts. Until synthetic or bio-hybrid alternatives reach parity pricing, cost misalignment will temper adoption in value-sensitive regions.
Stringent Multi-Regional Regulatory Frameworks
U.S. 510(k) clearance can be finalized within nine months, yet EU MDR demands clinical trials that extend approval to 24-36 months and add EUR 2-4 million in costs. Japan’s conditional pathway shortens entry but imposes seven-year surveillance. Divergent rules drain 15-20% of R&D budgets and slow time-to-revenue for small innovators.
*Our forecasts treat driver/restraint impacts as directional, not additive. The impact forecasts reflect baseline growth, mix effects, and variable interactions.
Artificial Skin Market Segment Analysis
By Product Type:
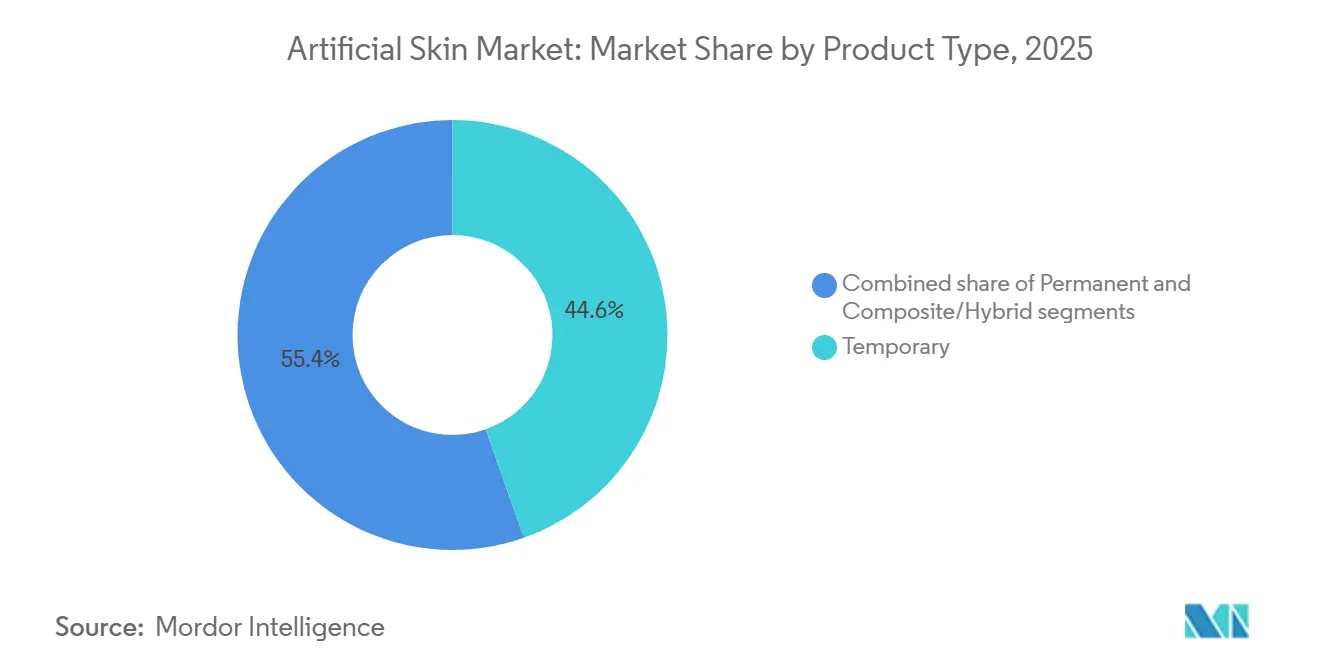
Composite Constructs Gain TractionTemporary grafts held a 44.55% share in 2025 for triage-oriented coverage, yet composite constructs are projected to grow at an 8.85% CAGR as clinicians favor single-stage closure. Hybrid matrices combine synthetic durability with biologic cues, lowering application frequency and infection risk, which aligns with bundled-payment incentives inside the artificial skin market.
Permanent grafts remain preferred for full-thickness burns but face supply and reimbursement headwinds, while temporary xenografts remain the preferred option for pediatric use due to their elastic properties. FDA clarified in 2024 that most composites qualify for 510(k) clearance, trimming launch timelines and accelerating category growth.

By Replacement Area:
Full-Thickness Solutions AccelerateDermal replacements captured a 55.53% share in 2025, yet full-thickness constructs are advancing at an 8.75% CAGR because they collapse two surgical stages into one, reducing anesthesia exposure and infection risk.
Epidermal-only sheets hold a minor share due to fragility, whereas emerging bioprinted constructs deposit epidermal layers directly on dermal scaffolds, boosting take rates to 85% in preclinical tests. Hospitals embracing bundled payments prize the shorter closure time of full-thickness grafts, steering demand toward integrated solutions across the artificial skin market.
By Material:
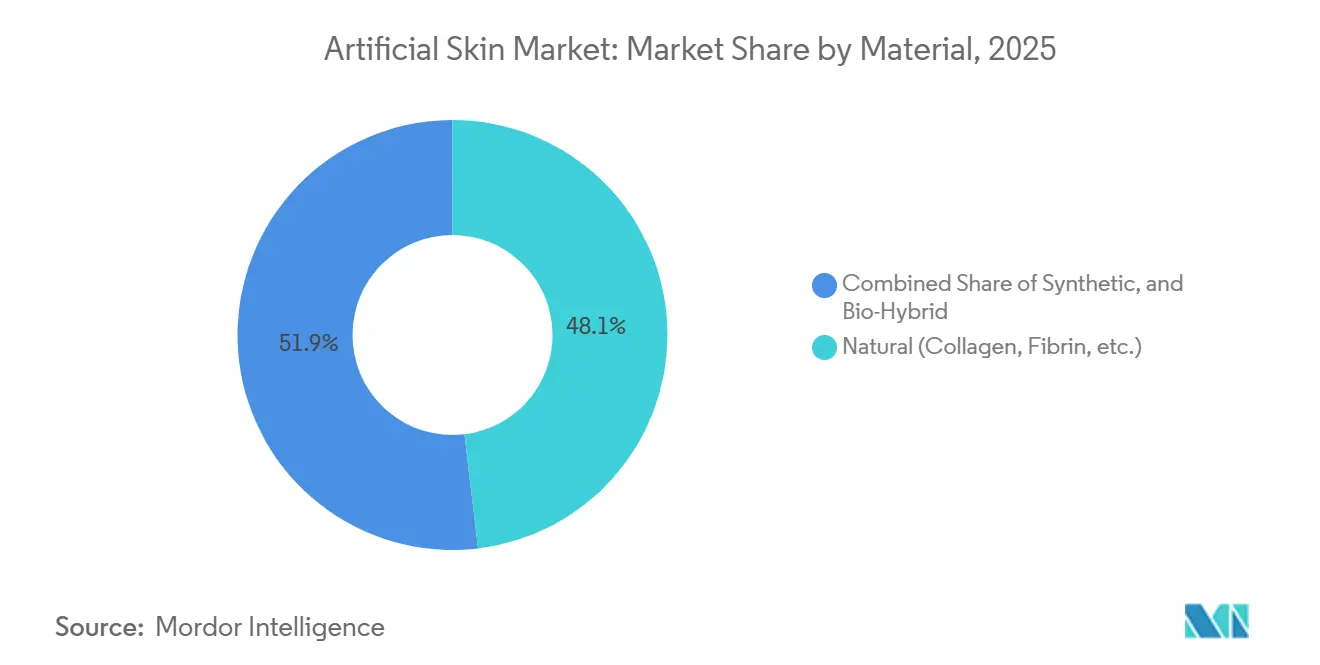
Bio-Hybrids Outpace Pure BiologicsNatural collagen matrices led with a 48.15% revenue share in 2025, but bio-hybrid scaffolds are expected to post a 9.82% CAGR through 2031 as they address batch variability and cost instability. Synthetic backbones functionalized with peptide motifs match natural engraftment speed while cutting rejection to single digits.
Synthetic-only films remain limited to short-term coverage, and newer fish-skin collagen products add competitive variety but still face regional approval hurdles. Functional minimalism design and stable input sourcing underpin the bio-hybrid advance in the artificial skin market.
By Application:
Chronic Wounds Gain MomentumAcute trauma accounted for 46.52% of the 2025 spend, but chronic wound care is on a 9.12% CAGR path because diabetic foot and pressure ulcers are rising faster than burn incidence. Diabetic ulcer recurrence above 40% turns each patient into a multi-episode consumer of grafts, scaling volume far beyond episodic burn needs.
Outpatient reimbursement delays still suppress penetration in diabetic ulcers, but new codes and sensor integration are shortening approval loops. Acute applications retain premium pricing in defense and disaster stockpiles, sustaining a barbell revenue mix within the artificial skin market.
By End-User:
Ambulatory Centers SurgeHospitals accounted for 60.45% of 2025 revenue, yet ambulatory surgical centers (ASCs) are forecast to grow at a 10.62% CAGR after CMS added skin-substitute procedures to the ASC list in 2024. Simplified techniques and room-temperature scaffolds enable office-based application, putting price pressure on hospital outpatient departments.
ASCs favor single-use, ambient-stable packaging that minimizes storage complexity, while hospitals keep high-TBSA cases needing intensive care. Suppliers that optimize for both settings gain broader coverage across the artificial skin market.
Geography Analysis
North America Artificial Skin Market
North America generated 39.55% of 2025 revenue thanks to broad reimbursement and high per-capita spend. Medicare covers advanced biologics at 2-3× European rates, allowing rapid uptake of sensorized grafts and bioprinted trials. Diverse burn center networks support clinical evidence generation, reinforcing regional leadership in the artificial skin market.
Europe Artificial Skin Market
Europe follows with robust clinical adoption but fragmented payer rules, which slow penetration in diabetic ulcers despite strong evidence. Germany finances advanced grafts for burns but not chronic wounds, while France demands cost-effectiveness data rarely generated for niche populations.
APAC Artificial Skin Market
Asia-Pacific is projected to grow at an 8.72% CAGR as Japan and South Korea harmonize with FDA standards and approve products within six months. China’s first domestically developed bioengineered skin, approved in 2025 at half the Western price, is broadening access in tier-2 cities. India’s reimbursement gap remains a drag, yet private hospitals in metropolitan hubs are adopting bio-hybrids to serve medical tourism flows, gradually expanding the artificial skin market footprint.
Regulatory Landscape
Regulatory requirements for artificial skin products keep diverging by region and by how much biologic or cellular activity the construct contains. In Europe, Regulation (EU) 2017/745 (MDR) remains the core framework as of January 1, 2026, with continued scrutiny around classification and conformity assessment for bioengineered and natural-material devices. Certain cellularized matrices can also fall under Advanced Therapy Medicinal Product (ATMP) considerations, which typically increases clinical evidence and oversight requirements versus standard device routes.
In the United States, FDA pathways cover 361 HCT/Ps, 510(k) cleared devices, and PMA-approved products, and many companies maintain portfolios across multiple routes. Integra LifeSciences, for example, operates with PMA-approved Integra Dermal Regeneration Template alongside other regulated offerings. Japan continues to use accelerated or conditional routes for novel regenerative approaches, but the extended post-market surveillance obligations (for example seven-year monitoring cited for the conditional pathway) affect time-to-revenue planning and lifecycle evidence generation for globally operating manufacturers.
Competitive Landscape
The top five companies command a significant share of global revenue, leaving moderate fragmentation that fuels price and innovation competition. Integra LifeSciences and Organogenesis leverage vertically integrated supply chains to secure gross margins of 60-70%, while regional players pursue cost-plus strategies for private-label products. Regulatory speed, reimbursement access and post-market registry data are the main competitive levers.
Emerging bioprinting startups bypass the cold chain, printing grafts on-site within 72 hours and reshaping distribution economics. Synthetic-biology ventures scaling recombinant collagen at 70-80% lower cost threaten natural-matrix incumbents. With ISO 13485 and cGMP compliance costing up to USD 10 million in upgrades, manufacturing remains an entry barrier that consolidates capacity among established firms.
Patent filings show strategic focus: Integra lodged 47 patents on collagen cross-linking for a 36-month shelf life, and Organogenesis filed 34 patents on cryopreservation, extending living-cell storage to 12 months. Sensor integration and pediatric growth-accommodating grafts are underserved niches where fewer than five viable products exist, offering white-space upside inside the artificial skin market.
Artificial Skin Industry Leaders
-
Integra Lifesciences Corporation
-
Smith & Nephew Plc
-
Medtronic
-
Molnycke Health Care AB
-
Baxter International Inc.
- *Disclaimer: Major Players sorted in no particular order
Artificial Skin Market Companies Covered in this Report
- Avita Medical Inc.
- Baxter
- ConvaTec Group plc
- EPISKIN S.A.S. (L’Oréal)
- Gunze Limited
- Integra LifeSciences
- Kerecis hf
- Medtronic
- MiMedx Group Inc.
- Molnlycke Health Care
- Organogenesis
- Hartmann Group
- PolarityTE
- RenovaCare Inc.
- Smiths Group
- Solventum Corporation
- Stratatech (Mallinckrodt)
- Tissue Regenix plc
- Vericel
Market Opportunities and Future Outlook
Reimbursement and evidence generation are creating near-term whitespace in chronic wound care pathways, where advanced skin substitutes compete more on total cost of care than unit price. In the United States, CMS finalized a single payment rate of USD 127.28 per square centimeter in 2026 across skin substitute product categories, and signaled differentiated payment based on FDA regulatory status starting in 2027. This sequence is pushing manufacturers to strengthen regulatory positioning and align around real-world outcomes data that supports premium placement as the payment framework evolves.
Clinical adoption opportunities are also tied to product designs and go-to-market programs that streamline use across hospitals and outpatient settings. Integra LifeSciences publicized real-world evidence for PriMatrix fetal bovine dermal scaffold from 985 cases presented in April 2026 at forums including SAWC and the American Burn Association Annual Meeting, underscoring how datasets can influence formularies and protocol inclusion. At the same time, wound-care portfolio refresh cycles, such as Smith+Nephew launching ALLEVYN COMPLETE CARE Foam Dressing in the United States in March 2026 with a European launch announced for later in 2026, support bundling around debridement, coverage, and monitoring, which can improve utilization of dermal replacement and composite approaches when they are integrated into standardized wound pathways.
Recent Industry Developments in Artificial Skin Market
- July 2026: Mölnlycke Health Care - Announced three U.S. product launches since the start of 2026: Granudacyn Wound Wash Solution, Tortoise Lite Turning and Positioning System, and Mepi Press 2 and Mepi Press 2 Lite Compression System. The portfolio expansion strengthens Mölnlycke's footprint in U.S. wound care and supports broader adoption of infection control and compression technologies within artificial skin and wound management ecosystems.
- April 2026: Integra Lifesciences - Unveiled new real-world evidence for PriMatrix Dermal Scaffold across multiple medical conferences (985 cases, 117 surgeons). The evidence bolsters credibility and supports wider clinical adoption of PriMatrix in dermal replacement strategies.
- March 2026: Smith & Nephew - Launched ALLEVYN COMPLETE CARE Foam Dressing, a multi layer wound dressing designed for advanced wound management. The product expands Smith & Nephew's wound care portfolio and strengthens leadership in chronic wound management.
Artificial Skin Market Report Scope and Research Methodology
Market Definition and Coverage
For this study, we define artificial skin as engineered skin substitutes used to cover, protect, and support healing or regeneration of damaged skin in medical care, including temporary and permanent solutions in wound and burn management, and selected reconstructive uses.
Scope exclusions: We exclude purely cosmetic topical products and general skincare items that do not function as medical skin substitutes.
Segments Covered in This Report
- By Product Type
- Permanent
- Temporary
- Composite / Hybrid
- By Replacement Area
- Dermal
- Epidermal
- Full-Thickness (Composite)
- By Material
- Natural (Collagen, Fibrin, etc.)
- Synthetic (PGA, PCL, PU, etc.)
- Bio-Hybrid
- By Application
- Acute Wounds (Burns, Trauma)
- Chronic Wounds (Diabetic, Pressure Ulcers)
- Cosmetic & Aesthetic Procedures
- By End-User
- Hospitals
- Specialised Burn & Wound-Care Centres
- Ambulatory Surgical Centres
- Geography
- North America
- United States
- Canada
- Mexico
- Europe
- Germany
- United Kingdom
- France
- Italy
- Spain
- Rest of Europe
- Asia-Pacific
- China
- India
- Japan
- Australia
- South Korea
- Rest of Asia-Pacific
- Middle East and Africa
- GCC
- South Africa
- Rest of Middle East and Africa
- South America
- Brazil
- Argentina
- Rest of South America
- North America
Data Sources, Market Sizing, and Validation
Desk Research
Desk work starts with making the market boundary clear, then collecting demand and supply signals that can be checked across public and official sources. We review public health and procedure context from sources such as the World Health Organization, the US CDC, and national health agencies that publish burn and wound burden indicators.
To translate clinical burden into addressable demand, we also refer to sources such as the National Institutes of Health, peer-reviewed journals indexed on PubMed, and regulator and reimbursement guidance where available (for example, FDA product databases and CMS coding and payment updates). Company filings, investor presentations, association websites, and reputable press releases are then used to track launches, manufacturing scale-ups, and mix shifts between temporary, permanent, and composite products. In some cases, paid subscription data covering company financials, patents, and import/export shipment level trade flows was used to cross-check revenue direction and material sourcing signals. These desk sources are illustrative rather than exhaustive, and we used other public and paid references to collect, validate, and clarify data points.
Primary Interviews and Surveys
Primary work was used to pressure test assumptions that desk sources cannot confirm cleanly, especially around adoption by care setting and the pace of product mix change. We spoke with a spread of stakeholders, including clinicians, procurement and supply chain teams, distributors, and product specialists, and used their input to validate utilization per case, pricing bands, and the pace of switching from traditional dressings to skin substitutes across key regions.
Distribution of primary research fieldwork respondents
| Company type | Respondent position | Region |
|---|---|---|
| Top tier: 28% | CXOs: 14% | APAC: 45% |
| Mid tier: 54% | Functional/Unit leaders: 38% | EMEA: 29% |
| Smaller Players: 18% | Managers: 48% | Americas: 26% |
Market-Sizing & Forecasting
Sizing is built with a top-down approach where the treated demand pool is reconstructed from wound and burn incidence, procedure and admission patterns, and the share of cases that clinically qualify for artificial skin use. From there, the model applies adoption by setting (hospitals, burn and wound centers, and ambulatory surgical centers) and converts volumes to value using typical price ranges by product type and replacement area.
To keep totals realistic, we corroborate results with selective bottom-up checks, such as rolling up sampled supplier and channel revenues and then comparing implied units against known care volumes. Key inputs used in the model include the split between acute and chronic wounds, the share of full thickness versus partial thickness coverage needs, average area treated per case, utilization of temporary versus permanent versus composite products, and regional pricing differences driven by reimbursement and procurement practices. Where direct volume data is thin, gaps are handled using conservative proxy ratios agreed in interviews, then re-tested against adjacent indicators like hospitalization trends and product launch momentum.
For forecasting, we rely on scenario analysis supported by regression-based sensitivity testing. The main drivers are expected case-load trends, adoption curves by setting, and price progression by material mix (natural, synthetic, and bio-hybrid). Assumptions are adjusted only after we hear consistent direction from multiple respondent types, then the resulting forecast is checked for year-to-year smoothness and clinical plausibility.
Data Validation & Update Cycle
Validation is done through multiple checks so the final numbers do not depend on one assumption. We compare model output against independent signals like procedure burden trends, reimbursement changes, and implied per-case spend, then investigate any variance that looks too high or too low for a region or application.
Before sign-off, the work is reviewed in steps, starting with internal consistency checks (units, prices, and mix) and followed by a second analyst review of the key drivers. If a major mismatch appears, the team re-contacts selected experts to re-check the assumption causing the drift. Reports are refreshed annually, and interim updates are made when material events occur, such as regulation shifts, major recalls, or sharp pricing changes. Right before delivery, an analyst performs a fresh pass so clients receive the most current view available at that time.
Mordor Intelligence's Artificial Skin Market Estimate Compared With Other Published Estimates
Published market values for artificial skin can look far apart because different studies count different product boundaries and use different demand pools for what qualifies as artificial skin. Differences also come from how each model treats pricing, whether values are measured at the manufacturer level or downstream, and how often assumptions are refreshed.
The table shows a spread that is mainly explained by scope and the conversion of clinical burden into treated, paid demand. In Mordor Intelligence's model, the total is built around medical skin substitutes across temporary, permanent, and composite products, and it is tied to wound and burn use cases with setting level adoption rather than broad biomaterials or general wound dressings.
Benchmark comparison
| Source | Market Size | Gaps in Research Methodology |
|---|---|---|
| Mordor Intelligence | USD 3.41 B (2026) | |
| Industry Research Publisher A | USD 3.46 B (2024) | This estimate appears to use a different base year and may include a wider set of wound care materials and related adjunct products, which can lift the starting value even if adoption rates are not separated by care setting. |
| Industry Research Publisher B | USD 2.50 B (2025) | This figure seems to focus on a narrower medical subset and uses conservative uptake and pricing bands, and it may not fully account for composite or hybrid products and higher reimbursement backed usage in specialized centers. |
Overall, the comparison points to two repeatable reasons for the gaps, which are market boundary choices and how case volumes are converted into paid utilization. By keeping inputs traceable to treated case pools, setting level adoption, and realistic price bands, the final number stays balanced and easier to reconcile when new clinical or reimbursement signals emerge.
Key Questions Answered in the Report
How large will the artificial skin market be by 2031?
It is projected to reach USD 4.60 billion by 2031, growing at a 6.15% CAGR from 2026 to 2031.
Which segment is expanding the fastest in artificial skin products?
Composite/hybrid constructs are forecast to grow at an 8.85% CAGR as clinicians adopt single-stage solutions.
Why are ambulatory surgical centers gaining share in artificial skin procedures?
CMS added skin-substitute applications to the ASC reimbursement list in 2024, enabling lower-cost outpatient treatments that are growing at a 10.62% CAGR.
What is the main driver for growth in chronic-wound applications?
Rising diabetes prevalence and high ulcer recurrence are pushing chronic-wound demand toward advanced grafts with remote monitoring capabilities.
Which region is expected to record the highest CAGR?
Asia-Pacific is set for an 8.72% CAGR as Japan and South Korea harmonize regulations and China approves lower-priced domestic products.
How are smart sensor-embedded grafts changing reimbursement?
They secured dedicated CMS codes in 2025 that pay USD 150 per week for remote monitoring, offsetting their higher unit price and expanding adoption.