
Artificial Intelligence Market Size and Share
Market Overview
| Study Period | 2020 - 2031 |
|---|---|
| Market Size (2026) | USD 0.43 Trillion |
| Market Size (2031) | USD 2.5 Trillion |
| Growth Rate (2026 - 2031) | 41.95 % |
| Fastest Growing Market | Asia-Pacific |
| Largest Market | North America |
| Market Concentration | High |
Major Players *Disclaimer: Major Players sorted in no particular order Image © Mordor Intelligence. Reuse requires attribution under CC BY 4.0. | |
Artificial Intelligence Market Analysis by Mordor Intelligence
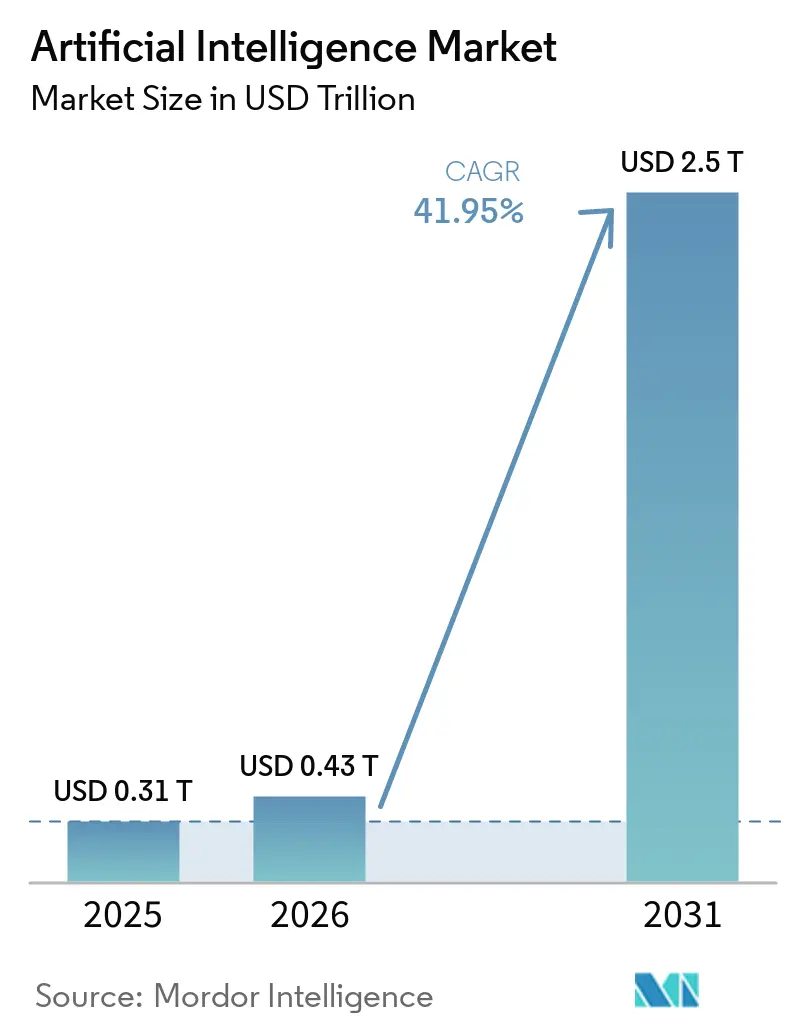
The Artificial Intelligence Market size was valued at USD 0.31 trillion in 2025 and is estimated to grow from USD 0.43 trillion in 2026 to reach USD 2.50 trillion by 2031, at a CAGR of 41.95% during the forecast period (2026-2031).
Sovereign AI programs, enterprise cost-optimization, and rapid hardware innovation are moving the technology from experimental pilots into core production workflows, fuelling sustained demand across every major sector. On-premise deployments are regaining traction because large organisations want direct control over total cost of ownership and data governance. At the same time, cloud hyperscalers are investing heavily in new capacity, ensuring that development environments remain easily accessible. GPU advances, energy-efficient architectures, and tighter integration between hardware and software stacks are shortening time to value and sharpening competitive differentiation.
Key Report Takeaways
- By component, Software led with 61.35% revenue share in 2025; Services is projected to book the fastest 45.85% CAGR to 2031.
- By deployment mode, Public Cloud held 43.72% share of the artificial intelligence market in 2025, whereas Hybrid models are anticipated to grow at 45.55% CAGR through 2031.
- By technology, Machine Learning controlled 41.12% share in 2025, while Generative AI is forecast to post a 46.25% CAGR through 2031.
- By end-user industry, IT & Telecommunications accounted for 27.02% of the artificial intelligence market share in 2025; Healthcare is set to expand at a 48.35% CAGR to 2031.
- By geography, North America commanded 37.12% of the artificial intelligence market in 2025, and Asia-Pacific is predicted to register a 44.75% CAGR through 2031.
Note: Market size and forecast figures in this report are generated using Mordor Intelligence’s proprietary estimation framework, updated with the latest available data and insights as of 2026.
Market Trends and Insights
Drivers Impact Analysis of Artificial Intelligence Market*
| Driver | (~) % Impact on CAGR Forecast | Geographic Relevance | Impact Timeline |
|---|---|---|---|
| Rising demand for predictive analytics | +8.2% | Global, with concentration in North America and Europe | Medium term (2-4 years) |
| Explosive growth in data volume/variety | +7.8% | Global, led by Asia-Pacific manufacturing and North America services | Long term (≥ 4 years) |
| Surging adoption of cloud-based AI services | +6.9% | North America and Europe core, expanding to Asia-Pacific | Short term (≤ 2 years) |
| Sovereign AI and national compute initiatives | +5.4% | Asia-Pacific, Europe, selective Middle East markets | Medium term (2-4 years) |
| Shift toward on-prem/private AI for TCO control | +4.1% | Global enterprise markets, strongest in regulated industries | Medium term (2-4 years) |
| Demand for energy-efficient AI hardware | +3.8% | Global, with early adoption in Europe and Asia-Pacific | Long term (≥ 4 years) |
| Source: Mordor Intelligence | |||
Sovereign AI and national compute programs
Government funding is shaping local ecosystems. India’s IndiaAI Mission is channeling INR 10,372 crore (USD 124.5 million) into indigenous large language models that meet local language needs[1]. Japan is mobilising JPY 10 trillion for AI and semiconductor capacity, signalling a long-term commitment to self-reliance. Such investments create protected demand for domestic hardware vendors and systems integrators that can comply with localisation rules, influencing AI market growth.
Explosive growth in data volume and variety
Industrial IoT rollouts generate terabytes of sensor data daily, pushing enterprises to adopt AI-driven analytics. Siemens reports 90% touchless invoice processing and USD 5.65 million annual ROI after embedding machine learning into its finance operations. Healthcare imaging, autonomous vehicles, and real-time retail transactions all add to the data deluge, driving up demand for scalable storage, edge processing, and synthetic data generation tools and supporting artificial intelligence market trends.
Surging adoption of cloud-based AI services
Microsoft’s intelligent-cloud revenue run rate surpassed USD 13 billion in 2025, supported by 31% year-over-year Azure growth. Amazon plans to deploy USD 100 billion in fresh AI capex over the next three years. These investments guarantee enterprises near-instant access to cutting-edge models while shifting upfront costs to consumption-based fees, accelerating proof-of-concept activity and shaping the artificial intelligence market forecast.
Shift toward on-prem or private AI for TCO control
Qualcomm’s new on-prem appliance line demonstrates hardware vendors’ response to customers who want predictable cost curves and lower latency for mission-critical workloads. Internal benchmarks show that large enterprises can trim 20% operating costs and cut inference latency by 50% compared with equivalent cloud services when utilization rates are high.
Restraints Impact Analysis of Artificial Intelligence Market*
| Restraint | (~) % Impact on CAGR Forecast | Geographic Relevance | Impact Timeline |
|---|---|---|---|
| High capex and talent shortages | -6.7% | Global, most acute in North America and Europe | Short term (≤ 2 years) |
| Data-privacy and compliance barriers | -4.2% | Europe (GDPR), Asia-Pacific (emerging regulations) | Medium term (2-4 years) |
| GPU / power-grid supply bottlenecks | -5.8% | Global, critical in Asia-Pacific manufacturing hubs | Short term (≤ 2 years) |
| Data-center carbon-emission caps | -3.1% | Europe, California, expanding to Asia-Pacific | Long term (≥ 4 years) |
| Source: Mordor Intelligence | |||
GPU and power-grid supply bottlenecks
NVIDIA cited persistent H100 shortages in its FY 2026 outlook, a constraint that has inflated spot prices 30-50% above MSRP and slowed enterprise deployment cycles. Power utilities forecast that data-center electricity demand could hit 1,050 TWh by 2026, exceeding planned capacity additions in several major regions, which in turn pressures project timelines for new AI clusters.
High capex and talent shortages
NVIDIA alone invested USD 1 billion across 50 start-up stakes during 2024, illustrating the capital intensity required to secure differentiation. Meanwhile, experienced MLOps engineers in Silicon Valley command 20-30% salary premiums versus 2023, stretching mid-market budgets and delaying new product launches.
*Our forecasts treat driver/restraint impacts as directional, not additive. The impact forecasts reflect baseline growth, mix effects, and variable interactions.
Artificial Intelligence Market Segment Analysis
By Component:
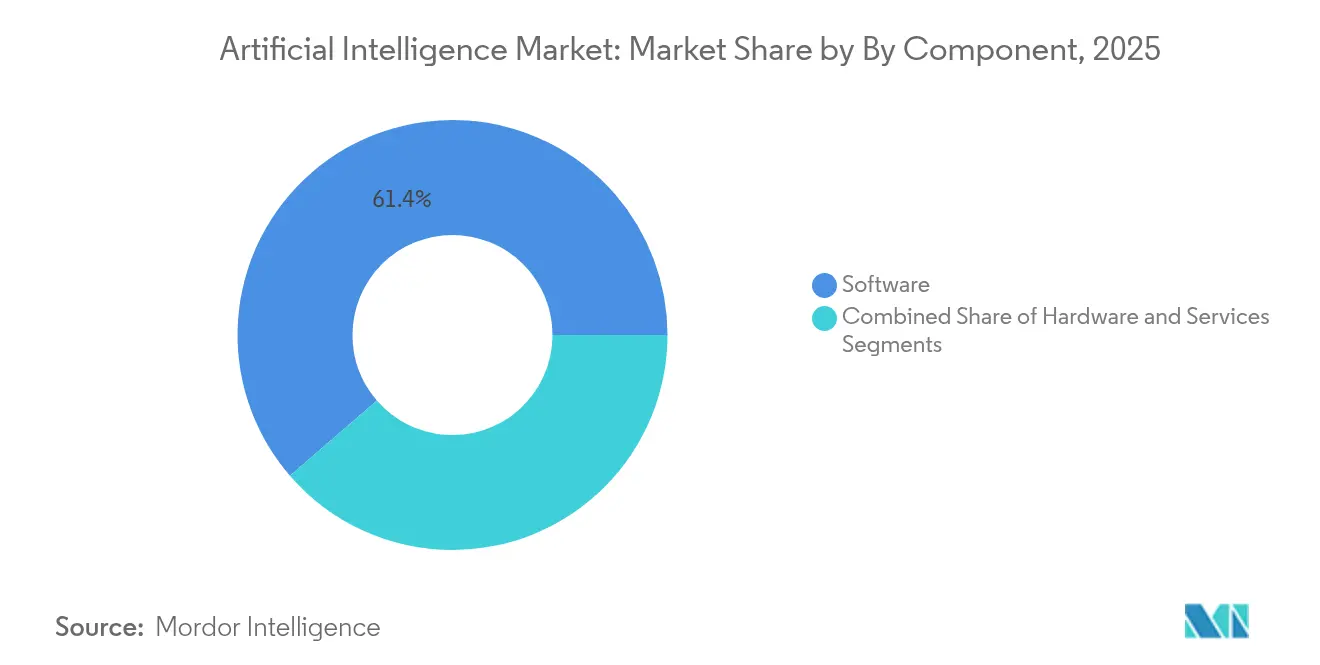
Services, acceleration signals, market maturationSoftware retained 61.35% revenue share in 2025, reinforcing its foundational role in the artificial intelligence market. Yet the Services segment is forecast to race ahead at 45.85% CAGR through 2031 as enterprises shift focus from experimentation to full-scale implementation. Many regulated industries now require vendors that can interpret compliance mandates and redesign workflows, rather than merely deliver licenses. The scarcity of qualified integrators, therefore, enables service providers to command premium pricing, especially for domain-specific projects in healthcare and financial services.
Across consulting, integration, and managed-services lines, vendors with vertical expertise are preferred. In radiology, service partnerships that combine data-governance, algorithm validation, and clinician workflow redesign are returning 451% ROI for hospital groups over five years. Specialists that package hardware, software, and advisory support into outcome-based contracts are moving up the value chain as customers measure projects against concrete productivity targets rather than abstract model accuracy.

By Deployment Mode:
Hybrid models bridge cloud-edge dividePublic Cloud held 43.72% of artificial intelligence market share in 2025, reflecting its role as the default development environment. Hybrid models, however, are projected to compound at 45.55% CAGR to 2031 as organizations seek latency optimization and cost visibility in production. Early adopters run training on hyperscale clusters then push inferencing to on-prem or edge devices for real-time response. Automotive OEMs validate this architecture by executing millisecond-level vision tasks on factory floors while retaining cloud elasticity for model retraining.
Edge rollouts are equally important in resource-constrained settings such as offshore rigs or retail outlets where bandwidth is expensive. On-prem deployments are resurging within finance and public-sector agencies that face strict data-residency mandates. Hardware suppliers now bundle orchestration software that migrates containers across clouds, on-prem racks, and edge devices based on policy rules, ensuring the artificial intelligence market size for hybrid solutions remains on an upward trajectory.
By Technology:
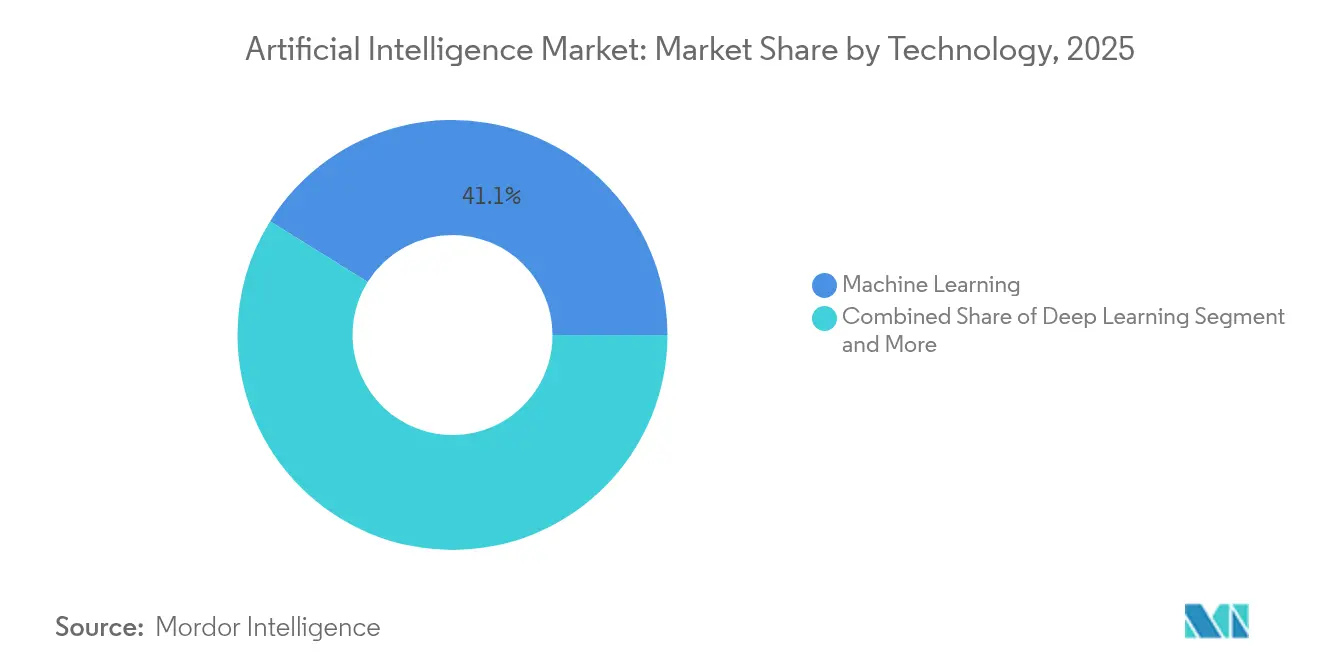
Generative AI disrupts traditional hierarchiesMachine Learning captured 41.12% share in 2025, yet Generative AI is forecast to surge at 46.25% CAGR through 2031 as enterprises extend use cases from marketing content to code generation and knowledge-based augmentation. Generative models that pair with retrieval-augmented generation frameworks are displacing rule-based chatbots and manual document processing in customer service centres.
Conversely, Computer Vision adoption continues inside smart factories and diagnostic imaging suites where pixel-level precision drives tangible cost savings. Natural Language Processing gains steady adoption for multilingual support functions. Context-aware computing, which fuses multiple sensing modalities, is moving into smart-city projects. Vendors that combine generative and discriminative techniques within a single platform are capturing cross-sell opportunities, thereby boosting the artificial intelligence market.
By End-user Industry:
Healthcare acceleration driven by regulatory clarityIT and Telecommunications held 27.02% market share in 2025, benefiting from extensive data resources and early cloud alignment. Healthcare is predicted to log the highest 48.35% CAGR through 2031 as regulatory pathways for diagnostic support tools become clearer. The US FDA cleared more than 110 AI-enabled radiology devices between January 2024 and May 2025, reducing reimbursement uncertainty and prompting hospital procurement cycles.
Manufacturing maintains strong demand for predictive-maintenance algorithms that curb unplanned downtime, while Retail and E-commerce invest in dynamic pricing engines that lift basket sizes. BFSI institutions deploy fraud detection platforms that reduce chargebacks and improve customer trust. Autonomous-driving initiatives keep Automotive investment robust, whereas Government and Defense agencies prioritize cyber-threat intelligence solutions that integrate AI-enabled anomaly detection.
Geography Analysis
North America Artificial Intelligence Market
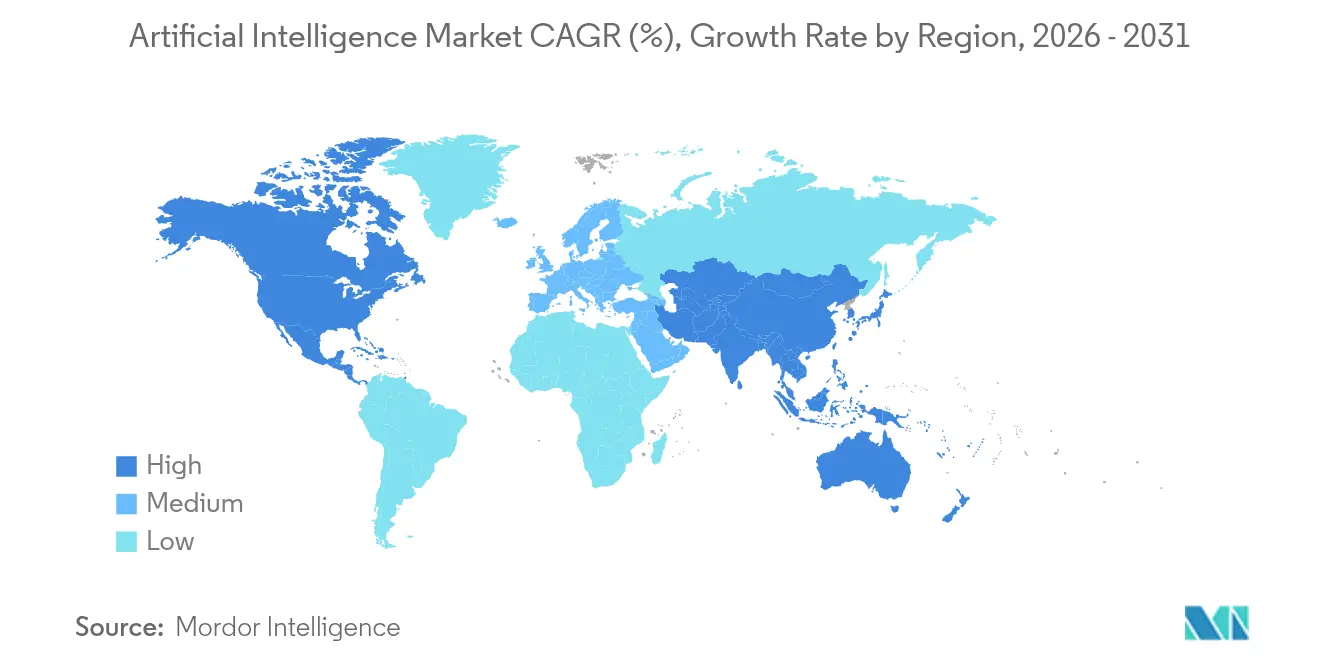
North America remained the revenue leader with 37.12% share in 2025 thanks to deep venture capital pools, mature cloud ecosystems, and rapid enterprise adoption. Federal programs such as the CHIPS and Science Act funnel additional funding into AI-ready fabs, supporting domestic hardware supply and reinforcing the artificial intelligence market. High-performance computing clusters in Virginia, Texas, and Oregon continue to attract software start-ups that co-locate near cloud availability zones for lower latency.
Europe Artificial Intelligence Market
Europe’s growth profile is shaped by the twin forces of strict data-privacy regulation and sizable sovereign compute budgets. GDPR compliant architectures push vendors to localize inference workloads inside regional borders, creating demand for on-prem GPU appliances. France’s public-private initiative around Mistral AI gained a €2 billion valuation in 2025 and aims to raise USD 1 billion to scale multilingual model training. Similar programs in Germany and the Nordics focus on green-data-center footprints that align with ambitious carbon-reduction targets, sustaining double-digit regional growth for the artificial intelligence market.
APAC Artificial Intelligence Market
Asia-Pacific is projected to register a 44.75% CAGR through 2031, the fastest worldwide. China’s National Semiconductor Mission allocates RMB 1 trillion by 2030 for chips and supporting infrastructure, while India earmarks INR10,372 crore for national AI compute, propelling domestic integrators into global rankings. Japan’s multi-trillion-yen fund fast-tracks fab upgrades and light-touch AI regulation that accelerates time to commercial deployment. Southeast Asian economies, including Singapore and Malaysia, are introducing data-center tax incentives that entice hyperscalers to anchor regional hubs, further enlarging the artificial intelligence market size in the region.
Regulatory Landscape
AI governance is tightening around risk-based controls, model transparency, and security obligations, creating differentiated compliance work by geography. In the European Union, Regulation (EU) 2024/1689 (EU AI Act) sets the core framework, with the European Commission AI Act Service Desk publishing an implementation timeline that enterprises use to plan conformity assessments, documentation, and post-market monitoring for high-risk systems.
In the United States, June 2026 presidential action, Executive Order 14409 (Promoting Advanced Artificial Intelligence Innovation and Security), emphasized securing AI deployment and hardening government infrastructure, including time-bound agency steps such as establishing an AI cybersecurity clearinghouse and defining benchmarking processes for covered frontier models. These parallel tracks, EU product-style compliance and US security-led governance, increase demand for auditability, governance tooling, and service partners that can map model life cycles to sector and jurisdiction requirements.
Value Chain Analysis
The AI value chain spans semiconductor design and manufacturing (compute accelerators, CPUs, networking silicon, and high-bandwidth memory), system integration (servers, racks, and data-center electrical and cooling), platform software (frameworks, MLOps, orchestration, and security), and downstream solution delivery through cloud providers, ISVs, and systems integrators into end-user workflows. Supply concentration remains highest in leading-edge compute and HBM, while grid power availability and data-center build timelines act as physical constraints on scaling training and inference capacity.
Partnerships show how participants are integrating across layers to secure capacity and shorten deployment cycles. In October 2025, Bharti Airtel and Google announced a mega AI hub and data center in Visakhapatnam, and in November 2025, OpenAI entered a seven-year compute agreement with AWS to run and scale AI workloads. In Europe, NVIDIA and Deutsche Telekom announced a Munich industrial AI cloud project built around DGX systems, reflecting a regionalized infrastructure pattern driven by data sovereignty and local compute availability.
Competitive Landscape
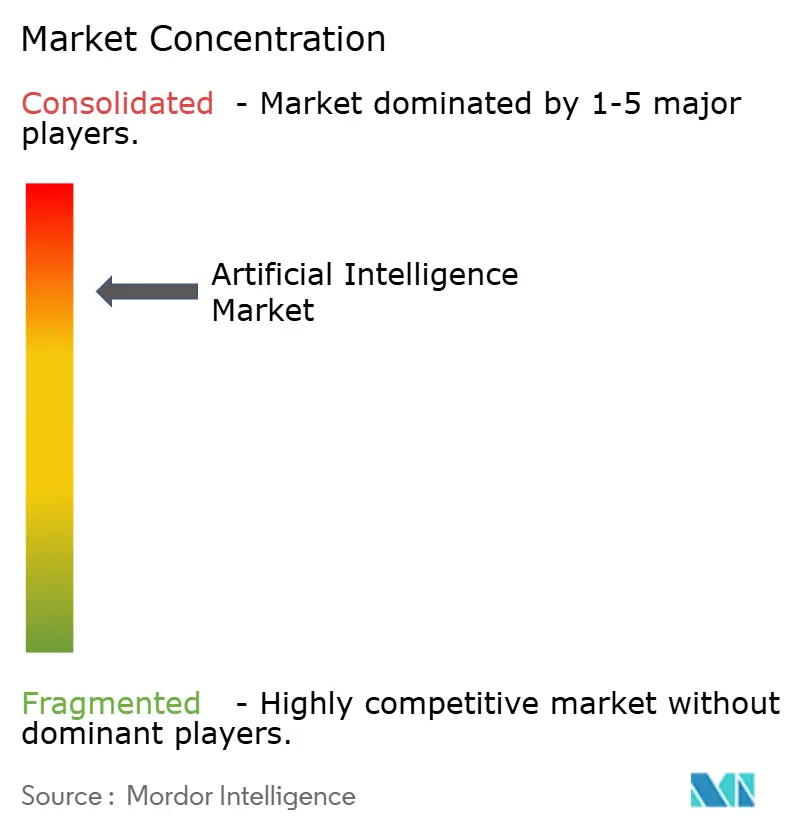
The market is consolidating around a few platform providers while leaving room for highly specialised challengers. NVIDIA captured above 80% share of AI accelerator shipments and posted USD 44.1 billion revenue in Q1 FY 2026, a 69% year-over-year jump. AMD responded with the Instinct MI325X, featuring 256 GB HBM3E and 6 TB/s bandwidth, outperforming NVIDIA’s H200 by 40% on Llama 3.1 inference benchmarks[3]. Intel, Graphcore, and start-ups such as Etched and Taalas have collectively raised more than USD 4 billion since 2024 to commercialize domain-specific hardware.
On the software side, OpenAI, Anthropic, and Cohere dominate foundation-model APIs. Anthropic tripled annualized revenue from USD 1 billion to USD 3 billion in the twelve months to December 2025 by positioning Claude for enterprise use cases that stress safety and auditability. Perplexity AI seeks to merge with TikTok’s US arm for USD 50 billion to couple real-time conversational search with short-form video engagement, illustrating how consumer platforms view integrated AI capabilities as an essential moat.
Systems integrators and consulting giants are scaling vertical practices. Accenture announced a USD 3 billion investment, including 40 AI studios worldwide, to build repeatable industry solutions. Deloitte, PwC, and Capgemini similarly expanded AI alliances with hyperscalers, targeting regulated industries that require turnkey governance frameworks. The resulting ecosystem competition is measured less by model parameter counts and more by proven cost savings and revenue uplift for end clients.
Artificial Intelligence Industry Leaders
-
IBM Corporation
-
Intel Corporation
-
Microsoft Corporation
-
Google LLC. (Alphabet Inc.)
-
Amazon Web Services Inc. (amazon.com Inc.)
- *Disclaimer: Major Players sorted in no particular order
Artificial Intelligence Market Companies Covered in this Report
- International Business Machines Corporation
- Intel Corporation
- Microsoft Corporation
- Google LLC (Alphabet Inc.)
- Amazon Web Services, Inc. (Amazon.com, Inc.)
- Oracle Corporation
- Salesforce, Inc.
- SAP SE
- SAS Institute Inc.
- Cisco Systems, Inc.
- Siemens AG
- NVIDIA Corporation
- Hewlett Packard Enterprise Company
- Accenture plc
- Baidu, Inc.
- Alibaba Cloud (Intelligent Cloud Business of Alibaba Group Holding Limited)
- Palantir Technologies Inc.
- OpenAI, Inc.
- Meta Platforms, Inc.
- Huawei Technologies Co., Ltd.
- Tencent Holdings Limited
- ServiceNow, Inc.
- Snowflake Inc.
Market Opportunities and Future Outlook
Gigawatt-scale data-center buildouts and cloud infrastructure co-design are creating whitespace for AI-optimized power, cooling, networking, and rack-scale systems that improve utilization and cost visibility for inference-heavy workloads. In July 2026, Meta expanded its Hyperion data center campus in Richland Parish, Louisiana to a reported 5GW plan with a total investment headline of USD 50 billion, highlighting how AI capacity increasingly depends on long-lead utility coordination and specialized infrastructure supply chains.
Platform opportunities are widening around enterprise productionization, especially agentic workflows, governance, and hybrid deployment controls that align model use with policy. June to July 2026 product and partnership activity from hyperscalers and enterprise vendors, including AWS introducing new AI agent building blocks at AWS Summit New York and IBM scaling multi-agent and modernization workflows for software development, reflects buyer pull for repeatable, auditable operating models beyond stand-alone pilots. Regulatory fragmentation is also supporting demand for cross-jurisdiction compliance engineering and assurance as countries advance distinct approaches to AI oversight and security.
Recent Industry Developments in Artificial Intelligence Market
- July 2026: IBM updated its agentic software development capabilities with new multi-agent functionality and specialized modernization workflows. The release targets production-grade use cases such as application transformation and developer productivity, reinforcing demand for enterprise AI software that can be governed and scaled beyond pilots.
- June 2026: AWS introduced new AI agent innovations at AWS Summit New York, including additions spanning agent building and orchestration capabilities for Bedrock. These launches broaden the managed toolchain available to enterprises building agentic applications, tightening the linkage between model access, workflow execution, and cloud operations.
- October 2024: Vodafone and Google deepened their strategic partnership with a 10-year, billion-dollar deal covering cloud, cybersecurity, and devices across Europe and Africa. The expanded relationship supports longer-term AI deployment at scale by anchoring data, security, and compute modernization under a single operating partnership.
Artificial Intelligence Market Report Scope and Research Methodology
Market Definition and Coverage
For this study, the market captures revenues generated from artificial intelligence solutions and services, plus enabling AI hardware, that are sold to organizations across major industries worldwide.
Scope exclusions: We exclude internal AI work that is not commercialized, open source-only usage without paid monetization, and one-off academic research activity without deployed business use.
Segments Covered in This Report
- By Component
- Hardware
- Software
- Services
- By Deployment Mode
- Public Cloud
- On-Premise
- Hybrid
- By Technology
- Machine Learning
- Deep Learning
- Natural Language Processing
- Computer Vision
- Generative AI
- Context-Aware Computing and Others
- By End-user Industry
- BFSI
- IT and Telecommunications
- Healthcare and Life Sciences
- Manufacturing
- Retail and E-commerce
- Automotive and Transportation
- Government and Defense
- Energy and Utilities
- Media and Entertainment
- Construction
- By Geography
- North America
- United States
- Canada
- Mexico
- South America
- Brazil
- Argentina
- Rest of South America
- Europe
- United Kingdom
- Germany
- France
- Italy
- Spain
- Nordics
- Rest of Europe
- Middle East and Africa
- Middle East
- Saudi Arabia
- United Arab Emirates
- Turkey
- Rest of Middle East
- Africa
- South Africa
- Egypt
- Nigeria
- Rest of Africa
- Middle East
- Asia-Pacific
- China
- India
- Japan
- South Korea
- ASEAN
- Australia
- New Zealand
- Rest of Asia-Pacific
- North America
Data Sources, Market Sizing, and Validation
Desk Research
Desk work was used to set the starting structure of the model and to sanity-check growth patterns by region and industry. We relied on non-paywalled public sources such as OECD AI policy and economy trackers, the World Bank macro indicators, the International Telecommunication Union connectivity statistics, the World Intellectual Property Organization patent datasets, and selected publications from NIST on AI risk and governance.
We also reviewed company filings and investor presentations to understand how AI revenues get reported (software, services, and hardware pull-through) and which end uses are being prioritized. To keep the inputs consistent over time, we supplemented with paid subscriptions focused on company financials and intelligence, news and financials, and broad patent databases, rather than relying on one-off announcements. The desk research sources listed here are illustrative only, and many other public materials were also used for data collection, validation, and clarification.
Primary Interviews and Surveys
Primary work focused on confirming what is actually being bought, deployed, and renewed, and how budgets are split between software licenses, services, and AI hardware. We spoke with a mix of solution providers, system integrators, enterprise buyers, and domain specialists across APAC, EMEA, and the Americas so regional adoption speed and pricing realities were reflected in the final view.
Distribution of primary research fieldwork respondents
| Company type | Respondent position | Region |
|---|---|---|
| Top tier: 28% | CXOs: 18% | APAC: 40% |
| Mid tier: 54% | Functional/Unit leaders: 39% | EMEA: 37% |
| Smaller Players: 18% | Managers: 43% | Americas: 23% |
Market-Sizing & Forecasting
Sizing started with a top-down build where enterprise IT spending patterns, cloud and data center expansion signals, and AI adoption rates by major industries were used to reconstruct the addressable revenue pool. The totals were then corroborated with selective bottom-up checks, such as sampled average selling price (ASP) by workload type multiplied by estimated deployment volumes, plus channel feedback on services attach rates to AI projects.
Key inputs in the model included AI software subscription and consumption pricing trends, professional services effort intensity per deployment, accelerator and server shipment momentum linked to AI workloads, enterprise AI workload penetration by industry, and regional timing differences tied to regulation and public-sector programs. Where bottom-up views were thin in smaller regions or niche industries, we filled gaps using proxy indicators like enterprise cloud usage growth and a conservative attach-rate method, which were then re-tested with follow-up expert calls.
For forecasting, we used scenario analysis tied to a small set of drivers that buyers could validate, including AI budget growth, compute availability and cost, deployment cycle time, and usage-based pricing expansion. The final scenario weights were aligned to what primary respondents described as their base case planning for the next 12 to 24 months.
Data Validation & Update Cycle
Outputs were checked against independent signals such as reported AI revenue lines where available, cloud infrastructure expansion trends, and AI hardware demand indicators. We also reviewed region-to-region variance to see whether any gaps appeared inconsistent with adoption reality. When an outlier was found, the assumptions behind penetration, ASP progression, or services mix were revisited, and the related inputs were revalidated with additional expert touchpoints.
Before sign-off, the model goes through multi-step analyst reviews where drivers, math, and scope alignment are checked separately, and then reconciled back to the narrative. Reports are refreshed annually, and interim updates are made when material events shift demand, pricing, or regulation. Before delivery, an analyst performs a fresh pass so clients receive the latest updated view.
Mordor Intelligence's Global Artificial Intelligence Market Size Compared Against Other Published Estimates
Different published AI market sizes can look far apart because the underlying scope is not the same, and because revenue is counted at different points in the value chain. We also see gaps when sources mix spending, investment, and supplier revenues into one number, which can inflate totals without a clear bridge.
Generative AI only estimates are another reason for spread since they capture a fast-growing slice but do not represent the full AI stack. Some publications also roll in adjacent IT categories (like broad data analytics and general cloud services) or use aggressive price and volume ramps without checking whether deployment cycles and compute constraints allow that pace, which then shifts the 2025 to 2026 run-rate a lot.
Benchmark comparison
| Source | Market Size | Gaps in Research Methodology |
|---|---|---|
| Mordor Intelligence | USD 434.42 B (2026) | |
| Industry Publication A | USD 757.58 B (2025) | Uses a broader solution lens that can blend AI with adjacent digital and automation spend, and it anchors the series to a different base year, which changes the run-rate when converted into a comparable revenue view. |
| Industry Analyst Brief B | USD 24644.00 B (2025) | Represents worldwide GenAI spending rather than supplier revenue, and it is limited to GenAI while still capturing downstream spend categories, so the figure is not directly comparable to an AI market revenue total. |
Generative AI spending sits outside Mordor Intelligence's scope for this market size when it is reported as end-user spend rather than supplier revenue, which is why one external number looks unusually large for 2025. Once figures are aligned on what is being measured (revenue vs spend), which AI categories are included, and the base year timing for currency and pricing, the remaining differences become easier to explain and to replicate with clear inputs.
Key Questions Answered in the Report
What is the current size of the artificial intelligence market in 2026?
The Artificial Intelligence Market size was valued at USD 0.31 trillion in 2025 and is estimated to grow from USD 0.43 trillion in 2026 to reach USD 2.50 trillion by 2031, at a CAGR of 41.95% during the forecast period (2026-2031)
Which segment is growing the fastest within the artificial intelligence market?
Services is expanding at a 45.85% CAGR through 2031 as enterprises seek integration expertise and ongoing optimisation.
Why are hybrid deployments becoming popular?
Hybrid architectures balance cloud scalability with on-prem cost control and data-sovereignty needs, supporting 45.55% CAGR to 2031.
Which region will register the highest growth in the artificial intelligence market?
Asia-Pacific is on track for a 44.75% CAGR through 2031 owing to sovereign AI funding and manufacturing automation programmes.