
AI In Food And Beverages Market Size and Share
Market Overview
| Study Period | 2020 - 2031 |
|---|---|
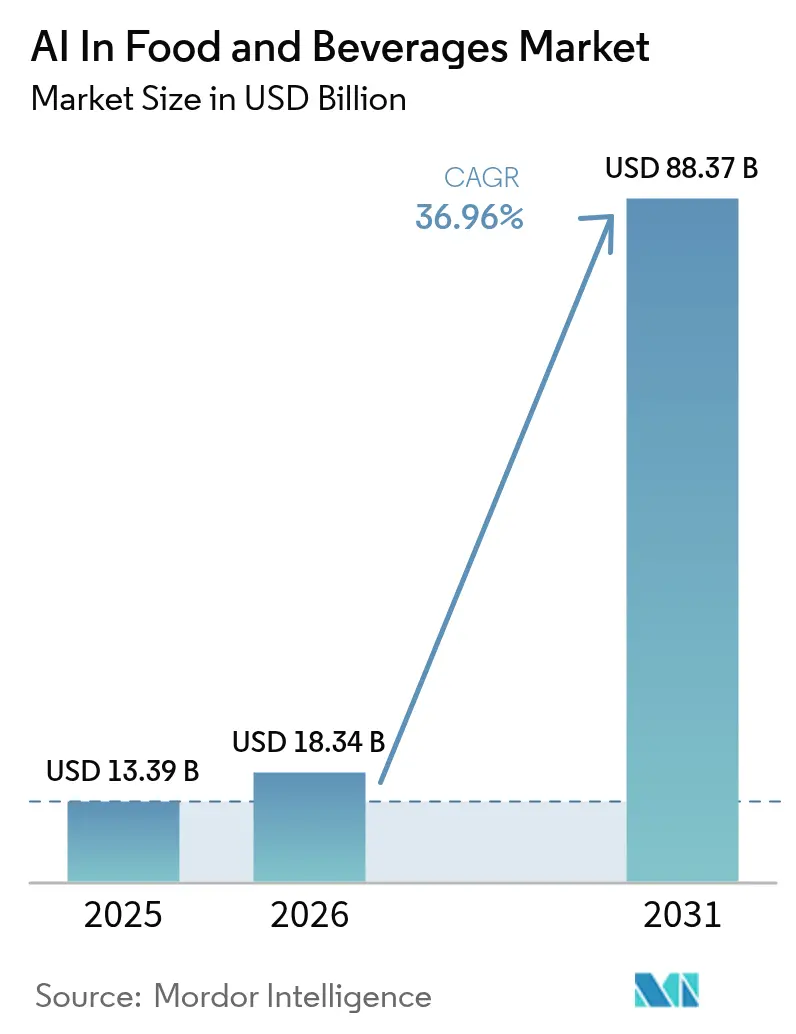
| Market Size (2026) | USD 18.34 Billion |
| Market Size (2031) | USD 88.37 Billion |
| Growth Rate (2026 - 2031) | 36.96 % |
| Fastest Growing Market | Asia Pacific |
| Largest Market | Asia Pacific |
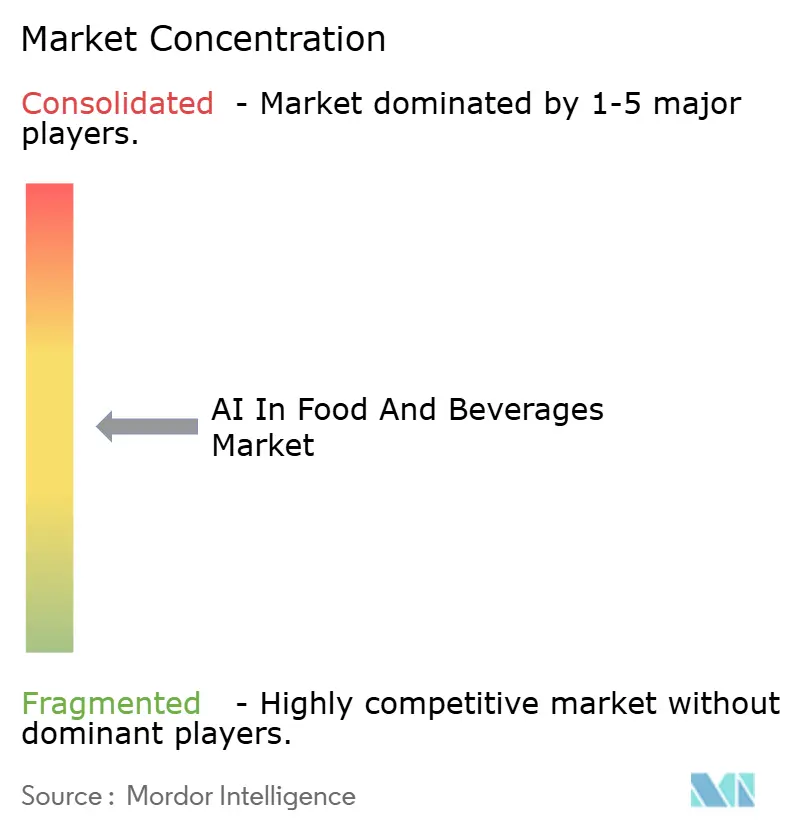
| Market Concentration | Medium |
Major Players *Disclaimer: Major Players sorted in no particular order Image © Mordor Intelligence. Reuse requires attribution under CC BY 4.0. | |
AI In Food And Beverages Market Analysis by Mordor Intelligence
The AI In Food And Beverages market size is expected to grow from USD 13.39 billion in 2025 to USD 18.34 billion in 2026 and is forecast to reach USD 88.37 billion by 2031 at 36.96% CAGR over 2026-2031.
Surging investments in computer vision, robotics, and predictive analytics help processors offset labor shortages, comply with strict safety norms, and cut waste, while large restaurant chains deploy personalization engines that lift ticket values and customer retention. Market momentum is amplified by government funding for smart-factory projects, cloud providers embedding turnkey AI modules into existing MES platforms, and global retailers tightening sustainability scorecard requirements for suppliers. Heightened competition is shifting emphasis from isolated pilots to enterprise-wide rollouts, with early adopters already reporting 8-12% overall-equipment-effectiveness gains and 10-15% inventory-spoilage cuts. Successful deployments now hinge on access to skilled process engineers who can align algorithm outputs with daily production constraints, making service partnerships a strategic imperative for manufacturers and food-service operators.
Key Report Takeaways
- By component, software solutions led with 47.35% revenue share in 2025, while services are projected to expand at a 40.8% CAGR through 2031.
- By technology, computer vision captured 41.95% of the AI in food & beverages market share in 2025; robotics and automation record the fastest growth at 41.15% CAGR to 2031.
- By application, food sorting and grading accounted for a 29.75% share of the AI in food & beverages market size in 2025, whereas predictive maintenance is advancing at a 41.05% CAGR through 2031.
- By end user, food-processing manufacturers held a 37.10% share in 2025; quick-service and cloud kitchens post the highest projected growth at 38.95% CAGR to 2031.
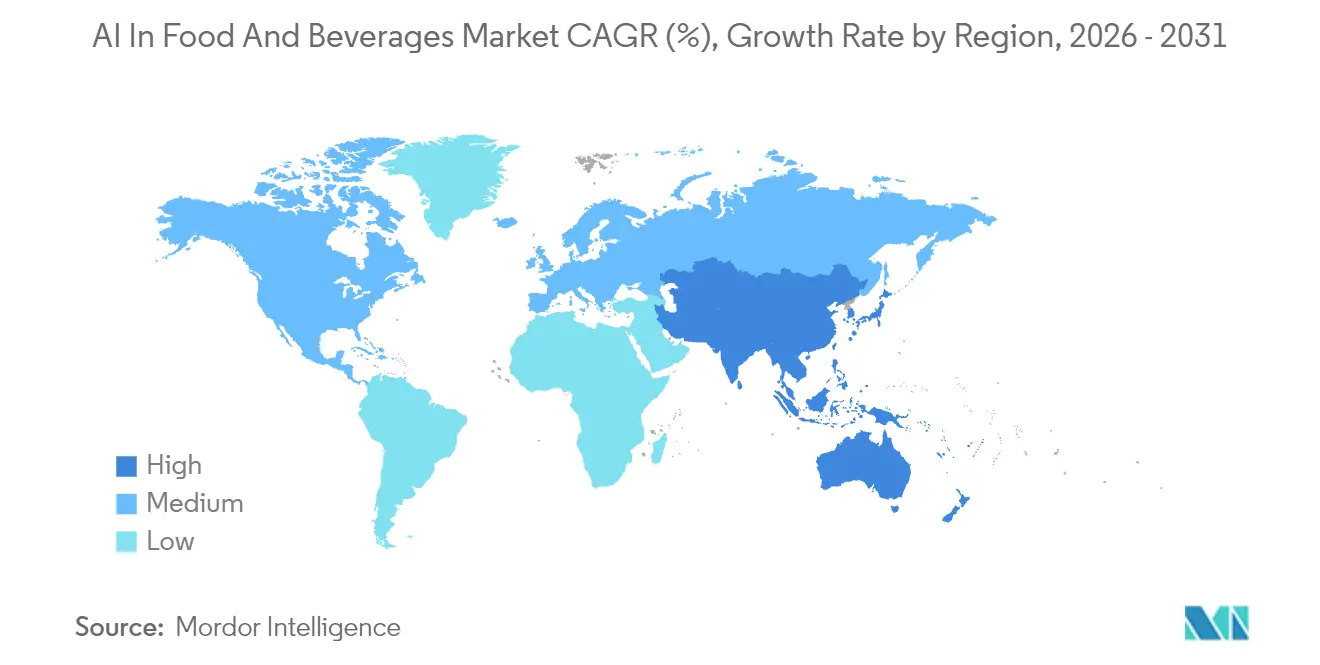
- By geography, Asia Pacific led with 33.70% revenue share in 2025 and is forecast to grow at 40.25% CAGR during 2026-2031.
Note: Market size and forecast figures in this report are generated using Mordor Intelligence’s proprietary estimation framework, updated with the latest available data and insights as of 2026.
Market Trends and Insights
Drivers Impact Analysis of AI In Food And Beverages Market*
| Driver | (~) % Impact on CAGR Forecast | Geographic Relevance | Impact Timeline |
|---|---|---|---|
| AI-powered computer-vision systems slash defect rates >25% in meat, produce and bakery lines | +8.2% | Global, with early adoption in North America & EU | Medium term (2-4 years) |
| Predictive-maintenance algorithms curb unplanned downtime and raise OEE by 8-12% | +7.5% | APAC core, spill-over to MEA | Short term (≤ 2 years) |
| Personalised menu and promo engines lift average ticket size 15-20% for QSRs and cafés | +6.8% | North America & EU, expanding to APAC | Medium term (2-4 years) |
| Gen-AI accelerates recipe reformulation cycles from months to days, boosting NPD velocity | +5.9% | Global, led by multinational F&B companies | Long term (≥ 4 years) |
| Carbon-traceable AI platforms unlock 5-10% "green-premium" pricing in export markets | +4.1% | EU regulatory markets, expanding globally | Long term (≥ 4 years) |
| End-to-end predictive analytics cut inventory spoilage 10-15%, saving ~USD 30 billion globally | +6.7% | Global, with highest impact in perishables-heavy regions | Medium term (2-4 years) |
| Source: Mordor Intelligence | |||
AI-Powered Computer-Vision Systems Slash Defect Rates More than 25% in Meat, Produce, and Bakery Lines
Real-time machine vision now detects microscopic blemishes that manual inspectors miss, lifting first-pass yield and cutting scrap. Accuracy levels exceed 95%, enabling plants to drive defect rates below 2% within half a year. Processors gain further upside by linking vision outputs to line-speed and cutting-parameter adjustments that optimize recovery. Chick-fil-A’s lemon-squeezing robots, for instance, saved 10,000 labor hours in 2024 while standardizing quality[1]. These benefits resonate most in high-throughput operations where minor quality gains translate into significant margin protection.
Predictive-Maintenance Algorithms Curb Unplanned Downtime and Raise OEE by 8-12%
AI models analyze vibration and acoustic signatures, giving maintenance teams 2-4 weeks’ lead time to plan interventions and avoiding USD 50,000 per hour losses tied to emergency stoppages. Dairy plants adopting sensor-driven digital twins report 10% capacity upticks and 65% variability reductions. As inflation raises part and labor costs, the value of avoided downtime grows, moving predictive maintenance from optional to mandatory in capital-intensive lines.
Personalised Menu and Promo Engines Lift Average Ticket Size 15-20% for QSRs and Cafes
Natural-language models parse historical orders and real-time inventory to present tailored upsell suggestions during ordering. PepsiCo’s Smart Cans pilot demonstrated the appeal of AI-guided customization. Chains rolling out these engines enjoy higher basket values and reduced menu complexity without sacrificing throughput during peaks, supporting top-line growth even as ingredient prices fluctuate.
Gen-AI Accelerates Recipe Reformulation Cycles from Months to Days, Boosting NPD Velocity
Generative algorithms simulate thousands of formulations, forecasting sensory acceptance before costly pilot trials. Coca-Cola leveraged the approach to design “Y3000 Zero Sugar,” collapsing development timelines and cutting iteration costs by 40%. The methodology particularly benefits brands targeting reduced-sugar, plant-based, or allergen-free niches, where traditional R&D processes struggle to keep pace with shifting consumer preferences.
Restraints Impact Analysis of AI In Food And Beverages Market*
| Restraint | % Impact on CAGR Forecast | Geographic Relevance | Impact Timeline |
|---|---|---|---|
| Full-stack AI roll-outs can exceed USD 5 million per plant, limiting adoption by SMEs | -4.8% | Global, with highest impact in developing markets | Short term (≤ 2 years) |
| Data-ownership and cybersecurity risks deter cloud-based deployments | -3.2% | EU & North America regulatory markets | Medium term (2-4 years) |
| Seasonal ingredient variability causes model-drift, inflating re-training costs | -2.7% | Agricultural-dependent regions globally | Long term (≥ 4 years) |
| Acute shortage of AI-savvy process engineers in F&B plants delays scaling efforts | -5.1% | Global, with severe shortages in APAC | Medium term (2-4 years) |
| Source: Mordor Intelligence | |||
Full-Stack AI Roll-Outs Can Exceed USD 5 Million Per Plant, Limiting Adoption by SMEs
High capital outlays for edge hardware, cloud licences, and systems integration restrain smaller firms, with 79% of processors delaying AI initiatives in 2025 due to cost uncertainty[2]. Modular and subscription models reduce entry hurdles, yet ROI proofs remain essential for board approval in cash-constrained settings.
Data Ownership and Cybersecurity Risks Deter Cloud-Based Deployments
Processors handling sensitive formulations and consumer data fear IP theft, ransomware, and regulatory penalties. Compliance with the EU AI Act 2024/1689 adds documentation burdens that lengthen implementation cycles. Vendors now promote zero-trust architectures and sovereign-cloud options to win cautious clients.
*Our forecasts treat driver/restraint impacts as directional, not additive. The impact forecasts reflect baseline growth, mix effects, and variable interactions.
AI In Food And Beverages Market Segment Analysis
By Component:
Implementation Services Gain Speed as Software Leads Functional DepthSoftware still anchors the AI in the food & beverages market, commanding 47.35% revenue in 2025, thanks to modular platforms that interface easily with legacy MES and PLC layers. Continuous over-the-air updates allow producers to refine algorithms without shutting lines, preserving uptime and lowering the total cost of ownership. Services, however, grow faster at 40.8% CAGR because value shifts to domain experts who can translate generic AI models into plant-specific workflows, calibrate sensors, and train staff on exception handling. Many processors now structure contracts around performance-linked fees, rewarding integrators for measurable yield or energy gains.
Ongoing skills shortages reinforce demand for third-party expertise, and major integrators bundle change-management programs with cloud subscriptions to shorten payback periods. As a result, services are expected to narrow the revenue gap with software by 2031, reflecting a broader sector view that execution quality outweighs tool selection. This convergence pushes vendors toward outcome-as-a-service deals that align incentives and open recurring revenue streams within the AI in food & beverages market.


By Technology:
Vision Systems Dominate Today, while Robotics Delivers Future ScaleComputer-vision suites captured the largest share at 41.95% because cameras and high-speed GPUs plug into existing conveyors with minimal disruption. Real-time image analytics automates defect detection, grading, and pack validation, delivering visible ROI within a single budget cycle. Conversely, robotics and automation post a 41.15% CAGR as processors confront labor scarcity and rising hygiene standards. Collaborative robots now portion dough, garnish bowls, and execute clean-in-place tasks, expanding the automation addressable market beyond palletizing and pick-and-place operations.
Integrating vision-guided arms with smart grippers supports gentle handling of fragile items such as pastries or fresh berries, broadening use cases in premium product lines. Government incentives, Japan’s USD 7.8 million culinary-robot grant among them, accelerate capex plans. Over the forecast horizon, hybrid cells that meld robotics, vision, and AI scheduling engines are expected to redefine factory layout economics across the AI in food & beverages market.
By Application:
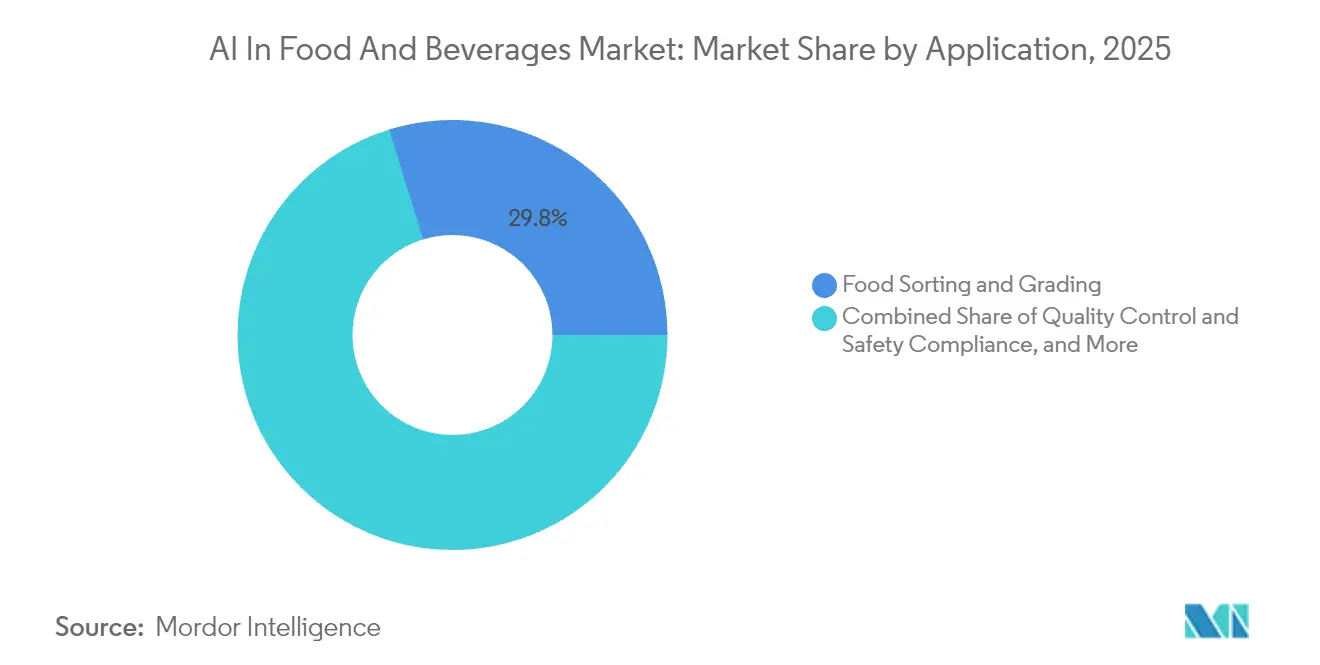
Sorting Leads Revenues, Predictive Maintenance Captures MomentumFood-sorting and grading accounted for 29.75% of 2025 spending in the AI in food & beverages market, leveraging proven capabilities to detect foreign objects, color deviations, and size inconsistencies at high line speeds. Automated ejection reduces recalls and boosts brand trust, making sorting a staple investment in protein, produce, and bakery segments. Predictive maintenance, though smaller, expands fastest at 41.05% CAGR because every unplanned hour of downtime can erase a week’s profit in thin-margin plants.
Machine-learning models ingest multivariate sensor feeds and historical work-order data to advise maintenance crews on part replacements, thereby lifting OEE by 8-12%. Cloud dashboards share insights across multi-plant networks, letting corporate engineers benchmark asset health and schedule mobile technician teams efficiently. As integrated asset-performance systems mature, predictive maintenance is projected to command a greater slice of the AI in the food & beverages market size by 2031.
By End User:
Processors Hold Scale Advantage, QSRs Lead Customer-Facing InnovationFood-processing manufacturers represented 37.10% of expenditure in 2025, driven by complex batch and continuous operations where minor efficiency gains multiply across high volumes. These firms already run extensive SCADA layers, making them natural candidates for advanced analytics that refine set-points and balance line speeds. Quick-service restaurants and cloud kitchens, however, demonstrate the strongest growth at 38.95% CAGR. They leverage recommendation engines, kitchen-display predictions, and autonomous fryers to enhance guest experience and control labor cost volatility.
Large QSR groups partner with hyperscale clouds to pilot generative voice ordering and AI-driven crew scheduling, compressing wait times and standardizing output quality across thousands of outlets. Positive early metrics encourage franchisees to adopt centralized data platforms, cementing QSRs as pivotal demand drivers within the AI in food & beverages market.
Geography Analysis
APAC AI in Food and Beverages Market
Asia Pacific leads the AI in food & beverages market with 33.70% share in 2025 and is expanding at 40.25% CAGR as governments champion smart-manufacturing roadmaps and wage inflation undercuts manual processes. China’s multibillion-dollar AI infrastructure subsidies enable domestic OEMs to offer low-cost vision modules, while India’s food-processing incentives favour startups integrating crop-to-fork data for traceability. Regional pilots show tangible impact: Taiwan’s tea processors lifted capacity 75% and halved labor through AI-enabled lines, illustrating the pragmatic uptake pace.
North America AI in Food and Beverages Market
North America maintains heavyweight status through enterprise alliances, typified by Coca-Cola’s USD 1.1 billion Microsoft agreement that equips plants with predictive quality, demand sensing, and generative marketing tools. Regulatory bodies reinforce adoption; the FDA’s Elsa platform applies machine learning to speed risk-based inspection scheduling, signaling policy support for AI in compliance workflows. Capital budgets remain disciplined, yet boardrooms prioritize proven AI modules that bolster resilience against supply shocks and wage pressure.
EMEA and South America AI in Food and Beverages Market
Europe balances ambition and caution under the EU AI Act framework, requiring rigorous transparency and human oversight. Producers view compliance as a license-to-operate cost and selectively pilot AI for carbon-footprint reporting, allergen tracking, and yield optimization. Carbon-traceable products command 5-10% premiums in northern supermarkets, motivating exporters to integrate accredited AI systems. While South America and MEA markets trail in absolute spend, infrastructure programs and knowledge-transfer partnerships are laying the groundwork for faster adoption in grains, cocoa, and protein subsectors, ensuring the AI in food & beverages market ultimately scales worldwide.
Regulatory Landscape
The regulatory environment for AI in food and beverages is being shaped more by cross-sector AI rules and existing food-safety regimes than by food-specific AI statutes. In the European Union, Regulation (EU) 2024/1689 (EU AI Act) introduces obligations that can apply to agrifood use cases, including AI systems that function as safety components in certain machinery, and it extends to non-EU providers when outputs are used in the EU. The Act also adds transparency requirements, with key provisions taking effect in August 2026. As a result, processors deploying AI-enabled automation in processing plants, or using AI-assisted decision workflows that affect safety-relevant operations, face increased documentation, risk management, and oversight expectations.
In the United States, the FDA Human Foods Program listed 2026 priority deliverables that include developing a plan to use AI-predictive models to analyze large food supply chain datasets, reflecting a regulator-led push to apply machine learning in oversight activities rather than to create separate AI rules for food manufacturers. In the United Kingdom, a UK Food Standards Agency Science Council report on AI applications in food safety and authenticity notes no immediate need for new food-specific AI regulation if human accountability remains central, reinforcing a compliance approach anchored in existing food law and governance controls. In the Middle East, policies affecting marketing and consumer communication also intersect with AI-enabled engagement tools, such as Abu Dhabi Department of Health requirements tied to nutritional grading in F&B advertising (2025).
Value Chain Analysis
The value chain for AI in food and beverages begins with data generation and capture, including sensors, cameras, PLC/SCADA signals, and ERP and POS feeds. Data engineering, labeling, and model development typically come from AI software vendors, cloud providers, and system integrators. Deployment then splits between edge inference on production lines, covering vision inspection, sorting, robotics guidance, and predictive maintenance, and cloud analytics for multi-site benchmarking, demand forecasting, and digital twins. Implementation services connect these outputs into MES, quality systems, and maintenance workflows.
Downstream, food manufacturers, beverage producers, retailers, and food-service operators operationalize AI outputs through SOP changes, line reconfiguration, and workforce training, while auditors and regulators increasingly scrutinize documentation and controls. Collaboration models show up across the chain, particularly for ingredient discovery and product development, where specialized AI platforms work alongside ingredient suppliers and flavor houses. Examples include Ingredion working with Shiru to use the Flourish AI platform for functional protein discovery (March 2026), and MANE taking an exclusive global license for Arzeda AI-designed ViaLeaf Reb M sweetener (July 2026), both indicating how AI-native discovery is moving into mainstream formulation pipelines. Enterprise operating models are also shifting toward centralized analytics and transformation hubs, including Nestle and Genpact establishing a Global Capability Center in India to use agentic AI for process transformation (June 2026). Key bottlenecks remain data quality and harmonization across plants, model robustness under seasonal ingredient variability, and real-time integration into production constraints, which increases the value of integrators and domain specialists when moving beyond pilots.
Competitive Landscape
Competition blends industrial-automation majors, vertical AI specialists, and cloud hyperscalers, fostering a dynamic battlefield where service integration often trumps proprietary algorithms. ABB, Honeywell, and Siemens embed edge AI chips into legacy PLC portfolios, promising seamless migrations for brownfield sites. Startups focus on niche pain points, e-nose freshness sensing or allergen detection, then license APIs to platform players, accelerating feature rollouts.
Strategic alliances are reshaping power balances: Coca-Cola’s long-term cloud deal secures preferential access to Microsoft’s multimodal models, compelling rival beverage groups to negotiate similar partnerships. Patent filings highlight convergence trends; Meta’s work on ultrawide-band food-consumption tracking could interface with retailer loyalty data to personalize nutrition advice, while Coca-Cola’s remote micro-ingredient storage patent signals plans for on-premises flavor customization.
Barriers to entry include domain expertise, validated training datasets, and global service footprints. Integrators able to bundle change management, cybersecurity, and regulatory documentation capture premium fees and consolidate shares. As the leading five suppliers account for roughly 45% of global revenues, the AI in food & beverages market remains moderately concentrated, leaving room for disruptors that can prove ROI in underserved applications such as fermentation monitoring or allergen-free batch scheduling.
AI In Food And Beverages Industry Leaders
-
TOMRA Sorting Solutions AS
-
Rockwell Automation Inc.
-
ABB Ltd
-
Honeywell International Inc.
-
Key Technology Inc.
- *Disclaimer: Major Players sorted in no particular order
AI In Food And Beverages Market Companies Covered in this Report
- ABB Ltd
- Honeywell International Inc.
- Rockwell Automation Inc.
- TOMRA Food (TOMRA Sorting Solutions AS)
- Key Technology Inc.
- Sesotec GmbH
- Cognex Corporation
- Keyence Corporation
- GREEFA
- Cimbria A/S
- Seebo (Augury)
- Sight Machine Inc.
- Landing AI
- ImagoAI
- Siemens AG
- Schneider Electric SE
- IBM Corporation
- Microsoft Azure
- Google Cloud Platform
- AWS (Amazon Web Services)
Market Opportunities and Future Outlook
Enterprise governance and workforce readiness remain a clear whitespace for suppliers of compliant, auditable AI stacks in food and beverages. TraceGains 2026 AI Readiness and Governance Survey results, which cite only 41% of food and beverage organizations using enterprise AI tools, point to a large installed base where AI use exists but is not standardized, creating demand for platforms that consolidate model management, access controls, validation records, and traceability of decisions across quality, maintenance, and supply-chain planning. As the EU AI Act moves from adoption to enforcement milestones, including August 2026 transparency-related requirements and earlier applicability of AI literacy obligations, vendors and service providers that package documentation workflows, human oversight design, and training alongside deployment should find stronger pull from multinational producers and exporters selling into EU markets.
Operational and sustainability-linked use cases also offer near-term expansion room where ROI can be tied to measurable plant outcomes rather than experimental pilots. Rockwell Automation and Actemium publicized an AI-driven refrigeration optimization deployment that reduced energy use by 17% at a frozen french fry producer (May 2026), reinforcing opportunity around energy management and utilities optimization in cold-chain-intensive processing. Ingredient and formulation innovation is moving from experimentation toward structured commercial pathways as well, with MANE securing rights to an AI-designed sweetener (July 2026) and Ingredion collaborating with Shiru (March 2026), supporting a pipeline for AI-assisted discovery, reformulation, and claims-aligned product development. Together, these signals align with continued demand for computer-vision inspection, predictive maintenance, and digital-twin initiatives across multi-site networks, where integration services and plant-level change management shape scalability.
Recent Industry Developments in AI In Food And Beverages Market
- July 2026: Rockwell Automation announced that Hadaf Foods Industries LLC selected the Plex Smart Manufacturing Platform to modernize and connect manufacturing operations in the UAE. The program centers on standardizing data-driven operations across production and quality workflows, supporting faster decision cycles and improved visibility. The deal reinforces the role of unified MES and analytics foundations as a prerequisite for scaling AI use cases in food manufacturing.
- May 2026: Rockwell Automation and Actemium deployed an AI-driven Real-Time Coefficient of Performance (RtCOP) application at a frozen french fry producer, reporting a 17% reduction in refrigeration energy use. The project highlights how AI is being bundled with industrial energy-management software to deliver measurable sustainability and cost outcomes. It also expands AI adoption beyond core production to utilities, a major cost lever in cold-chain-heavy processing.
- April 2024: Level Equity acquired Upshop, an AI retail-software provider serving grocery and food retail operations. The transaction strengthened Upshop's resources to expand capabilities across store operations and replenishment planning, where improved forecasting and execution reduce waste and out-of-stocks. It underscored investor interest in AI platforms that connect demand signals with downstream food availability.
AI In Food And Beverages Market Report Scope and Research Methodology
Market Definition and Coverage
This market tracks the revenue generated from using artificial intelligence tools and services to improve how food and beverage products are made, tested, packaged, moved, and sold, including software-led analytics and automation that support better decisions and execution.
Scope exclusions: It does not count general purpose IT spending that is not deployed for a food or beverage use case, or basic automation that runs without AI logic.
Segments Covered in This Report
- By Component
- Hardware
- Software
- Services
- By Technology
- Machine Learning
- Computer Vision
- Natural Language Processing
- Robotics and Automation
- By Application
- Food Sorting and Grading
- Quality Control and Safety Compliance
- Production and Packaging Optimisation
- Predictive Maintenance
- Consumer Engagement and Personalisation
- Quick-service and Cloud Kitchens
- Inventory and Supply-Chain Planning
- Other Niche Applications
- By End User
- Food Processing Manufacturers
- Beverage Manufacturers
- Hotels and Full-service Restaurants
- Quick-service and Cloud Kitchens
- Retailers and E-commerce Grocers
- Others (Catering, Institutional FandB)
- By Geography
- North America
- United States
- Canada
- Mexico
- South America
- Brazil
- Argentina
- Rest of South America
- Europe
- Germany
- France
- United Kingdom
- Italy
- Rest of Europe
- Asia-Pacific
- China
- India
- Japan
- Australia
- Rest of Asia-Pacific
- Middle East and Africa
- Middle East
- Saudi Arabia
- United Arab Emirates
- Rest of Middle East
- Africa
- South Africa
- Nigeria
- Rest of Africa
- Middle East
- North America
Data Sources, Market Sizing, and Validation
Desk Research
To set up the market boundaries and build a clean fact base, we start with public information that can be checked and repeated. Common references include government statistics and trade releases such as the USDA, Eurostat, UN Comtrade, and national food safety authorities, plus standards and guidance bodies such as Codex Alimentarius and ISO publications where relevant. We also review peer reviewed journals on applied AI and food processing, along with patent databases to understand what is moving from pilots into real deployments.
After that, the model is supported with company filings, investor presentations, earnings call transcripts, and product documentation that describes where AI is being used in the food and beverage value chain. For cross checks, we use news and financials databases alongside company financials to map addressable revenue pools and track funding and partnership activity without relying on any single disclosure. The source list above is illustrative, and other public and paid references were used to collect, validate, and clarify data points during the study.
Primary Interviews and Surveys
Primary work is used to test what we built from desk research, and then tighten assumptions that are usually not visible in public sources. We spoke with AI solution teams, food and beverage manufacturers, and operational stakeholders in quality, production, packaging, and supply chain, covering major regions so the inputs reflect different adoption patterns and compliance environments.
This input clarified how buyers in plant inspection (computer vision), predictive maintenance, and packaging operations define AI-enabled deployments versus standard automation spend.
Distribution of primary research fieldwork respondents
| Company type | Respondent position | Region |
|---|---|---|
| Top tier: 29% | CXOs: 13% | APAC: 43% |
| Mid tier: 50% | Functional/Unit leaders: 40% | EMEA: 32% |
| Smaller Players: 21% | Managers: 47% | Americas: 25% |
Market-Sizing & Forecasting
Sizing starts with a top-down build where the spend pool is reconstructed from food and beverage digitalization signals, automation investment patterns, and the share that is realistically AI enabled in defined use cases. Once that total is formed, we corroborate it with selective bottom-up approximations, such as sampling typical pricing ranges for AI software and services, mapping likely volumes of deployable sites, and then stress testing the result through channel and integration partner checks.
The model is driven by practical inputs that can be explained and revisited, including the number of production and packaging lines that can justify AI, adoption rates of computer vision based inspection, penetration of predictive maintenance in plants, growth in e-grocery and data rich retail operations, and change in labor and compliance pressure that pushes automation decisions. Where gaps exist, assumptions are only extended when they are consistent with observed rollout timelines and budget cycles, and then adjusted after primary feedback.
For forecasting, scenario analysis is used because adoption speed can swing with capital cycles, regulation, and deployment complexity. The scenarios are anchored to expert expectations on adoption curves and then linked back to measurable indicators, which helps keep the forward numbers aligned to realistic implementation capacity and spending behavior.
Data Validation & Update Cycle
Model outputs are checked against independent signals, such as reported digital and automation investment trends in food processing, visible deployment announcements, and patenting and pilot activity that indicates where scale up is happening. When a result looks off, we re-check the driver inputs, confirm unit logic, and trace the variance back to scope, pricing, or adoption assumptions before it is allowed to stand.
A multi step analyst review is followed, where key calculations are re-performed and edge cases are tested so arithmetic and logic errors do not slip through. Reports are refreshed annually, and interim updates are made when material events occur that can shift adoption or pricing. Before delivery, we perform a fresh review pass so clients receive the most current view available at that time.
Mordor Intelligence's Food and Beverages Artificial Intelligence Market Size Compared Against Other Published Estimates
Published market sizes for AI in food and beverages often differ because studies do not always count the same revenue streams, and the base year and currency timing can vary. Some publishers also lean more heavily on stated growth targets, while others tie forecasts to adoption capacity and budgets that can be validated.
The gap usually comes from what is treated as in-scope AI (for example, whether generic IT modernization is included), how fast pricing is assumed to expand with functionality, and how quickly pilots are converted into scaled deployments across plants and retail networks. Refresh cadence matters too because fast moving AI tool releases can shift assumptions on implementation time and achievable penetration.
Benchmark comparison
| Source | Market Size | Gaps in Research Methodology |
|---|---|---|
| Mordor Intelligence | USD 13.39 B (2025) | |
| Global Consultancy A | USD 11.72 B (2024) | Uses an earlier base year window and tends to aggregate food processing and packaging related AI revenue without consistently separating pilots from recurring deployment spend, which can pull the starting value down. |
| Regional Consultancy B | USD 15.36 B (2025) | Includes a broader demand pool that blends farm and upstream precision agriculture AI into the same total, which can lift the 2025 number versus a food and beverage operations focused scope. |
The table shows a noticeable spread even for nearby years, and in Mordor Intelligence's model the 2025 total is built from food and beverage operational AI use cases (such as sorting, quality control, production and packaging, maintenance, and consumer engagement) rather than folding in upstream farm level precision agriculture. With the scope kept consistent and assumptions cross checked through interviews and public signals, the resulting figure stays traceable to clear demand drivers and can be repeated when the inputs update.
Key Questions Answered in the Report
What is the current size of the AI in the food & beverages market?
The market is valued at USD 18.34 billion in 2026 and is projected to reach USD 88.37 billion by 2031, reflecting a 36.96% CAGR.
Which component segment is growing fastest?
Implementation services register the highest growth at a 40.8% CAGR because processors need domain expertise to customize AI models for plant-specific workflows.
Why is predictive maintenance gaining momentum?
Unplanned downtime costs can exceed USD 50,000 per hour; AI-driven predictive maintenance lifts overall equipment effectiveness by 8-12%, delivering quick ROI.
Which region leads adoption?
Asia Pacific holds 33.70% market share and is expanding at 40.25% CAGR, supported by government smart-factory incentives and persistent labor pressures.
How are quick-service restaurants using AI?
QSRs deploy personalization engines that raise average ticket value by 15-20% and autonomous kitchen systems that curb labor costs, driving a 38.95% CAGR in the segment.
What are the main barriers to wider AI adoption in food processing?
High upfront costs, data-ownership concerns, seasonal model drift, and a shortage of AI-literate process engineers remain the principal challenges.