
AI In Agriculture Market Size and Share
Market Overview
| Study Period | 2020 - 2031 |
|---|---|
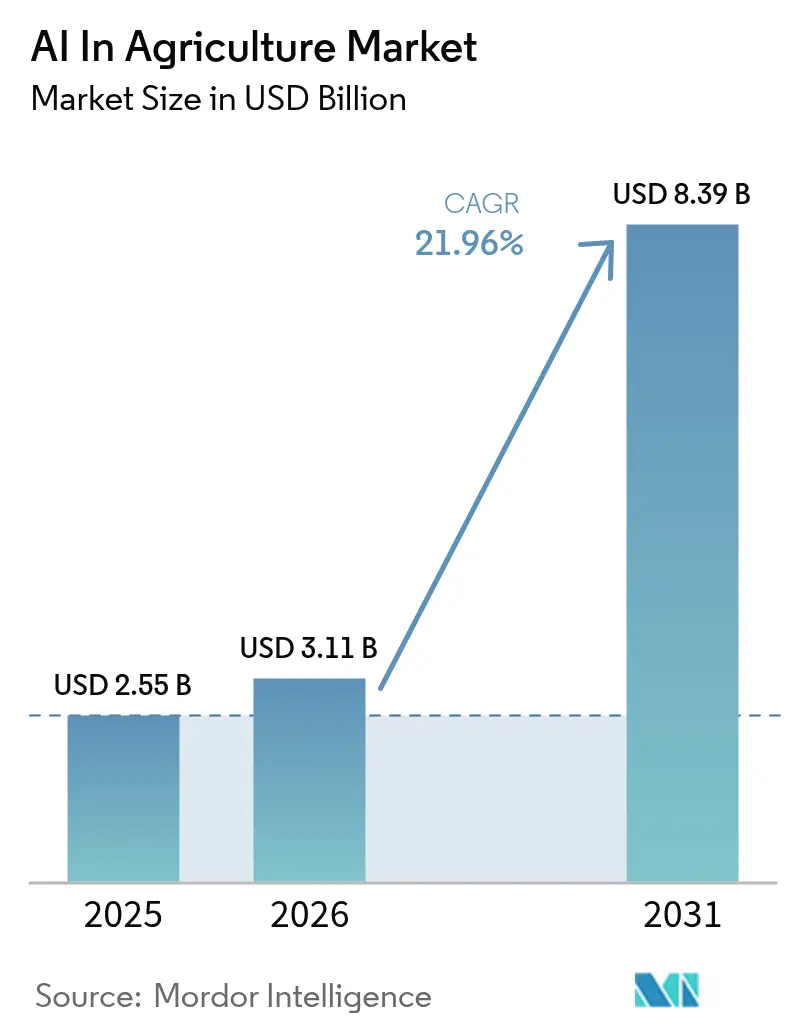
| Market Size (2026) | USD 3.11 Billion |
| Market Size (2031) | USD 8.39 Billion |
| Growth Rate (2026 - 2031) | 21.96 % |
| Fastest Growing Market | Asia Pacific |
| Largest Market | North America |
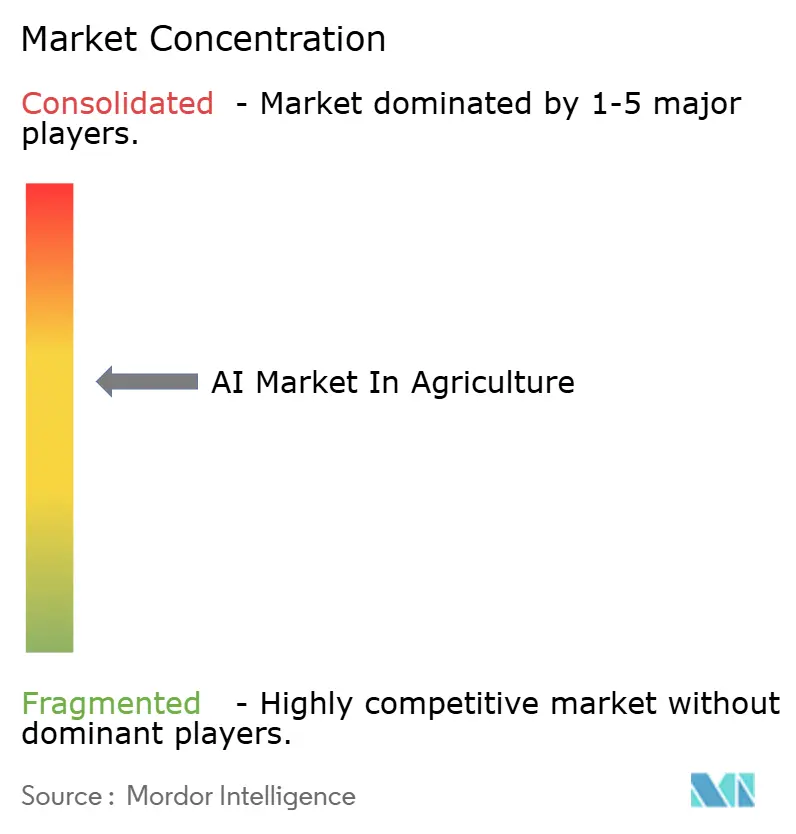
| Market Concentration | Medium |
Major Players *Disclaimer: Major Players sorted in no particular order Image © Mordor Intelligence. Reuse requires attribution under CC BY 4.0. | |
AI In Agriculture Market Analysis by Mordor Intelligence
The AI in agriculture market size is expected to grow from USD 2.43 billion in 2025 to USD 3.11 billion in 2026 and is forecast to reach USD 8.39 billion by 2031 at a 21.96% CAGR over 2026-2031. Robust cloud connectivity, falling edge-AI hardware costs, and stringent sustainability mandates are converting algorithmic decision-making from an optional pilot into a routine line item for row-crop, horticulture, and livestock operations. Growers increasingly monetize data streams by feeding sensor, drone, and satellite observations into machine-learning pipelines that prescribe variable-rate inputs, trimming fertilizer waste by double digits while raising yields. Affordable AI-as-a-Service pricing is removing capital barriers for cooperatives in Latin America and Africa, while 5G open-RAN backhaul is giving autonomous sprayers and weeding robots sub-meter positional accuracy without additional base-station hardware. Supply-side fragmentation persists, yet this very diversity of sensors, software, and service providers is widening the solution catalogue available to specialty-crop and controlled-environment operators.
Key Report Takeaways
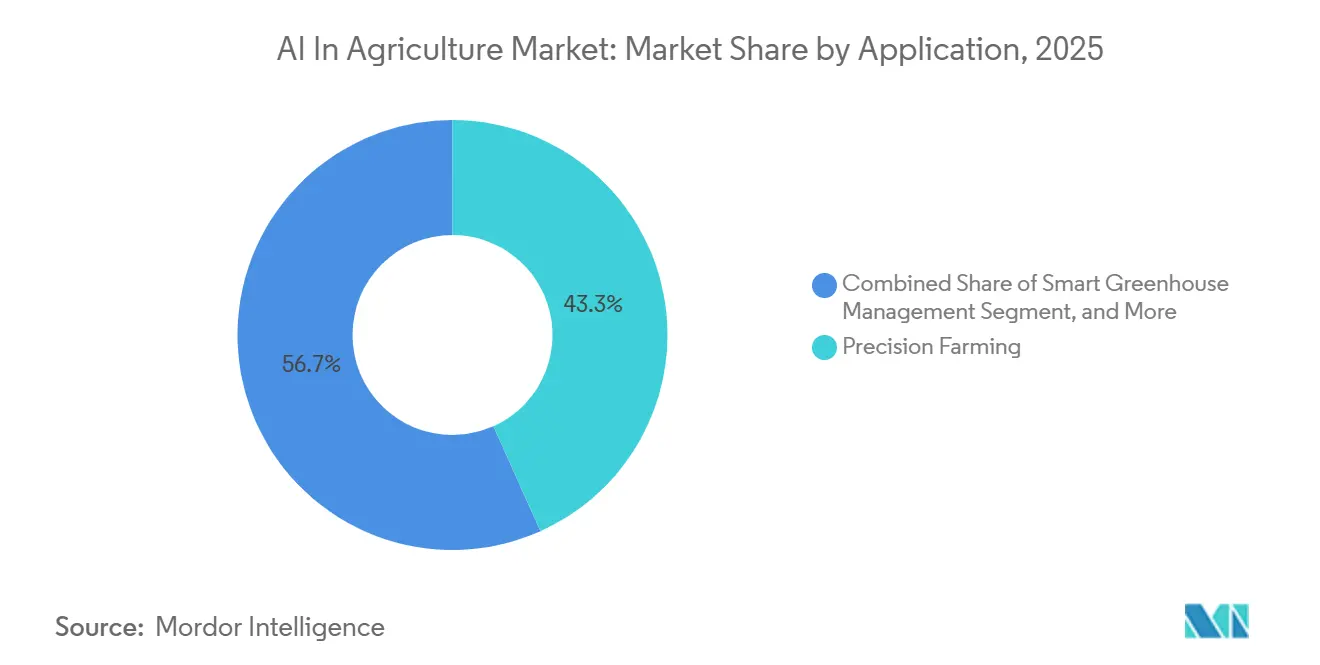
- By application, precision farming led with 43.29% revenue share in 2025; smart greenhouse management is projected to expand at a 22.47% CAGR through 2031.
- By technology, machine learning held 48.19% of 2025 spending, whereas computer vision is forecast to advance at a 22.68% CAGR between 2026-2031.
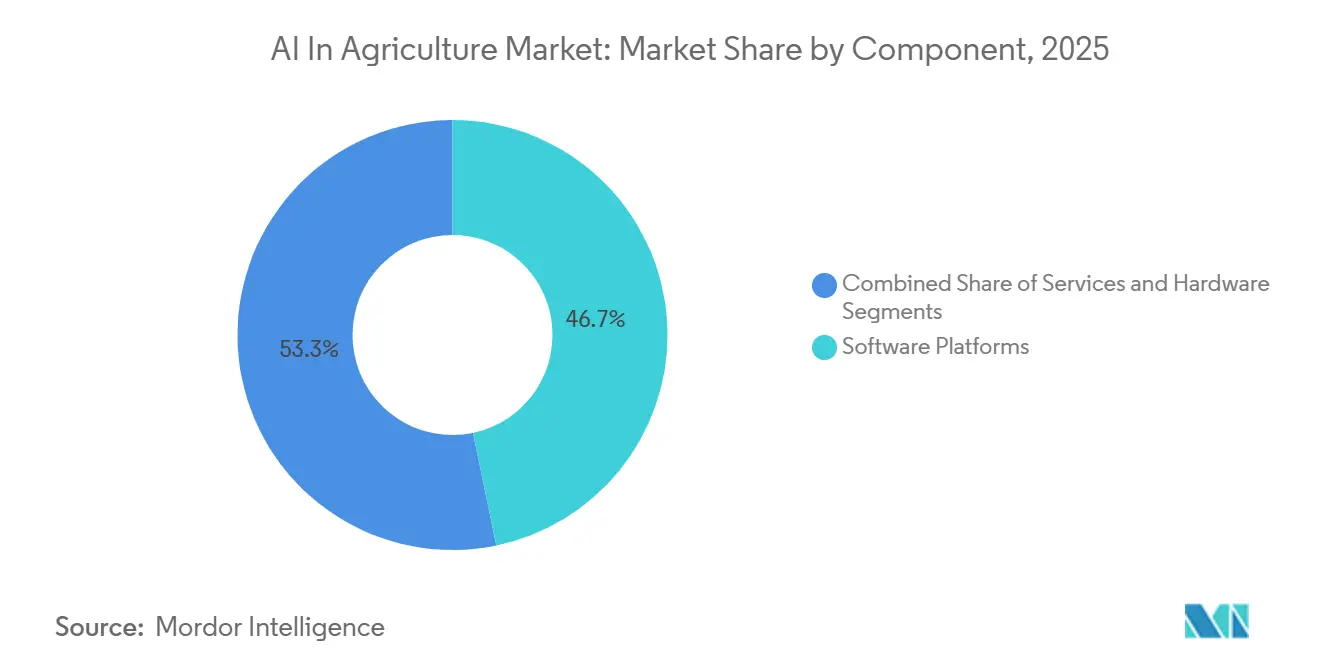
- By component, software platforms accounted for 46.73% revenue share in 2025; services are poised for the fastest growth, rising at a 22.91% CAGR to 2031.
- By deployment mode, cloud deployments captured 59.68% share in 2025, while hybrid architectures are expected to grow at a 22.96% CAGR over 2026-2031.
- By geography, North America represented 38.91% of 2025 sales, but Asia-Pacific is projected to record the highest regional CAGR at 22.98% through 2031.
Note: Market size and forecast figures in this report are generated using Mordor Intelligence’s proprietary estimation framework, updated with the latest available data and insights as of 2026.
Market Trends and Insights
Drivers Impact Analysis of AI In Agriculture Market*
| Driver | (~) % Impact on CAGR Forecast | Geographic Relevance | Impact Timeline |
|---|---|---|---|
| Rapid Adoption of Precision Agriculture Platforms | +4.20% | Global, with early concentration in North America and Europe | Medium term (2-4 years) |
| Expansion of High-Resolution Drone and Satellite Imagery Services | +3.80% | Global, accelerating in Asia-Pacific and South America | Medium term (2-4 years) |
| Government Digital-Farming Subsidies and Mandates | +3.50% | North America, Europe, China, India | Short term (≤ 2 years) |
| Affordable Cloud-Based AI-as-a-Service Offerings | +3.10% | Global, with highest uptake in Asia-Pacific and Africa | Short term (≤ 2 years) |
| On-Farm GenAI Copilots Reducing Agronomist Field Visits | +2.90% | North America, Europe, Australia | Medium term (2-4 years) |
| 5G Open-RAN Sub-Meter Positioning for Autonomous Robots | +2.70% | North America, Europe, China, Japan | Long term (≥ 4 years) |
| Source: Mordor Intelligence | |||
Rapid Adoption of Precision Agriculture Platforms
Deere and Company embedded machine-learning algorithms into its Operations Center in 2025, allowing the platform to ingest multi-year yield maps and soil conductivity readings, then automatically generate seeding prescriptions that trimmed seed outlays by 8-12% for early adopters.[1] Trimble followed in early 2026 by layering generative-AI report-writing tools onto its Ag Software suite, letting farm managers brief financiers without manually compiling dashboards.[2] Carbon-accounting modules are now standard add-ons because protocols such as Verra VM0042 require plot-level quantification of sequestration before issuing credits.[3] As growers trade verified carbon credits, they reinvest proceeds into additional sensors, reinforcing data network effects. The result is a flywheel in which platform usage deepens each season, making switching increasingly costly.
Expansion of High-Resolution Drone and Satellite Imagery Services
PrecisionHawk launched a 2025 service tier that fuses drone imagery with Sentinel-1 synthetic-aperture radar, providing all-weather soil-moisture and biomass maps.[4] Aerobotics deployed computer-vision models in 2026 to count individual citrus fruit, enabling packers to lock forward contracts six weeks earlier than before. Planet Labs’ SuperDove constellation now revisits every field daily at 3-meter resolution, giving agronomists near-real-time feedback for double-cropping systems. Such temporal density compresses decision cycles and minimizes yield penalties caused by timing errors.
Government Digital-Farming Subsidies and Mandates
The United States Department of Agriculture disbursed USD 3.1 billion under the Climate-Smart Commodities initiative in 2025, directing 40% of funds toward AI-enabled nutrient management for underserved producers. Europe’s Common Agricultural Policy requires that at least 35% of rural-development budgets finance precision-farming investments, accelerating sensor uptake across France and Germany. China’s Ministry of Agriculture committed to 200 smart-farming zones by 2027, each outfitted with IoT sensors and edge-AI gateways. India’s Kisan Suvidha app delivers AI-generated pest and irrigation advisories to 50 million growers, dramatically widening the advisory footprint. In effect, compliance is converting AI from a discretionary spend into a ticket-to-play.
Affordable Cloud-Based AI-as-a-Service Offerings
Microsoft Azure Data Manager for Agriculture prices pre-trained yield-prediction models at under USD 0.10 per hectare per season, a level workable for smallholder cooperatives. IBM integrated large-language models into its Watson Decision Platform in 2025, translating research papers into plain-language, plot-specific guidance. AWS SageMaker Geospatial bundles satellite-imagery preprocessing with model-training pipelines, cutting time-to-insight from weeks to hours for agribusinesses. Consumption-based billing eliminates the need for capex on GPU clusters, a decisive advantage in regions where annual farm income is below USD 5,000.
Restraints Impact Analysis of AI In Agriculture Market*
| Restraint | (~) % Impact on CAGR Forecast | Geographic Relevance | Impact Timeline |
|---|---|---|---|
| Fragmented Agronomic Data Standards | -2.10% | Global, most acute in Asia-Pacific and Africa | Medium term (2-4 years) |
| High Upfront Cost of Sensors and Robotics for Smallholders | -1.90% | Asia-Pacific, Africa, South America | Short term (≤ 2 years) |
| Limited AI-Ready Agronomic Datasets and Privacy Hurdles | -1.60% | Global, with regulatory complexity highest in Europe | Medium term (2-4 years) |
| Slow Soil-Carbon Credit Verification Cycles | -1.30% | North America, Europe, Australia | Long term (≥ 4 years) |
| Source: Mordor Intelligence | |||
Fragmented Agronomic Data Standards
Only 30% of farm-management software vendors had adopted AgGateway’s ADAPT data-exchange framework by 2025, forcing growers to reconcile incompatible file formats when switching suppliers. Soil taxonomies diverge; the USDA recognizes 12 soil orders, while the World Reference Base lists 32, confounding model portability. Weather-station protocols and pest nomenclatures vary, degrading forecast accuracy when datasets are pooled internationally. Vendors must build and maintain regional models, inflating development costs and delaying feature launches.
High Upfront Cost of Sensors and Robotics for Smallholders
A basic sensor suite costs USD 800-1,200 per field, and an autonomous weeding robot exceeds USD 30,000, figures many two-hectare farms in India and Sub-Saharan Africa cannot finance. Commercial banks view AI hardware as high-risk collateral, and micro-finance institutions rarely underwrite technology leases. CropX offers a sensor-as-a-service contract at USD 18-25 per hectare per season, yet adoption among smallholders was below 5% in 2025. The resulting digital divide slows the data-network effects needed to refine localized models.
*Our forecasts treat driver/restraint impacts as directional, not additive. The impact forecasts reflect baseline growth, mix effects, and variable interactions.
AI In Agriculture Market Segment Analysis
By Application:
Smart Greenhouses Outpace Row-Crop FieldsPrecision farming held the largest AI in agriculture market share at 43.29% in 2025, reflecting widespread variable-rate equipment on corn and soybean acres. Smart greenhouse management, however, is projected to lead application growth, expanding at 22.47% through 2031. Intelligent Growth Solutions’ generative-AI copilot fine-tunes CO₂ levels and LED spectra every few minutes, enabling vertical farms to cut energy use by 18% without yield loss. Livestock monitoring is gaining velocity as computer-vision systems flag lameness and calving risks days in advance, reducing vet costs and mortality. Drone analytics maintains a mid-teens position but can rise once regulators enable beyond-visual-line-of-sight flights.
Dense greenhouse datasets sensor readings every five minutes across dozens of variables accelerate model iteration, whereas open-field crops produce sparser data, slowing algorithm refinement. Certifications such as GlobalGAP are beginning to require AI-enabled traceability, nudging post-harvest optimization platforms into mainstream budgets. As a result, the AI in agriculture market size for controlled-environment applications is on track to close part of the gap with mainstream row crops by 2031.

By Technology:
Camera-Centric Growth SurgesMachine learning commanded 48.19% of 2025 spending, anchoring the broader AI in agriculture market. Computer vision, though smaller, is forecast to expand at 22.68% over 2026-2031, outpacing other technologies as drone fleets and edge processors proliferate. Deere’s See and Spray system uses convolutional networks to differentiate crops from weeds at 20 frames per second, cutting herbicide use by up to 90%. Taranis captures sub-millimeter imagery to spot early fungal lesions, enabling fungicide precision that lowers chemical bills by 30-40%.
Edge-inference chips such as NVIDIA Jetson Orin and Google Coral now retail below USD 200, allowing real-time processing on sprayers without cloud latency. European AI-Act proposals that rate some agricultural systems as “limited risk” could tilt demand toward interpretable algorithms, adding a regional flavour to global technology splits. In numerical terms, the computer-vision segment’s share of AI in agriculture market size is projected to climb steadily, even as machine learning retains core workload dominance.
By Component:
Services Bridge the Skills GapSoftware platforms captured the highest AI in agriculture market share among components at 46.73% in 2025, led by subscription bundles from Bayer Climate FieldView and Trimble. Services consulting, integration, and support are projected to grow fastest, registering a 22.91% CAGR to 2031, as growers struggle to harmonize legacy SCADA assets with cloud-native stacks. CNH Industrial’s precision team reported that professional-services revenue rose 35% year-over-year in 2025 as customers demanded custom API bridges between Slingshot and weather-data feeds.
Hardware growth remains steady but constrained by long replacement cycles for tractors and combines. Vendors are embedding intelligence at the edge to reduce integration pain; Topcon’s 2026 tractor guidance fuses GPS and computer vision on board, sustaining sub-2-centimeter accuracy without cellular links. Over time, turnkey hardware may slow services revenue, yet for now, integrators capture value as farms balance agronomy and data engineering skill sets.
By Deployment Mode:
Hybrid Architectures Gain FavorCloud deployments dominated with 59.68% share in 2025, reflecting hyperscale’s’ cost advantage. Hybrid modes are forecast to grow at 22.96% through 2031 because growers want real-time latency without forfeiting data sovereignty. Prospera runs pest-detection models on edge gateways and uploads only anomalies, slashing bandwidth by 80%. Gamaya processes hyperspectral data in situ on drones, sending compressed insights to dashboards, ensuring growers keep raw imagery in-house.
Rural 5G pilots in Germany and Japan demonstrated sub-10 millisecond round-trip times, adequate for autonomous path planning. This connectivity enables robots to offload heavy computation to nearby edge servers rather than distant clouds. Consequently, the AI in the agriculture market size attributed to hybrid deployments is primed for double-digit expansion, while pure on-premises installations remain niche.
Geography Analysis
North America AI in Agriculture Market
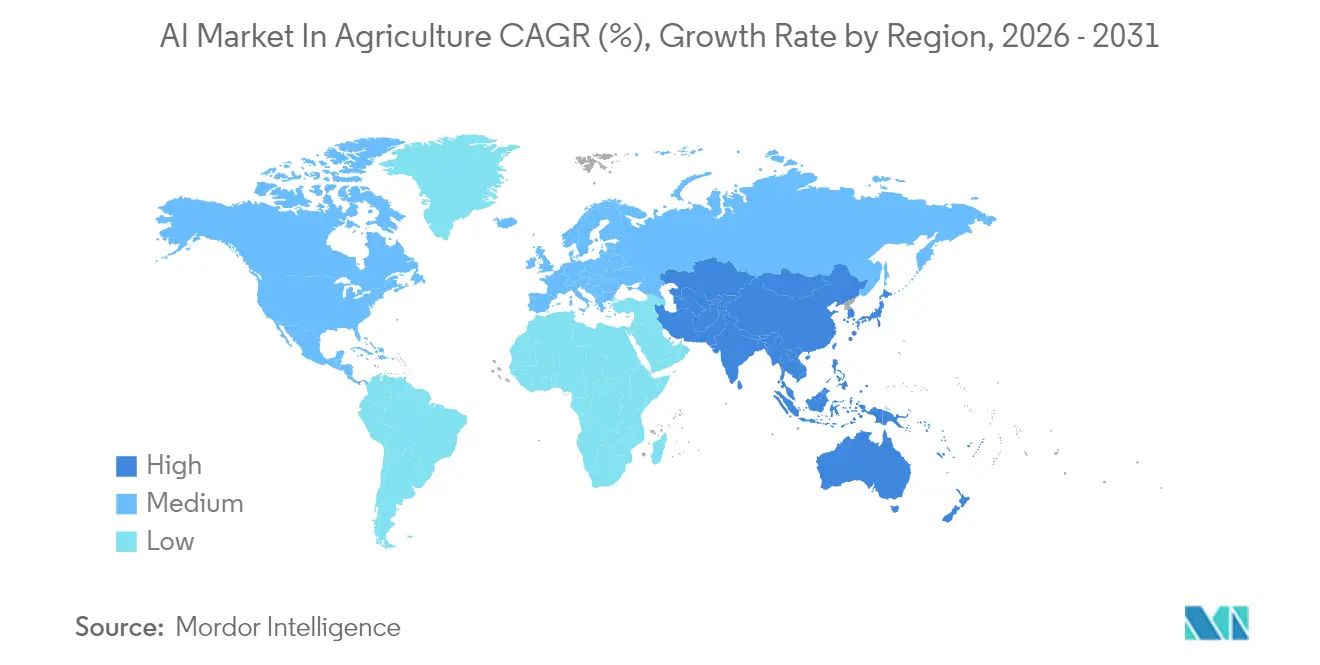
North America commanded 38.91% of 2025 spending thanks to high penetration of GPS-guided machinery, broadband coverage in rural counties, and climate-smart subsidies. USDA’s Conservation Stewardship revisions reimburse up to 75% of AI sensor and software costs when nutrient plans are machine-verified. Canada’s Agricultural Clean Technology Program disbursed CAD 50 million (USD 37 million) in 2025 for precision-farming gear. Mexico’s avocado exporters now integrate AI traceability to meet United States import rules. Labor limits still slow fully autonomous robots pending regulatory clearance.
APAC AI in Agriculture Market
Asia-Pacific is projected to grow fastest at a 22.98% CAGR through 2031. China’s 200 smart-farm zones mandate local AI stack deployment, anchoring domestic cloud partnerships. India’s Kisan Suvidha serves 50 million users with satellite-based advisories. Japan targets 100,000 hectares under autonomous tractors by 2027 to offset rural aging. Australia leverages AI evapotranspiration models to ration Murray-Darling water. Regulatory divergence from China’s data-localization rules to India’s consent-based regime forces vendors to regionalize data flows, yet demand outstrips these frictions.
EMEA and South America AI in Agriculture Market
Europe, South America, the Middle East, and Africa each held single-digit to low-teens slices in 2025. The EU earmarks over one-third of rural-development funds for digital farming, spurring sensor rollouts across Germany and Poland. Brazil’s Agro 4.0 tax incentives catalyse AI uptake on soybean estates. Saudi Arabia’s National Center for Agriculture Technology backs AI-optimized vertical farms to cut import dependency. South Africa’s citrus packers deploy computer-vision grading to meet EU standards, while Nigeria pilots satellite crop monitoring for rice in the Niger Delta. Collectively, these initiatives expand the global AI in agriculture market, even where infrastructure gaps persist.
Regulatory Landscape
Regulation is tightening around AI-enabled farm machinery, advisory tools, and farm data governance, with the EU Artificial Intelligence Act the most consequential near-term inflection point. Regulation (EU) 2024/1689 entered into force on 1 August 2024 and becomes broadly applicable from 2 August 2026, introducing obligations around transparency, risk management, and documentation that extend into agrifood decision-support and autonomous operations. For vendors selling AI as a safety component of agricultural machinery under EU type-approval regimes, notably Regulation (EU) 167/2013, the Act adds compliance steps that can affect how autonomy and vision-based control features are certified and maintained over the product life cycle.
In the United States, federal oversight is converging on formal governance and standards-setting for agricultural AI. USDA has published an FY 2025-2026 AI strategy and is building compliance mechanisms, while a May 2026 USDA Office of Inspector General review pointed to gaps in meeting internal deadlines for updating agency-wide AI policies, including generative AI guidance aligned to federal direction. On standards, proposed legislation (S.4627, Artificial Intelligence Agriculture Advisor Act) directs USDA to collaborate with NIST to develop national AI standards for agriculture, which could shape interoperability expectations and auditability requirements for vendors serving programs that subsidize digital-farming adoption.
Competitive Landscape
The AI in agriculture market remains moderately fragmented: the top five vendors Deere and Company, Trimble, Bayer Crop Science, Microsoft, and IBM hold under 30% combined share. Equipment makers leverage installed bases to upsell software; Deere connected 500,000 machines to its Operations Center by 2025, creating a proprietary data moat. Trimble integrates over 200 third-party devices, positioning itself as a neutral platform. Cloud hyperscale’s focus on horizontal infrastructure, teaming with agronomic specialists for vertical depth.
Startups such as Prospera, Taranis, and CropX undercut incumbents by 30-50% and specialize in crop-specific analytics, appealing to growers wary of equipment lock-in. Syngenta’s 2024 acquisition of Cropio illustrates vertical bundling of seeds, chemicals, and data services. Patent activity surged, with over 800 United States agricultural-AI patents issued in 2024-2025, many in weed-detection and yield-prediction fields. Edge-AI chipmakers Hailo and Blaize enable battery-powered sensors to run computer vision locally, opening underserved geographies where broadband is scarce.
Standard-setting is now a competitive lever; vendors active in AgGateway’s ADAPT group influence interoperability norms. As value-chain roles blur, the AI in agriculture market offers white-space in livestock biometrics, post-harvest quality prediction, and regenerative-agriculture verification, none yet dominated by a single vendor.
AI In Agriculture Industry Leaders
-
Microsoft Corporation
-
IBM Corporation
-
Granular Inc.
-
aWhere Inc.
-
Prospera Technologies Ltd.
- *Disclaimer: Major Players sorted in no particular order
AI In Agriculture Market Companies Covered in this Report
- Microsoft Corporation
- IBM Corporation
- Deere and Company
- Trimble Inc.
- Bayer Crop Science – Climate FieldView
- Granular Inc.
- Prospera Technologies Ltd.
- Gamaya SA
- aWhere Inc.
- CropX Technologies
- Taranis
- Raven Industries
- PrecisionHawk Inc.
- AgEagle Aerial Systems
- Aerobotics
- Syngenta Group
- Topcon Agriculture
- Tule Technologies Inc.
- Intelligent Growth Solutions (IGS)
- Blue River Technology
Market Opportunities and Future Outlook
Objective validation and trusted performance data are becoming clearer commercialization pathways for AI products sold to growers, cooperatives, and input suppliers. In April 2026, USDA launched the National Proving Grounds Network (NPG-AgTech) to evaluate emerging digital and AI-driven technologies across row crops, specialty crops, and livestock, which provides a route for vendors to move beyond pilots into procurement, financing, and insurance workflows using third-party evidence. The initiative also addresses a core market need to shorten proof cycles for field-scale outcomes, including input reduction, timing optimization, and agronomic risk reduction, and it can lift demand for integration services that connect platforms, sensor stacks, and advisory outputs into documented farm operating processes.
Funding activity further suggests a practical whitespace around physical AI deployments and measurable, field-ready data layers, rather than stand-alone analytics. In July 2026, Sabanto raised an oversubscribed Series B led by Leaps by Bayer to scale autonomous retrofit kits for row-crop tractors, reinforcing retrofit adoption as a lower-disruption alternative to full fleet replacement. In the same month, Stenon raised EUR 18 million to scale real-time nitrogen and soil data management and expand commercially in Brazil, Central Asia, and Europe, pointing to demand for higher-frequency soil intelligence that feeds variable-rate decisions and compliance reporting. Controlled-environment and robotics-led production continues to attract capital as well, evidenced by Hippo Harvests' USD 30 million Series C (July 2026) tied to facility expansion and next-generation robotic growing systems, which supports broader use of AI for climate, labor, and resource optimization in greenhouse and indoor farming.
Recent Industry Developments in AI In Agriculture Market
- July 2026: IBM worked with the grower-driven data cooperative GiSC and Main Street Data to roll out IoT and AI-based solutions aimed at improving yield outcomes through better use of farm data. The effort broadens IBM-aligned agriculture solution stacks around data integration and analytics, supporting more standardized, cross-farm deployment models for decision support.
- June 2026: Corteva Agrisciences Granular introduced a Fungicide Timing Solution for the 2026 season that uses AI-driven analysis within Granular Insights to guide when to spray. By targeting timing precision, the release positions AI as a direct lever on crop protection ROI and tightens the link between digital recommendations and input spend.
- August 2024: Microsoft expanded Azure Data Manager for Agriculture with generative AI and Copilot templates designed to help farmers translate data into decisions. The update lowers usability barriers for non-technical users and supports wider adoption of cloud-based agriculture data platforms that can plug into broader AI-as-a-service workflows.
AI In Agriculture Market Report Scope and Research Methodology
Market Definition and Coverage
This market covers spending on AI-driven solutions used in agriculture to support farm decisions and automate field and livestock activities. It includes software, services, and enabling hardware when that hardware is sold as part of an AI solution.
Scope exclusions: Excludes generic farm machinery and basic sensors that do not have an AI layer, and it excludes manual advisory work that is not delivered through AI-enabled tools.
Segments Covered in This Report
- By Application
- Precision Farming
- Livestock Monitoring
- Drone Analytics
- Smart Greenhouse Management
- Supply-Chain and Post-Harvest Optimization
- By Technology
- Machine Learning
- Computer Vision
- Predictive Analytics
- Natural-Language Processing (NLP)
- By Component
- Hardware (Sensors, Drones, Robots)
- Software Platforms
- Services (Consulting, Integration, Support)
- By Deployment Mode
- Cloud
- On-Premise
- Hybrid
- By Geography
- North America
- United States
- Canada
- Mexico
- South America
- Brazil
- Argentina
- Rest of South America
- Europe
- Germany
- France
- United Kingdom
- Italy
- Rest of Europe
- Asia-Pacific
- China
- India
- Japan
- Australia
- Rest of Asia-Pacific
- Middle East
- Saudi Arabia
- United Arab Emirates
- Rest of Middle East
- Africa
- South Africa
- Nigeria
- Rest of Africa
- North America
Data Sources, Market Sizing, and Validation
Desk Research
Desk work started with building a clean demand context for farming activity and digital adoption, then mapping where AI is being applied across crops and livestock. We referred to public sources such as USDA publications, FAOSTAT datasets, World Bank indicators, and OECD agriculture statistics to understand acreage, yields, farm economics, and regional crop patterns. For technology direction, we reviewed patent databases, peer-reviewed papers on computer vision and predictive models in agriculture, and notes from relevant regulator and standards bodies where applicable.
To connect this context to money flows, we also reviewed company filings, investor presentations, press releases, and association websites that describe solution rollouts, pricing logic, and partner programs. Where it helped, we used paid subscriptions for company financials and intelligence, news and financials, and patent lookups to cross-check timelines and product positioning. The sources listed above are illustrative, and many other public and paid references were also used to fill gaps and validate assumptions.
Primary Interviews and Surveys
Primary inputs were gathered through expert interviews and structured surveys with solution providers, system integrators, agronomy advisors, and large farm or agribusiness users who buy or deploy AI tools. We balanced coverage across major regions so that adoption drivers, pricing, and deployment patterns could be checked consistently, and then those learnings were fed into the market model assumptions.
Distribution of primary research fieldwork respondents
| Company type | Respondent position | Region |
|---|---|---|
| Top tier: 30% | CXOs: 17% | APAC: 45% |
| Mid tier: 48% | Functional/Unit leaders: 41% | EMEA: 33% |
| Smaller Players: 22% | Managers: 42% | Americas: 22% |
Market-Sizing & Forecasting
Sizing begins with a top-down build where the addressable farm demand pool is reconstructed using adoption signals and use-case penetration by region, then applying typical annual spending levels for AI-enabled tools. Key inputs include cultivated area and crop mix by region, livestock headcount trends, the share of farms using digital platforms, typical subscription and service pricing, and the pace of cloud deployment in agricultural workflows. When the main clause is reached, the market value is derived by combining penetration, usage intensity, and price, then reviewed against supply-side reality.
Results are also corroborated with selective bottom-up approximations, such as sampled vendor revenue splits, channel checks with integrators, and ASP times volume checks for drones and imaging or edge devices where AI is bundled. If a segment has limited public revenue disclosure, we fill gaps using validated pricing ranges and deployment counts gathered from interviews, then scale conservatively by region. Forecasts were produced using scenario analysis tied to a small set of drivers, including farm labor availability, input cost pressure, climate variability impacts, and expected AI model performance improvements that influence renewal and expansion behavior.
Data Validation & Update Cycle
Outputs are validated through triangulation across independent signals, including adoption indicators, budget trends for farm technology, and supplier pipeline commentary, and then variances are investigated. When a region or application line shows an unusual jump, we recheck the assumptions and trigger follow-up calls to confirm whether the shift is real or a modeling artifact.
A multi-step review is followed before sign-off, where another analyst challenges unit economics, penetration rates, and currency conversions, then reconciles the model to the final narrative. Reports are refreshed annually, with interim updates when there are material events such as policy changes, large funding cycles, or major product launches. Before delivery, a fresh pass is completed so clients receive the latest updated view.
Mordor Intelligence's Agriculture AI Market Size Compared Against Other Published Estimates
Published market sizes for AI in agriculture can look far apart because groups pick different boundaries for what counts as AI, and they also vary on whether hardware, services, and adjacent farm software are included. Timing differences matter as well, since base years, exchange rate choices, and whether spending is treated as one-time implementation versus recurring revenue can shift the result.
The table shows a band of values for some sources in the mid-2020s, and a wider spread for others. In Mordor Intelligence's model, the value includes AI software platforms and related services, with enabling hardware counted only when it is sold as part of an AI solution bundle rather than as standalone farm equipment.
Benchmark comparison
| Source | Market Size | Gaps in Research Methodology |
|---|---|---|
| Mordor Intelligence | USD 2.43 B (2025) | |
| Industry Publisher A | USD 2.20 B (2024) | Uses a different base year and may emphasize packaged software revenue, which can undercount implementation and ongoing service work that is common in farm deployments. |
| Industry Publisher B | USD 2.80 B (2025) | Applies a higher growth case early in the forecast window and can pull in adjacent digital agriculture spending that is not strictly AI-led, which lifts the near-term total. |
In practice, the spread is mostly explained by what is counted as AI-enabled value versus broader digital tools, and how recurring subscriptions are separated from one-time deployments. By anchoring the model to adoption and spending drivers that can be checked by region and use case, the estimate stays traceable to clear assumptions that can be repeated and updated each year.
Key Questions Answered in the Report
How fast is spending on AI tools expected to grow in farming between 2026 and 2031?
Overall expenditure is projected to rise at a 21.96% CAGR, lifting the AI in agriculture market from USD 3.11 billion in 2026 to USD 8.39 billion by 2031.
Which application is gaining ground quickest?
Smart greenhouse management shows the fastest trajectory, advancing at a 22.47% CAGR as operators automate climate, lighting, and nutrient regimes.
What region offers the strongest future growth prospects?
Asia-Pacific is forecast to register the highest regional CAGR at 22.98% through 2031, powered by large-scale programs in China and India.
Why are services revenue growing faster than software sales?
Farms need integrators to mesh legacy tractors, sensor networks, and cloud platforms, so consulting and support revenue is slated to expand at 22.91% annually.
How concentrated is vendor power today?
The five largest suppliers hold less than 30% of global sales, leaving the competitive landscape moderately fragmented and open to innovators.
Are hybrid deployments overtaking cloud-only models?
Hybrid architectures that mix edge processing with cloud training are set to grow at 22.96% annually, gradually eroding the dominance of pure-cloud setups.