
Armored Vehicle Upgrade and Retrofit Market Size and Share
Market Overview
| Study Period | 2019 - 2031 |
|---|---|
| Market Size (2026) | USD 8.65 Billion |
| Market Size (2031) | USD 13.63 Billion |
| Growth Rate (2026 - 2031) | 9.51 % |
| Fastest Growing Market | North America |
| Largest Market | Asia Pacific |
| Market Concentration | Medium |
Major Players *Disclaimer: Major Players sorted in no particular order Image © Mordor Intelligence. Reuse requires attribution under CC BY 4.0. | |
Armored Vehicle Upgrade and Retrofit Market Analysis by Mordor Intelligence
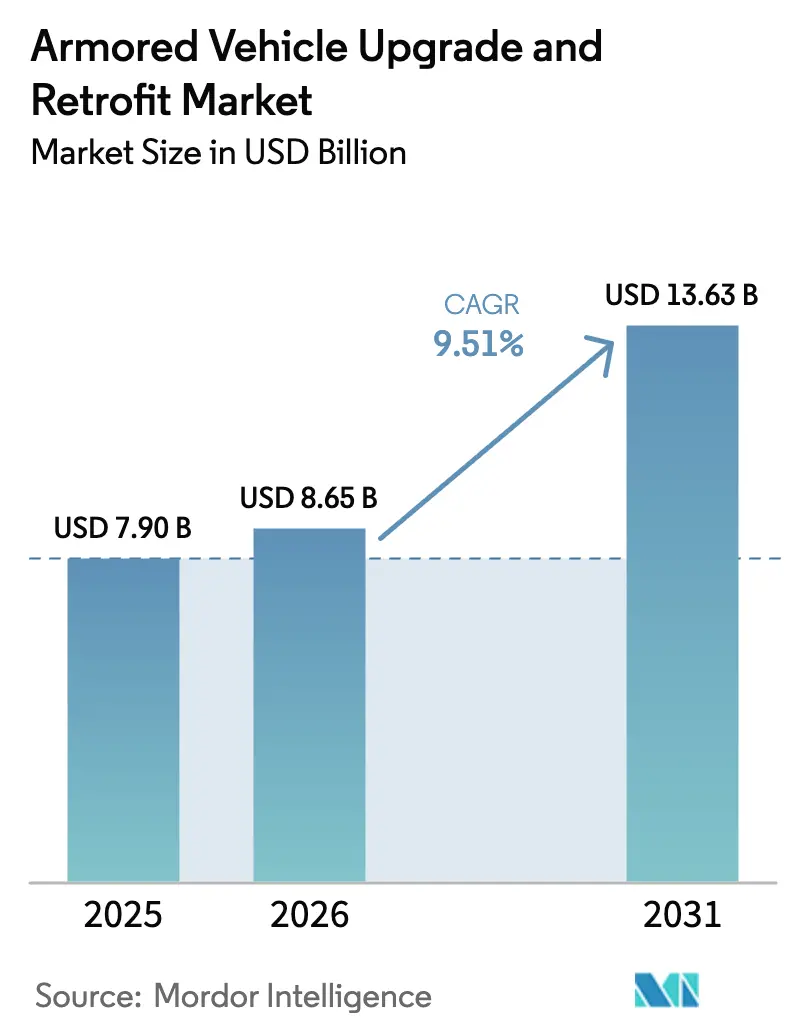
The armored vehicle upgrade and retrofit market size is expected to grow from USD 7.90 billion in 2025 to USD 8.65 billion in 2026 and is forecasted to reach USD 13.63 billion by 2031 at a 9.51% CAGR over 2026-2031. Modernization budgets favor life-extension programs that deliver 70-80% of new-platform capability at 30-40% of the acquisition cost, as illustrated by the US decision to refresh 504 Abrams tanks rather than accelerate a clean-sheet design. NATO members alone earmarked EUR 12 billion (USD 13.96 billion) for armor upgrades in fiscal 2025, a sign that geopolitical flashpoints are compressing decision cycles. Active-protection systems (APS), hybrid-electric powertrains, and open-systems electronics now dominate specifications, while Tier-2 integrators use modular kits to erode incumbent market share. Supply-chain risks around rare-earth magnets and cyber vulnerabilities in over-the-air software updates remain the principal headwinds for the armored vehicle upgrade and retrofit market.
Key Report Takeaways
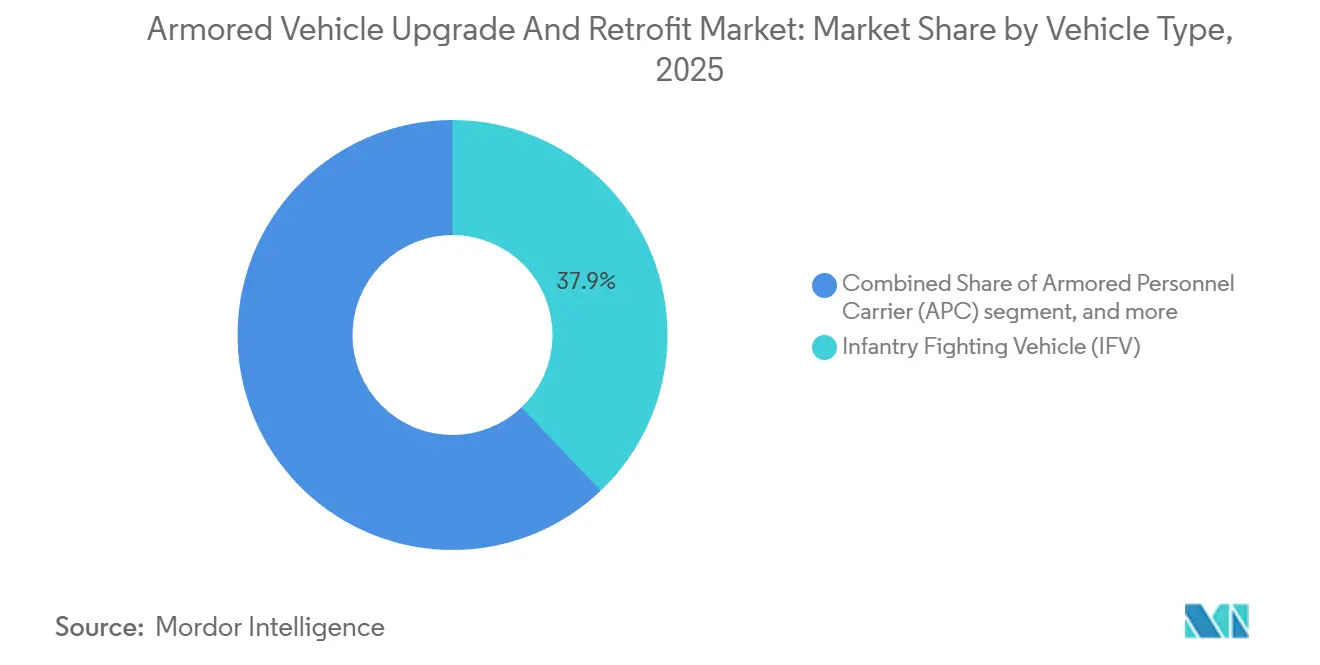
- By vehicle type, infantry fighting vehicles (IFVs) led with a 37.89% revenue share in 2025; other vehicle types are projected to expand at an 11.56% CAGR through 2031.
- By upgrade type, armor and survivability kits captured 31.69% of 2025 spending, while powertrain electrification and energy systems will climb at a 9.97% CAGR through 2031.
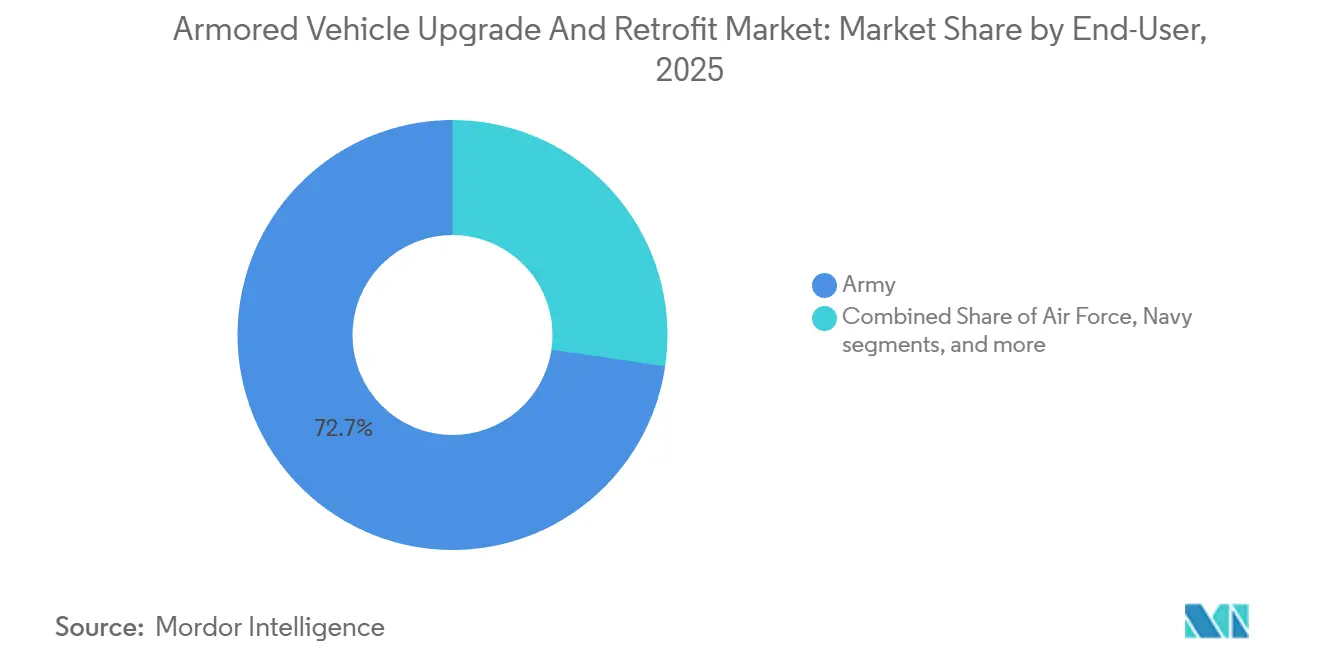
- By end user, the Army commanded a 72.67% share in 2025; homeland security and paramilitary forces are forecast to grow at a 10.78% CAGR through 2031.
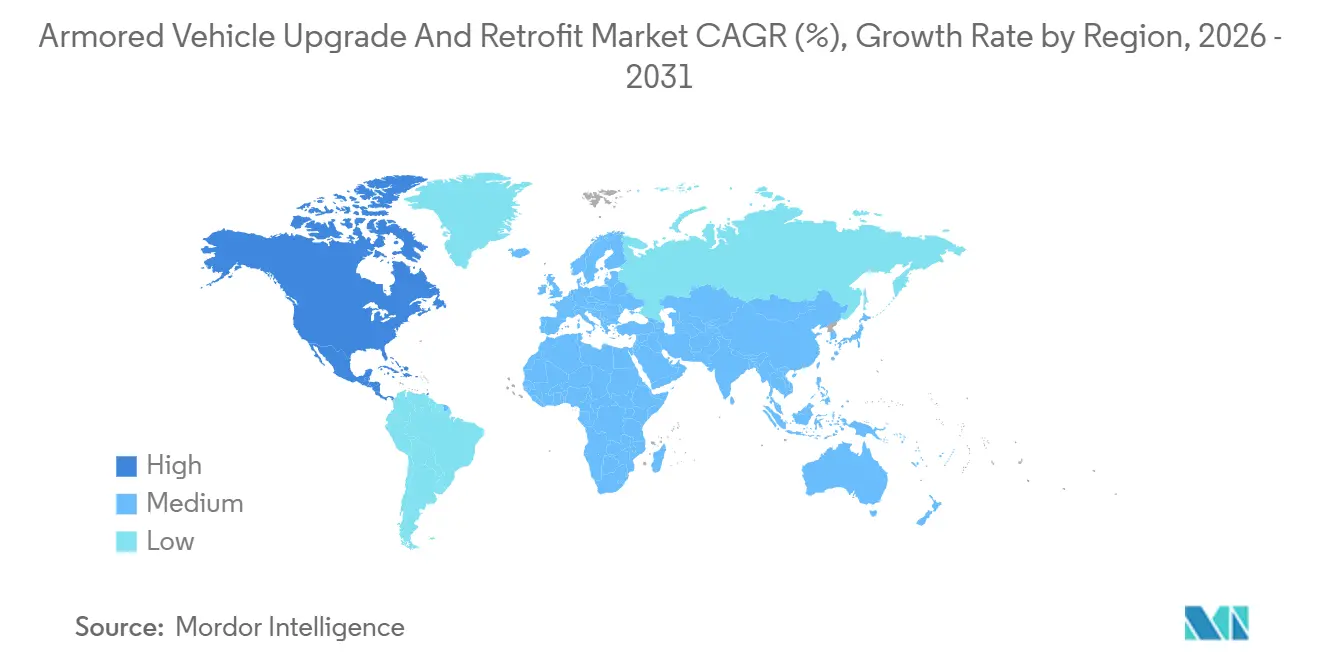
- By geography, the Asia-Pacific region generated 43.78% of 2025 revenue; North America is set to record the steepest CAGR from 2026 to 2031 at 12.21%.
Note: Market size and forecast figures in this report are generated using Mordor Intelligence’s proprietary estimation framework, updated with the latest available data and insights as of January 2026.
Market Trends and Insights
Drivers Impact Analysis of Armored Vehicle Upgrade and Retrofit Market*
| Driver | (~) % Impact on CAGR Forecast | Geographic Relevance | Impact Timeline |
|---|---|---|---|
| Modernization of ageing armored fleets | +2.1% | North America, Europe, Middle East | Long term (≥ 4 years) |
| Rising defense budgets and geopolitical tensions | +1.8% | Eastern Europe, Indo-Pacific, Middle East | Medium term (2-4 years) |
| Demand for enhanced survivability vs IEDs and drones | +1.6% | Middle East, Africa, South Asia | Short term (≤ 2 years) |
| Digitization and network-centric warfare upgrades | +1.4% | North America, Europe, advanced APAC | Medium term (2-4 years) |
| Field-deployable additive-manufactured retrofit kits | +0.9% | North America, Europe, pilot programs in Middle East | Long term (≥ 4 years) |
| Hybrid/electric-propulsion retrofits for silent mobility | +0.8% | North America, Europe, selected APAC | Long term (≥ 4 years) |
| Source: Mordor Intelligence | |||
Modernization of Ageing Armored Fleets
The median age of NATO MBTs reached 28 years in 2025, and service-life extensions to 40-45 years now rely on overhauls of the powertrain, armor, and electronics rather than wholesale replacement.[1] Poland’s 250-unit Leopard 2PL program demonstrates how incremental upgrades support interoperability while preserving budgets for artillery and air defense priorities. The US shifted USD 1.2 billion from a clean-sheet Abrams variant to SEPv4 upgrades that add Israeli Trophy active protection and next-generation infrared sensors. Similar logic informs Japan’s USD 340 million Type 90 tank refresh, which incorporates network radios and counter-drone electronic warfare (EW) modules. These cases demonstrate that retrofit strategies maintain industrial lines open and distribute risk over time.
Rising Defense Budgets and Geopolitical Tensions
Global defense outlays increased by 6.8% in 2025 to USD 2.24 trillion.[2] Germany’s Zeitenwende initiative injected EUR 3.1 billion (USD 3.61 billion) into overhauls of the Leopard and Puma, signaling a durable shift in budget priorities away from austerity. South Korea devoted USD 890 million to K2 and K21 enhancements that incorporate hard-kill protection and laser warning receivers. The Indo-Pacific share of retrofit spending rose from 38% in 2023 to 43.78% in 2025, fueled by India’s USD 4.2 billion BMP-2 program and Australia’s Land 400 Phase 3 initiative. Sustained budget momentum underwrites multi-year contracts and de-risks supplier investment.
Demand for Enhanced Survivability vs IEDs and Drones
Improvised explosive devices and first-person-view drones caused 62% of armored-vehicle losses in Ukraine through mid-2025. Operators are responding with layered active-plus-electronic defenses that swap passive armor mass for radar, counter-UAS jammers, and laser dazzlers. The US Stryker A1 integrates vehicle-protection suites that create a full 360-degree defeat envelope against quadcopter threats. Rafael recorded a 340% jump in Iron Fist orders between 2024 and 2025, reflecting global recognition of the system’s 15-millisecond intercept cycle. The weight savings from active layers, often ranging from 1,200 to 1,800 kilograms per platform, preserve mobility without compromising safety standards defined in STANAG 4569.
Digitization and Network-Centric Warfare Upgrades
NATO mandates that all combat vehicles carry Link 16 and Coalition Shared Data links by 2028, pushing a USD 2.1 billion retrofit wave across the Bradley, Stryker, and Abrams fleets. Germany’s Puma integrates the Gladius soldier system, which fuses vehicle sensors with infantry tablets to synchronize fires inside a 5-kilometer bubble.[3] France’s Scorpion program reduced call-for-fire timelines to under 90 seconds on 200 VBCI carriers after equipping them with CONTACT radios and SYNAPS software. Cybersecurity now dominates specifications, and STANAG 4774 requires hardware-based encryption, as well as air-gapped firmware updates, which collectively add up to USD 180,000 per vehicle, thereby mitigating the hacks that plagued commercial telematics in 2024.
Restraints Impact Analysis of Armored Vehicle Upgrade and Retrofit Market*
| Restraint | (~) % Impact on CAGR Forecast | Geographic Relevance | Impact Timeline |
|---|---|---|---|
| High program and component costs | -1.2% | Budget-constrained markets in South America, Africa, Southeast Asia | Short term (≤ 2 years) |
| Integration complexity with legacy platforms | -0.9% | 1980s-1990s fleets in Europe and North America | Medium term (2-4 years) |
| Budget volatility and procurement cycles | -0.7% | Democracies with multi-year appropriations | Short term (≤ 2 years) |
| Emerging cybersecurity risks in digital retrofits | -0.5% | North America, Europe, advanced APAC | Medium term (2-4 years) |
| Source: Mordor Intelligence | |||
High Program and Component Costs
Active-protection kits add USD 300,000-500,000 per vehicle, and a full C4ISR suite can push incremental costs past USD 1.2 million, eroding the financial logic of retrofits when more than 60% of subsystems need replacement. The Bradley M2A4E1 upgrade now sits at USD 4.3 million per unit, only 28% cheaper than a clean-sheet equivalent. Rare-earth magnet prices remain volatile, forcing some programs to accept torque densities 15-20% lower with ferrite substitutes. South American and African customers respond by buying partial upgrade packages, fragmenting volumes, and squeezing economies of scale.
Integration Complexity with Legacy Platforms
Bridging MIL-STD-1553 data buses to modern Ethernet required an 18-month middleware sprint on the US Marine Corps Amphibious Combat Vehicle refresh. Germany’s Leopard 2A7V spent 14 additional months in engineering when its hydraulic turret drive could not handle the 900-kilogram weight rise from modular armor and sensors. Trophy integration on Israeli Merkava Mark 3 tanks caused electromagnetic interference with legacy radios on 23% of units, prompting a fleet-wide harness retrofit.[4] Such bottlenecks can stretch schedules by 18 to 36 months and incur unexpected, non-recurring costs.
*Our forecasts treat driver/restraint impacts as directional, not additive. The impact forecasts reflect baseline growth, mix effects, and variable interactions.
Armored Vehicle Upgrade and Retrofit Market Segment Analysis
By Vehicle Type:
IFVs Lead, Logistics Variants AccelerateInfantry fighting vehicles (IFVs) retained 37.89% of the 2025 armored vehicle upgrade and retrofit market share, underscoring their central role in combined-arms maneuver. The armored vehicle upgrade and retrofit market size for support vehicles is poised for faster growth, with logistics carriers, command posts, and engineering variants projected to post an 11.56% CAGR through 2031. IFV programs consume disproportionate budgets because lethality and survivability must match peer MBTs. The US Bradley M2A4 integrates Iron Fist Light Decoupled active protection and third-generation infrared, demonstrating the cost intensity of IFV refresh cycles. Mine-resistant vehicles receive steady orders for counter-insurgency theaters, while APCs gain momentum through interoperability mandates such as Canada’s Light Armoured Vehicle 6.0 line.
Lower-baseline capability lets support variants realize step-function benefits from modest upgrades, and armies now treat rear-echelon protection as an operational imperative. The M88A3 recovery vehicle retrofit, which incorporates Trophy and Link 16, exemplifies the trend of enhancing survivability for maintenance and logistics assets. Amphibious and medium-weight platforms also enter the pipeline as emerging markets seek versatile assets that double as disaster-relief vehicles. Together, these factors keep the armored vehicle upgrade and retrofit market on a trajectory where combat and support fleets modernize in parallel rather than sequentially.

By Upgrade Type:
Electrification Gains MomentumArmor and survivability kits secured 31.69% of 2025 spend as customers raced to field hard-kill solutions with verified combat performance. Trophy’s 95% intercept rate in 2025 validated the pivot from passive armor to integrated detection-defeat layers. Remote-weapon stations (RWS) continue to proliferate, with Kongsberg expected to deliver its 12,000th CROWS-J by mid-2025. Mobility packages restore baseline performance after vehicles gain 2,000-3,000 kilograms from protection and electronics. Open-architecture electronics shorten integration timelines, and the Common Modular Open Suite of Standards reduces software drop cycles from 24 months to 8 months.
Powertrain electrification and energy systems are expected to post the fastest segment growth at a 9.97% CAGR. Hybrid demonstrators achieve 70% fuel savings during silent watch, tripling loiter time in contested areas. GM Defense’s eLTV illustrates how exportable electric power underpins future sensor and laser payloads.[5] Run-flat tires, software patches, and crew-comfort inserts round out the “Other” category, together reducing maintenance downtime by over 20%.
By End User:
Homeland Security AcceleratesThe Army commanded 72.67% of the 2025 revenue, a figure that reflects its substantial inventories and priority access to modernization appropriations. Multi-year US Army contracts covering Abrams, Bradley, and Stryker fleets ensure a stable baseline for prime contractors. Naval forces refresh amphibious assault vehicles to maintain littoral relevance, while air force security units procure limited mine-resistant vehicles for base defense.
Homeland security and paramilitary agencies are expected to grow at a 10.78% CAGR through 2031, the highest among end-users. The US Customs and Border Protection (CBP) issued a USD 187 million order in 2025 to add electronic-warfare kits and thermal imagers to 340 M-ATVs, illustrating how non-military buyers now demand near-military protection levels. European gendarmeries purchased 1,200 armored patrol vehicles in 2025 to counter unmanned aerial and ground threats, representing a 65% increase from 2023. The armored vehicle upgrade and retrofit market, therefore, extends beyond defense ministries and into civil-security domains where rapid capability insertion offers immediate operational payoff.
Geography Analysis
APAC Armored Vehicle Upgrade and Retrofit Market
The Asia-Pacific region generated 43.78% of the 2025 revenue for the armored vehicle upgrade and retrofit market, a lead built on India's USD 4.20 billion BMP-2 program and South Korea's K2/K21 retrofits. Japan's USD 340 million Type 90 refresh, along with rising interest from Southeast Asian buyers, sustains regional momentum. Open-source imagery also shows China integrating active protection on roughly 400 Type 96/Type 99 tanks by late 2025, although Beijing discloses few details about the program.
North America Armored Vehicle Upgrade and Retrofit Market
North America is expected to record the fastest 2026-2031 CAGR of 12.21% as the US ramps up armored vehicle procurement and upgrade programs, including armored multi-purpose vehicle (AMPV) production and upgrades to its legacy combat fleets. Canada's LAV 6.0 entered full-rate production in 2025, and Mexico invested USD 210 million in mine-resistant vehicles with counter-drone kits to harden domestic security operations. Consistent appropriations and a preference for incremental capability upgrades underpin regional growth.
EMEA and South America Armored Vehicle Upgrade and Retrofit Market
Europe trails the Asia-Pacific region in revenue but benefits from Germany's Zeitenwende spending, France's Leclerc XLR program, and Poland's Leopard 2PL conversion. The United Kingdom's Challenger 3 line entered production in 2025, closing a rifled-gun gap that had limited ammunition commonality with NATO allies. The Middle East remains a pivotal theater, with Saudi Arabia's USD 1.8 billion Abrams plan and the UAE's efforts to indigenize shaping the local industry footprint. South America and Africa pursue selective refresh work constrained by fiscal headwinds, yet flagship projects in Brazil and South Africa signal longer-term potential.
Regulatory Landscape
Retrofit programs are shaped by interoperability and protection benchmarks set by NATO. STANAG 4754, aligned with the NATO Generic Vehicle Architecture, anchors electronic and power-infrastructure choices, while STANAG 4569 defines armor performance and survivability certification for upgraded fleets.
In the United States, modernization-focused procurement policies continue to influence sustainment planning for armored platforms. In May 2026, AR 750-1 and DA PAM 750-1 were revised to institutionalize modern maintenance policy and technical-data access, and in July 2026 the Aberdeen Test Center and DEVCOM partnership was established to tighten qualification and acceptance for upgraded configurations.
Value Chain Analysis
Operators and ministries define capability gaps, then primes and lead integrators such as General Dynamics Land Systems, BAE Systems, Rheinmetall, and KNDS engineer upgrade baselines, manage platform-level integration, and run verification and acceptance with government test organizations. Subsystem specialists provide high-value retrofit content, including active protection, fire-control and electro-optics, armor modules, power management and electronic distribution, and digital or electrical backbones aligned to open-architecture requirements.
Execution typically runs through OEM lines, national depots, and in-country industrial partners to meet sovereignty and local-content rules. In 2026, Hanwha Aerospace working with Malaysia-based Cendana Auto on a K200A1 upgrade prototype and Textron resuming MSFV production at its Slidell, Louisiana facility for Ukraine-related demand illustrate how these supply-chain structures support both prototype and retrofit work. Bottlenecks concentrate in integration engineering, qualification testing cycles, and constrained components, including rare-earth dependent electric machines and secure vehicle electronics, making long-lead procurement, modular kit architectures, and staged fielding common risk-mitigation tactics.
Competitive Landscape
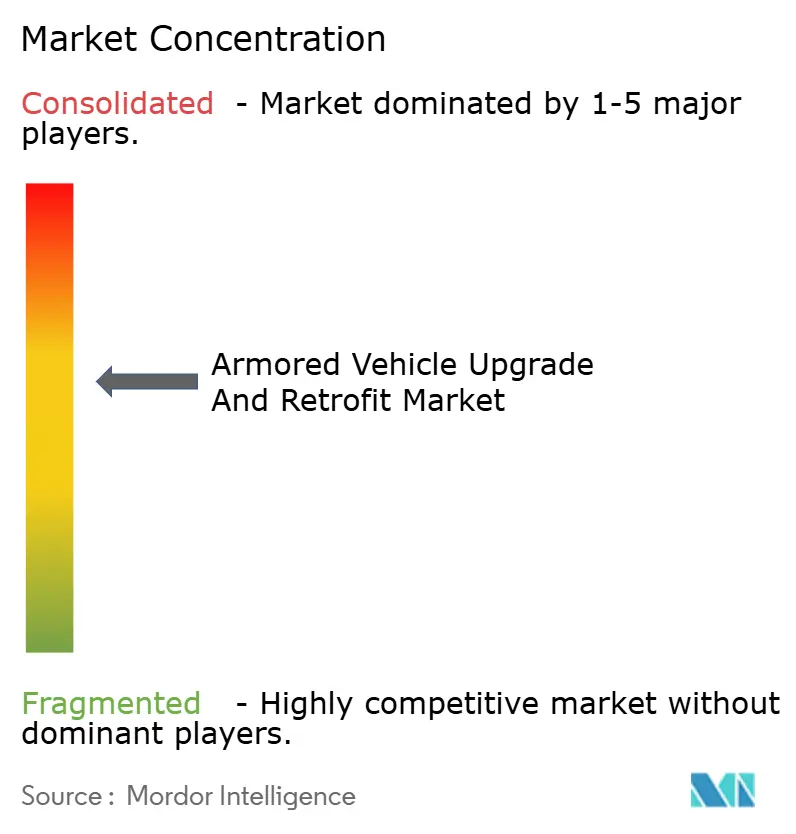
The armored vehicle upgrade and retrofit market exhibits moderate concentration, with the top five suppliers such as General Dynamics Corporation, Rheinmetall AG, BAE Systems plc, Elbit Systems Ltd., and Oshkosh Corporation. Tier-2 integrators, such as FNSS, Otokar, and ST Engineering, undercut primes by 20-30% with modular kits, gradually eroding incumbents' market positions. Rheinmetall's 55% stake in Leonardo DRS provided the German firm with a transatlantic pipeline for active-protection sensors, prompting BAE and Elbit to expand their own electronics portfolios.
Modularity and open architecture drive strategy. BAE's Common Modular Open Suite of Standards enables third-party plug-ins, shortening fielding timelines to under 12 months and turning speed into a commercial differentiator. Elbit's TORCH-X software follows a similar playbook by decoupling the user interface from hardware. Additive manufacturing represents the newest white-space, with US Army depot trials proving that field printers can cut lead times for bespoke parts by 90%.
Hybrid-electric propulsion is emerging as a key battleground. BAE's Bradley demonstrator and GM Defense's eLTV compete on exportable power metrics relevant to directed-energy systems, while Hanwha Defense bundles technology transfer into Poland's and Australia's contracts to gain political traction. Cybersecurity compliance under STANAG 4774 forms a final competitive axis, adding USD 180,000 per vehicle but acting as a non-price barrier for late entrants.
Armored Vehicle Upgrade and Retrofit Industry Leaders
-
General Dynamics Corporation
-
Rheinmetall AG
-
BAE Systems plc
-
Oshkosh Corporation
-
Elbit Systems Ltd.
- *Disclaimer: Major Players sorted in no particular order
Armored Vehicle Upgrade and Retrofit Market Companies Covered in this Report
- General Dynamics Corporation
- Rheinmetall AG
- BAE Systems plc
- Textron Inc.
- Elbit Systems Ltd.
- Oshkosh Corporation
- KNDS N.V.
- FNSS Savunma Sistemleri A.S.
- Thales Group
- RUAG International Holding AG
- Patria Plc
- Bharat Electronics Limited
- AM General LLC
- Otokar Otomotiv ve Savunma Sanayi A.Ş.
- Singapore Technologies Engineering Ltd.
Market Opportunities and Future Outlook
Open-architecture electronics and cyber-compliant digital retrofits create a clear space for fleets that need faster insertion of sensors, C4ISR, and counter-drone functions without repeated platform redesign. The NATO-driven interoperability pull-through aligned to NGVA architectures, alongside mandated data links, supports demand for modular mission kits, middleware, and secure upgrade pathways that can reduce integration burden across mixed fleets.
Survivability and lethality packages remain a high-value opportunity as operators shift from passive add-on armor toward layered, sensor-led defeat chains and modern fire control. Contracting activity already points to this direction, including Elbit Systems' May 2026 award of a USD 350 million international contract for MBT mid-life upgrades covering fire control, electric turret drives, communications, and electro-optical sights, and Sweden FMV's February 2026 pre-engineering contract (335 million SEK) to extend CV90 variants to at least 2045. Industrial participation and local build requirements also keep room for tier-2 integrators and domestic partners that can package certified subsystems into country-specific upgrade kits and sustainment bundles.
Recent Industry Developments in Armored Vehicle Upgrade and Retrofit Market
- June 2026: Rheinmetall received an order from the Bundeswehr to replenish 23 Bergepanzer 3 Bueffel armored recovery vehicles, following a budget decision on 10 June 2026. The order reinforces near-term demand for support-vehicle refurbishment and readiness restoration, including backfilling assets transferred to allies.
- December 2025: BAE Systems Inc. secured a contract modification to procure 240 Armored Multi-Purpose Vehicles (AMPVs), awarded by the Army Contracting Command, Detroit Arsenal. The action extends the AMPV program through May 2028 and sustains a pipeline of new-build and related upgrade work tied to fielding and configuration management.
- August 2024: General Dynamics Land Systems secured a USD 174.40 million contract from the US Army to retrofit and repair the Stryker family of vehicles. The award supports lifecycle sustainment and capability refresh for an in-service fleet, keeping depot throughput and upgrade-kit integration activity at scale.
Armored Vehicle Upgrade and Retrofit Market Report Scope and Research Methodology
Market Definition and Coverage
This market covers spending tied to upgrading and retrofitting in service armored vehicles, where existing platforms receive new or improved subsystems to extend life and improve mission performance. We treat the market as the value of modernization work executed through programs, kits, and integration services across defense and security users.
Scope exclusions: Excluded are new vehicle procurement, routine depot maintenance without capability uplift, and pure ammunition and consumables spend.
Segments Covered in This Report
- By Vehicle Type
- Armored Personnel Carriers (APCs)
- Infantry Fighting Vehicles (IFVs)
- Mine-Resistant Ambush Protected (MRAP) Vehicles
- Main Battle Tanks (MBTs)
- Other Vehicle Types
- By Upgrade Type
- Armor and Survivability Kits
- Weapon and Remote Weapon Stations
- Mobility (Engine, Transmission, Suspension)
- Electronics/Sensors/C4ISR
- Powertrain Electrification and Energy Systems
- Other Upgrades (Tires, Software, etc.)
- By End User
- Army
- Navy
- Air Force
- Homeland Security and Paramilitary
- By Geography
- North America
- United States
- Canada
- Mexico
- Europe
- United Kingdom
- France
- Germany
- Russia
- Rest of Europe
- Asia-Pacific
- China
- India
- Japan
- South Korea
- Rest of Asia-Pacific
- South America
- Brazil
- Rest of South America
- Middle East and Africa
- Middle East
- United Arab Emirates
- Saudi Arabia
- Rest of Middle East
- Africa
- South Africa
- Rest of Africa
- Middle East
- North America
Data Sources, Market Sizing, and Validation
Desk Research
Desk research was used to set the demand context and to anchor the model to observable defense signals that can be checked year to year. We referenced public budget and procurement releases, such as national defense budget documents and legislative appropriation summaries, then reviewed force structure and platform fleet information from defense ministries and official armed forces publications.
To keep inputs consistent across regions, we also reviewed sources such as UN Comtrade for trade signals linked to armored vehicle subsystems, SIPRI military expenditure series for macro guardrails, and technical papers and standards bodies for upgrade themes like protection levels and electronic architectures. Company filings, investor decks, press releases, and reputable defense press were then used to confirm program timing, contract values, and typical upgrade content. In some cases, paid subscriptions for company financials, contract and tenders tracking, and defense program databases were used to speed up cross checks. The sources listed here are illustrative only, and we also referred to many other public materials for data collection, validation, and clarification.
Primary Interviews and Surveys
Primary work focused on validating what is counted as an upgrade versus maintenance, and how budgets convert into delivered retrofit kits and integration work. We spoke with program level stakeholders, system integrators, subsystem suppliers, and users across APAC, EMEA, and the Americas, so assumptions on refresh cycles, typical content per platform, and price movement could be corrected when needed.
Distribution of primary research fieldwork respondents
| Company type | Respondent position | Region |
|---|---|---|
| Top tier: 36% | CXOs: 12% | APAC: 42% |
| Mid tier: 43% | Functional/Unit leaders: 34% | EMEA: 36% |
| Smaller Players: 21% | Managers: 54% | Americas: 22% |
Market-Sizing & Forecasting
Sizing starts from a top-down build where defense modernization budgets and platform fleet counts are translated into an addressable upgrade pool by applying penetration rates for mid-life upgrades and subsystem refresh cycles. The totals are then stress tested with selective bottom-up approximations, such as sampled program values, contract awards, and an ASP x volume check for common retrofit bundles, which helps adjust for countries where public disclosures are limited.
Key inputs used in the model include the installed base of tracked and wheeled armored platforms, upgrade cycle timing (life-extension and mid-life overhaul windows), protection and survivability retrofit intensity, electronics and vetronics content growth, and the share of budgets routed through domestic programs versus international integrators. Where gaps appear in country level disclosure, proxy indicators like regional military spend trends, known platform modernization roadmaps, and comparable fleet to spend ratios were used, and then corrected through interview feedback.
For forecasting, scenario analysis was applied around defense budget paths and modernization urgency, and the central case was further shaped using exponential smoothing on contract and program timing signals. The final forecast stays tied to practical constraints like delivery schedules, retrofit capacity, and the pace of subsystem qualification.
Data Validation & Update Cycle
Outputs are triangulated through multiple checks so the final market numbers do not rely on a single data series. We compare the model results against independent signals like modernization line items, contract award run rates, and platform fleet activity, and then investigate outliers at country and program level before sign-off.
A second analyst review is completed for key assumptions, conversion logic, and year alignment, followed by a consistency pass across regions to avoid double counting between platform and subsystem work. The report is refreshed annually, and interim updates are triggered when major conflicts, procurement freezes, or large modernization awards materially change demand. Before delivery, a final refresh pass is performed so clients receive the most current view available.
Mordor Intelligence's Armoured Vehicles Upgrade and Retrofit Market Size Compared Against Other Published Estimates
Published market sizes for armored vehicle upgrades and retrofits can look far apart because each publisher draws the scope differently, and then uses different evidence to connect budgets, fleets, and contract awards into one number. The biggest splits usually come from what gets counted as an upgrade, which geographies are covered, and whether the estimate follows signed programs or assumes a broader potential demand pool.
Contract award run rates, defense modernization line items, and platform fleet upgrade roadmaps are the checks that keep Mordor Intelligence tied to executed upgrade and retrofit work, with new vehicle procurement and routine upkeep kept out of the counted totals. Differences also show up when some estimates include adjacent areas like broader land systems electronics, or when currency timing and refresh cadence are not aligned to the same base year.
Benchmark comparison
| Source | Market Size | Gaps in Research Methodology |
|---|---|---|
| Mordor Intelligence | USD 8.65 B (2026) | |
| Industry Research Outlet A | USD 3.60 B (2024) | Uses an earlier base year and a narrower counted scope that appears to focus on a smaller set of disclosed upgrade programs and end users, which reduces the captured integration and qualification value. |
| Global Research Publisher B | USD 6.70 B (2025) | Represents a different year and likely applies conservative upgrade penetration and content assumptions per platform, and it may undercount electronics, protection, and powertrain retrofit bundles when they are delivered as multi-year packages. |
Across the three figures, most of the spread is explained by year alignment and by what is treated as modernization versus adjacent defense spend. When the scope is tied back to observable budgets, fleets, and awarded programs, the final total is easier to replicate and update as new contracts are published.
Key Questions Answered in the Report
How large is the armored vehicle upgrade and retrofit market in 2026?
It is valued at USD 8.65 billion in 2026, with a forecasted rise to USD 13.63 billion by 2031, reflecting a 9.51% CAGR.
Which vehicle type commands the biggest share of upgrade spending?
Infantry fighting vehicles (IFVs) account for 37.89% of 2025 revenue due to their dual role in troop transport and direct fire.
What region will see the fastest growth through 2031?
North America is projected to post a 12.21% CAGR, driven by US and Canadian programs.
Why are hybrid-electric retrofits gaining traction?
Silent mobility and exportable electrical power for sensors and directed-energy weapons make hybrid drives attractive despite higher component costs.
Which companies lead the competitive landscape?
General Dynamics, Rheinmetall, BAE Systems, Elbit Systems, and Oshkosh together held roughly 60% of 2025 revenue.
What is the main restraint facing retrofit programs?
High component costs and integration complexity can narrow the financial gap versus purchasing new vehicles, especially when more than 60% of systems require replacement.