
Armored Vehicle Fire Suppression Systems Market Size and Share
Market Overview
| Study Period | 2020 - 2031 |
|---|---|
| Market Size (2026) | USD 1.78 Billion |
| Market Size (2031) | USD 2.47 Billion |
| Growth Rate (2026 - 2031) | 6.73 % |
| Fastest Growing Market | Asia Pacific |
| Largest Market | North America |
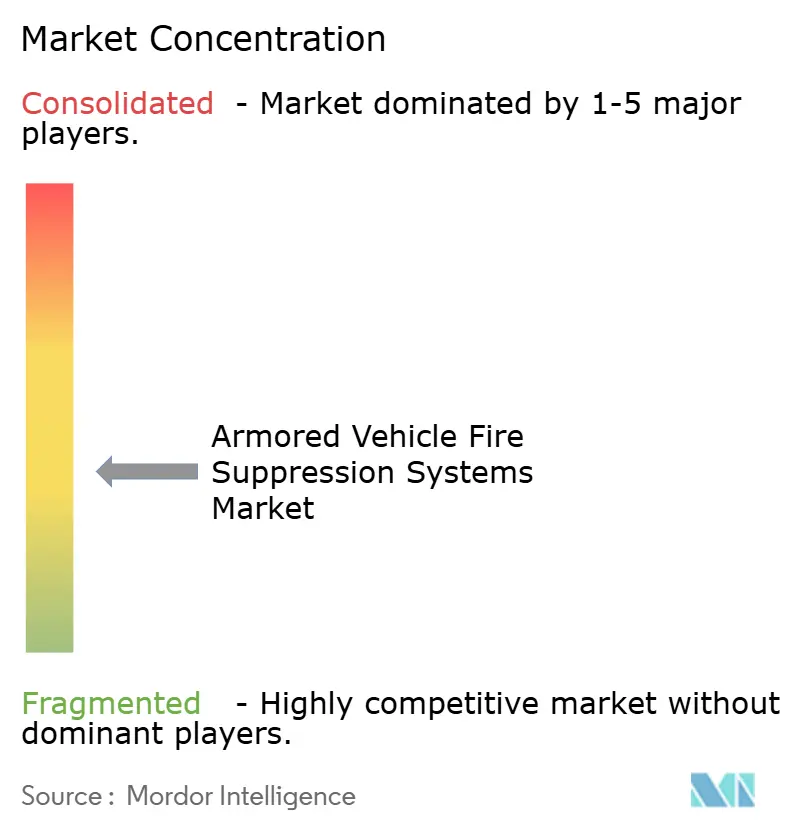
| Market Concentration | Medium |
Major Players *Disclaimer: Major Players sorted in no particular order Image © Mordor Intelligence. Reuse requires attribution under CC BY 4.0. | |
Armored Vehicle Fire Suppression Systems Market Analysis by Mordor Intelligence
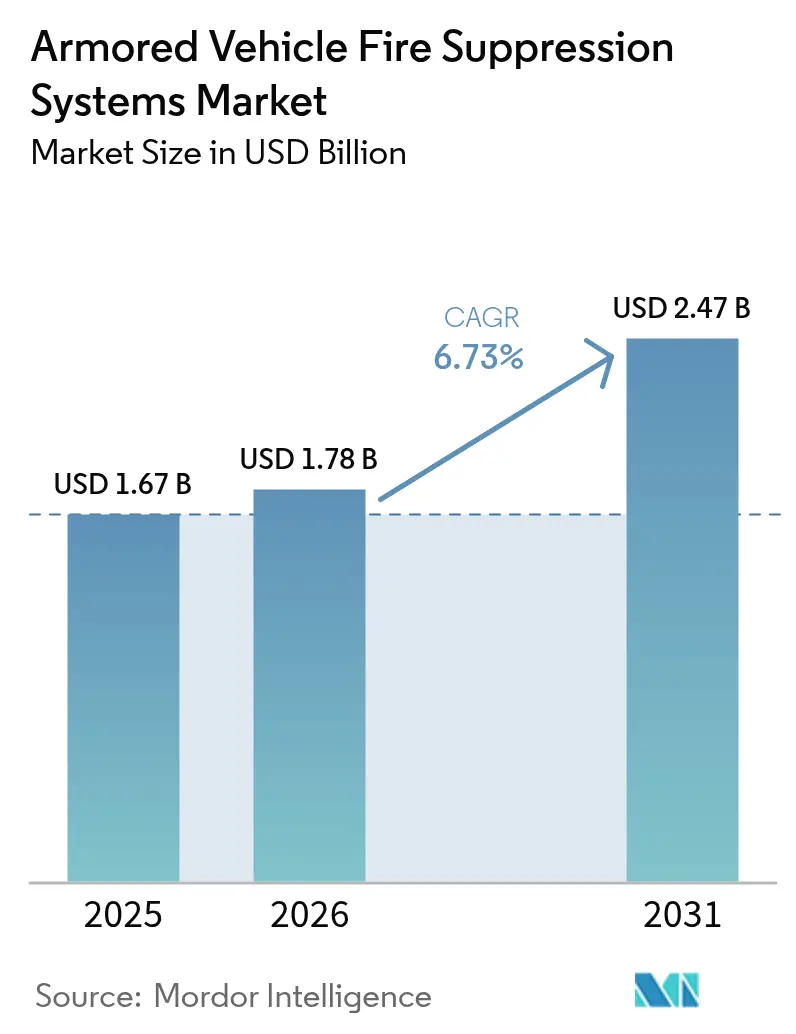
The armored vehicle fire suppression systems market size was valued at USD 1.67 billion in 2025 and estimated to grow from USD 1.78 billion in 2026 to reach USD 2.47 billion by 2031, at a CAGR of 6.73% during the forecast period (2026-2031). Rising defense modernization budgets, a global ban on Halon, and the push to replace PFAS-containing foams are expanding procurement pipelines across major vehicle upgrade and new-build programs.[1] Demand also benefits from sensor miniaturization that delivers sub-10-millisecond autonomous discharge, ensuring compliance with stringent MIL-STD-810H false-alarm requirements. Rapid electrification of combat platforms, exemplified by battery-powered infantry fighting vehicles under evaluation in Europe and South Korea, reshapes agent chemistry specifications and spurs innovation in predictive thermal management. North America anchors spending, but Asia-Pacific’s double-digit defense outlays make it the fastest-growing regional opportunity for suppliers able to deliver PFAS-free, AI-enabled solutions. Competitive dynamics center on integration know-how rather than price, with leading vendors coupling fire suppression with active protection suites to present unified survivability architectures.
Key Report Takeaways
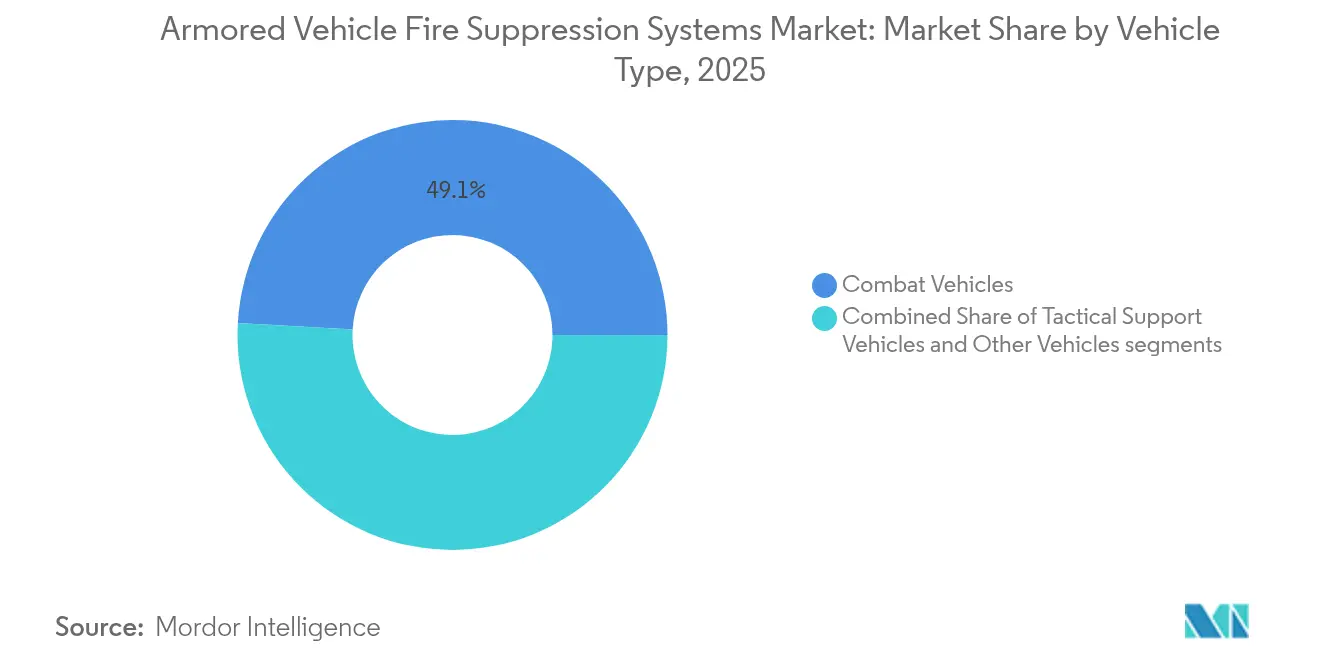
- By vehicle type, combat vehicles led with 49.12% revenue share in 2025, while tactical support vehicles are projected to post a 7.34% CAGR to 2031.
- By system type, automatic/autonomous solutions held 66.55% of the armored vehicle fire suppression systems market share in 2025; hybrid configurations are expected to expand at a 9.02% CAGR.
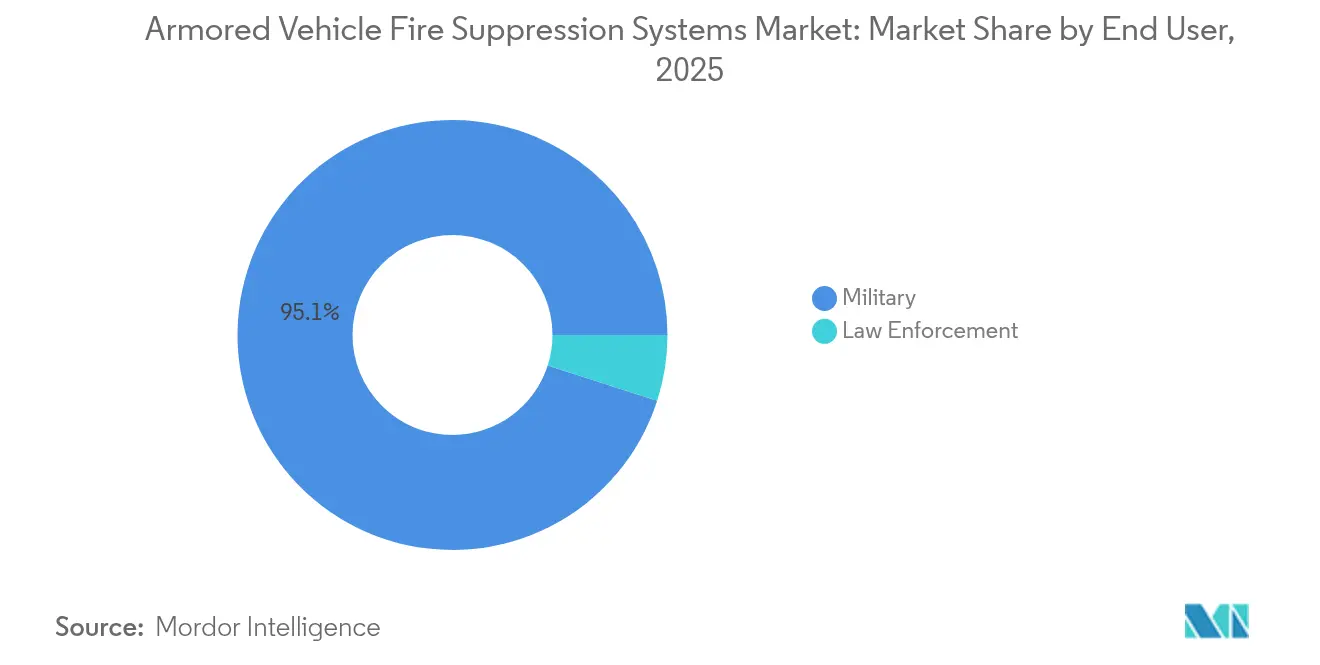
- By end user, military programs commanded 95.05% of demand in 2025, whereas law-enforcement fleets exhibit the highest 8.14% CAGR outlook through 2031.
- By component, cylinders and agents accounted for 39.22% of the armored vehicle fire suppression systems market size in 2025; detectors and sensors will rise fastest at a 7.51% CAGR.
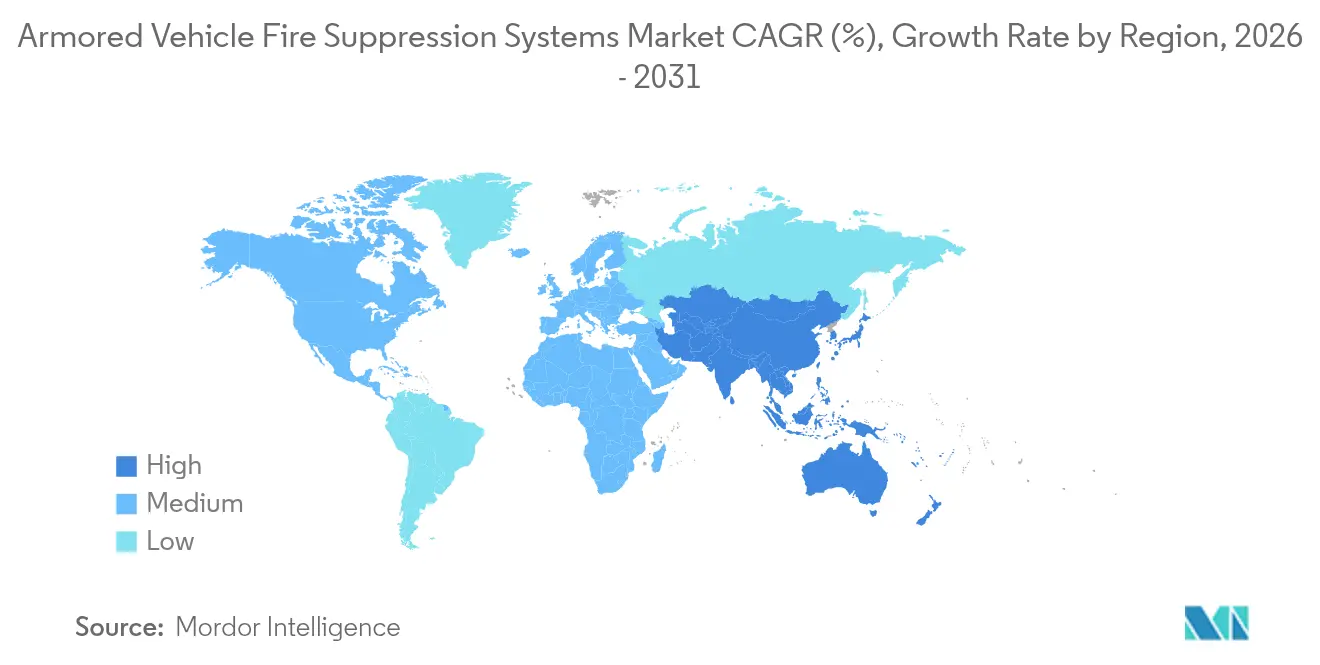
- By geography, North America contributed 47.25% of 2025 revenue, but Asia-Pacific is poised to grow at an 8.07% CAGR to 2031.
Note: Market size and forecast figures in this report are generated using Mordor Intelligence’s proprietary estimation framework, updated with the latest available data and insights as of 2026.
Market Trends and Insights
Drivers Impact Analysis of Armored Vehicle Fire Suppression Systems Market*
| Driver | (~) % Impact on CAGR Forecast | Geographic Relevance | Impact Timeline |
|---|---|---|---|
| Shift-to-electric combat platforms | +1.2% | Global (early adoption NA and EU) | Medium term (2-4 years) |
| Stricter MIL-STD-810H safety mandates | +0.9% | North America and NATO allies | Short term (≤ 2 years) |
| Lightweight non-Halon agents | +0.8% | Global | Medium term (2-4 years) |
| Auto-detect AI sensor fusion | +1.1% | North America and EU | Long term (≥ 4 years) |
| Active protection system (APS) integration | +0.7% | Europe and APAC | Long term (≥ 4 years) |
| Increased global defense spending and modernization programs | +1.4% | Global, with highest impact in Europe, APAC, and North America | Short term (≤ 2 years) |
| Source: Mordor Intelligence | |||
Shift-to-Electric Combat Platforms
Lithium-ion propulsion elevates fire-load density in armored hulls, creating thermal runaway scenarios that reach 400°C and defeat legacy Halon-based solutions. Platforms under Germany’s KF41 Lynx and South Korea’s Redback-K programs specify suppression agents that remain effective inside sealed battery casings while coordinating with 80 kW cooling packs derived from RTX’s fighter-jet thermal systems. Chinese GB 38031-2020 mandates a 5-minute propagation delay, signaling that the benchmark military fleets will emulate. To comply, OEMs layer Kapton-based insulation, predictive cell-isolation algorithms, and distributed nozzle arrays that flood battery bays before cascading failure begins.[2]
Stricter MIL-STD-810H Safety Mandates
The newest MIL-STD-810H tests require suppression hardware to endure −54°C arctic deployments, 71°C desert heat, and heavy-caliber shock while sustaining electromagnetic compatibility with vehicle radios. Contractors answer with dual-spectrum optical sensors that combine mid-wave IR and UV bands, trimming false activations below 0.1% and cutting crew workload. Compliance demands extensive lab cycles that lengthen development by 120 days, tipping the advantage to firms with in-house chambers. Algorithms trained on field telemetry now distinguish solar glint from true ignition, enabling machines to suppress fires even when vision blocks are obscured by dust or smoke.
Lightweight Non-Halon Agents (FK-5-1-12)
Novec 1230 offers zero ozone depletion and a 0.014 global warming potential, allowing total flooding in occupied spaces without toxic by-products. Flow-field studies show that the agent discharges evenly through narrow crew-compartment manifolds, eliminating the risk of cold-spot reignition. Militaries demand extinguishment within 30 seconds at minimal volume, a criterion the agent meets while trimming bottle mass to offset additional APS radars. Higher cost prompts buyers to favor multiyear contracts that secure price breaks and guarantee batch consistency.
Auto-Detect AI Sensor Fusion
AI-enabled arrays merge IR, thermal, and acoustic signatures to flag ignition within 10 milliseconds and classify event type with 99.7% confidence. Northrop Grumman’s ATHENA pod, selected for the US Army’s improved threat-detection kit, delivers 360° coverage while filtering clutter from APS radar sweeps.[3] Machine-learning models retrain on board, driving down false alarms over service life and letting crews focus on maneuver instead of manual firefighting drills.
Restraints Impact Analysis of Armored Vehicle Fire Suppression Systems Market*
| Restraint | (~) % Impact on CAGR Forecast | Geographic Relevance | Impact Timeline |
|---|---|---|---|
| Supply-chain bottlenecks for PFAS-free agents | -0.6% | Global (NA and EU acute) | Short term (≤ 2 years) |
| High retrofit cost for legacy fleets | -0.4% | Global | Medium term (2-4 years) |
| Weight-penalty vs. active armor trade-off | -0.3% | Europe and APAC | Long term (≥ 4 years) |
| IP ownership concentration | -0.2% | Global | Long term (≥ 4 years) |
| Source: Mordor Intelligence | |||
Supply-Chain Bottlenecks for PFAS-Free Agents
Only three fluorine-free foams meet US Defense Department standards, yet 2 million gallons must be fielded before October 2025, forcing the Pentagon to seek a one-year extension. Validation of each new batch stretches 120 days, leaving tactical vehicle rollouts waiting on lab queues. European forces face identical hurdles, risking divergent agent usage that undermines NATO logistic commonality.
High Retrofit Cost for Legacy Fleets
Switching from Halon to FK-5-1-12 can exceed 20% of a vehicle’s original procurement cost because piping diameters, storage pressures, and detection wiring all change. US DEVCOM trials of potassium bicarbonate alternatives illustrate the complexity of validating new flow dynamics inside steel hulls originally optimized for gaseous Halon. Nations with constrained budgets often delay upgrades, widening survivability gaps between modernized and legacy platforms.
*Our forecasts treat driver/restraint impacts as directional, not additive. The impact forecasts reflect baseline growth, mix effects, and variable interactions.
Armored Vehicle Fire Suppression Systems Market Segment Analysis
By Vehicle Type:
Combat Platforms Drive Market LeadershipThe armored vehicle fire suppression systems market size for combat vehicles amounted to nearly half of global revenue at 49.12% in 2025. Large-scale programs such as Italy’s EUR 16 billion (USD 18.87 billion) Armoured Combat System and Germany’s Leopard 2A8 procurement embed fully automatic, dual-zone extinguishers that simultaneously protect crew and engine bays. Spain, Romania, and Latvia have followed with tracked IFV buys that specify Novec-based flooding agents compatible with NATO standards.
Tactical support vehicles furnish the fastest 7.34% CAGR, mirroring doctrine shifts in Ukraine that expose logistics convoys to direct fire. The US Army’s M1E3 Abrams program emphasizes common survivability kits for tank-retrieval and ammunition-resupply variants, ensuring part interchangeability and easing training demands. Specialized recovery rigs and bridge layers also maintain demand, albeit at modest volumes, because their hydraulic equipment creates distinct ignition sources that require bespoke nozzle positioning.

By System Type:
Automation Dominance with Hybrid GrowthAutomatic and autonomous installations captured 66.55% of 2025 revenue, reflecting doctrinal reliance on sub-150-millisecond discharge that safeguards crews when immediate manual action is impossible. These systems combine dual-spectrum optics with pressure-rise sensors to cross-validate events before releasing agent, trimming costly inadvertent discharges.
Manual designs persist in low-intensity roles or nations prioritizing initial acquisition price over lifecycle risk. Yet hybrid configurations, blending automatic default with crew override, deliver the highest 9.02% CAGR. Operators appreciate the option to halt suppression in fuel-fume scenarios where venting remedies the hazard, avoiding agent wastage and downtime.
By End User:
Military Dominance with Law-Enforcement GrowthMilitary programs generated 95.05% of the 2025 demand as global defense spending hit USD 2.48 trillion. NBC hardening, electromagnetic shielding, and integration with battle-management networks put military specifications beyond typical civilian reach, locking in vendor specialization.
Law-enforcement agencies record an 8.14% CAGR, propelled by urban riot vehicles and border patrol armaments. Brazil’s procurement of Roshel Senator trucks, fitted with NATO-grade suppression, exemplifies the civil uptake of battlefield technologies and underscores the manufacturer’s ability to scale designs to non-military legal frameworks.
By Component:
Agent Systems Lead with Sensor InnovationCylinders and agents represented 39.22% of component revenue because consumables require periodic replenishment, generating annuity-like sales. The armored vehicle fire suppression systems market sees FK-5-1-12 dominate Western inventories while soy-based foams gain pilot adoption as prices fall and capacity scales.
Detectors and sensors post the strongest 7.51% CAGR. The move to sensor fusion triples semiconductor content per vehicle and elevates cybersecurity requirements, driving contracts that bundle firmware support with hardware supply. Nozzles, valves, and plumbing also benefit from new corrosion-resistant alloys suited to salt-spray naval variants, but growth remains tied to overall vehicle build rates.
Geography Analysis
North America Armored Vehicle Fire Suppression Systems Market
North America retained a 47.25% share in 2025, anchored by the US Department of Defense’s USD 2.1 billion PFAS-replacement initiative that directly funds agent production and retrofit kits. The FY 2025 defense budget of USD 920 billion holds spending steady, letting primes plan production lots five years out. Canada’s Arctic Mobility Enhancement program adds niche demand for low-temperature formulations able to flow at −40 °C in amphibious hulls. Mexico’s interoperability alignment with US standards further widens the continental installed base.
Europe Armored Vehicle Fire Suppression Systems Market
Europe accelerates procurement under NATO readiness goals, with 22 member states hiking defense budgets by at least 10% in real terms for 2025. Italy’s massive Lynx and Panther orders, Germany’s Leopard 2A8 buy, and Spain’s Leopard 2E overhaul all specify APS-linked suppression networks, establishing shared supply chains and stringent cyber-hardening baselines. Thales’ FMBTech consortium of 26 firms uses EU funding to coordinate valve geometry, sensor firmware, and agent logistics across borders, smoothing export licensing.
APAC Armored Vehicle Fire Suppression Systems Market
Asia-Pacific delivers the highest 8.07% CAGR. Japan’s record USD 59 billion 2025 defense budget finances Patria AMV XP local production featuring modular suppression that drops into Type 16 mobile gun and Type 96 APC hulls. China’s 2027 readiness goal pushes indigenous agent R&D to circumvent Western embargoes, while South Korea’s Redback-K embeds smart-bottle telemetry that alerts crews to pressure loss in real time. Southeast Asian modernization—from the Philippines’ USD 35 billion plan to Indonesia’s medium-tank acquisition—extends demand to tropical climates where high humidity influences agent longevity.
Regulatory Landscape
Armored vehicle fire suppression system design and qualification are shaped by both environmental policy for extinguishing agents and defense-specific survivability and test requirements. The Montreal Protocol phase-out continues to drive non-Halon substitution, and the US EPA SNAP program affects which halogenated agents can be specified in procurement.
For qualification, MIL-STD-810H environmental tests are commonly referenced for thermal, shock, vibration, and dust performance, while NATO STANAG 4317 (AEP-4317) provides procedures used to assess land-vehicle fire protection levels for interoperability. Buyers also account for platform-level safety regulations such as UNECE UN Regulation No. 34 on liquid fuel tank fire-risk prevention and UN Regulation No. 118 on burning behavior of interior materials. For crew-compartment systems, survivability constraints often include avoiding re-flash while maintaining breathable oxygen levels and limiting toxic by-products during discharge.
Value Chain Analysis
The value chain begins with chemical and materials inputs, including clean-agent chemistries, condensed aerosol compounds, cylinder steels and alloys, seals, and tubing. This is followed by subsystem manufacturing of detectors (IR/UV/thermal), control units and panels, valves, and nozzles. System integrators and specialist suppliers then package these into qualified automatic fire suppression systems, after which vehicle OEM integration adapts wiring harnesses, brackets, and nozzle geometry to engine bays, crew compartments, and, increasingly, battery cabinets. Defense standards typically influence qualification and acceptance, commonly including MIL-STD-810 for environmental performance and MIL-STD-461 for EMI/EMC, so test infrastructure and documentation become a material value-add.
Downstream demand is program-driven through defense procurement channels and prime contractors, with additional aftermarket pull from spares, cylinder refills, periodic agent replacement, and refurbishment of legacy fleets. The main bottlenecks are continuity in qualified-agent supply and vehicle-level integration workload, where CAN-bus and data-bus compatibility, cyber-hardening, and sensor-fusion tuning can determine installation hours. Localization and offset approaches, including domestic subsystem production partnerships, also affect sourcing decisions, lead times, and the ability to scale deliveries across multi-year modernization programs.
Competitive Landscape
Suppliers operate in a moderately fragmented arena where players like KIDDE-DEUGRA leverage RTX’s aerospace thermodynamics to offer cross-domain solutions, bundling common detection cores across ground, air, and naval fleets. Explospot Systems targets ammunition-cook-off risks with proprietary compound powder that suppresses blast overpressure alongside flame, addressing kinetic penetrator scenarios.
Technology differentiation outweighs price competition. Vendors winning large NATO or Indo-Pacific tenders typically prove seamless data-bus integration with APS radars and vehicle health management software, thus reducing cabling weight and installation hours. PFAS-free manufacturing competence emerged as a discriminator once Western agencies mandated fluorine-free agents, causing backlogs for firms still requiring recipes.
Patent filings gravitate toward predictive suppression, such as heat-sensitive conductors embedded within battery arrays that trigger isolation the instant resistance changes exceed preset thresholds. White-space exists in cloud-linked analytics that correlate vehicle telemetry with ambient weather, enabling fleet managers to schedule preventive maintenance when sensor drift indicates nozzle blockage or bottle pressure loss.
Armored Vehicle Fire Suppression Systems Industry Leaders
-
KIDDE-DEUGRA Brandschutzsysteme GmbH (RTX Corporation)
-
Firetrace International
-
Nero Industries Co.
-
Emerson Electric Co.
-
Marotta Controls, Inc.
- *Disclaimer: Major Players sorted in no particular order
Armored Vehicle Fire Suppression Systems Market Companies Covered in this Report
- KIDDE-DEUGRA Brandschutzsysteme GmbH (RTX Corporation)
- Nero Industries Co.
- Emerson Electric Co.
- Firetrace International
- Marotta Controls, Inc.
- Explospot Systems Pty Ltd.
- Mikro-Pulssi Oy
- N2 Towers
- Fire Safe Technologies LLP
- Jomarr Products, Inc.
- FirePro Systems Ltd.
- Fireaway Inc.
Read Analysis of Armored Vehicle Fire Suppression Systems Companies
Market Opportunities and Future Outlook
Near-term opportunities concentrate on sustainment and retrofit for fielded platforms, reinforced by June 2026 procurement activity from the US Army Contracting Command for specific fire extinguisher assemblies and valves tied to a qualified supplier base (including Kidde Technologies). This supports ongoing demand for certified parts, configuration control, and guaranteed interchangeability across vehicles already in service.
A second opportunity line focuses on integrated system design for next-generation platforms, particularly as electrification and higher onboard power densities shift hazard profiles. In May 2026, Heavy Vehicles Factory Avadi issued a tender for design and development of an Integrated Fire Detection and Suppression System for India’s Future Ready Combat Vehicle program, indicating demand for suppliers that can deliver integrated detection and suppression logic along with vehicle-network interfaces. Refurbishment programs also continue to sustain spend, including a 2026 UK Ministry of Defence contract for Foxhound Protected Mobility Vehicle fire suppression system refurbishment, which ties upgrade activity to evolving environmental and performance requirements.
Recent Industry Developments in Armored Vehicle Fire Suppression Systems Market
- June 2026: Kidde-Deugra (RTX Corporation) engaged in NATO interoperability work for armored vehicle fire protection systems, aligning with platform integration objectives highlighted at Eurosatory 2026 in Paris. This effort reinforces alignment with NATO requirements and supports ongoing integration across protected mobility fleets.
- March 2025: International Armored Group opened a BGN 20 million (USD 12.07 million) facility in Bulgaria to produce Guardian Xtreme MRAPs equipped with NATO-standard fire suppression suites. The expansion increases the installed base of factory-fitted suppression systems and supports downstream demand for spares, agent replenishment, and refurbishment services over vehicle life cycles.
- May 2024: FNSS displayed the PARS III 6x6 at DSA 2024 in Malaysia, highlighting a configuration supplied with standard automatic fire suppression systems. The demonstration underlined how OEMs are treating automatic suppression as a baseline survivability feature on new armored vehicle offerings, influencing specification norms in active procurement markets.
Armored Vehicle Fire Suppression Systems Market Report Scope and Research Methodology
Market Definition and Coverage
This market covers fire detection and fire suppression systems designed to be installed on armored vehicles, where fast fire sensing and agent discharge helps protect crews, passengers, and critical vehicle compartments.
Scope exclusions: Fire suppression used only in fixed facilities, warehouses, and general building protection is excluded from this market sizing.
Segments Covered in This Report
- By Vehicle Type
- Combat Vehicles
- Main Battle Tanks (MBTs)
- Infantry Fighting Vehicles (IFVs)
- Armored Personnel Carriers (APCs)
- Tactical Support Vehicles
- Other Vehicles
- Combat Vehicles
- By System Type
- Automatic/Autonomous
- Manual
- Hybrid
- By End User
- Military
- Law Enforcement
- By Component
- Detectors and Sensors
- Control Units and Panels
- Cylinders and Agents
- Nozzles, Valves, and Plumbing
- By Geography
- North America
- United States
- Canada
- Mexico
- Europe
- Germany
- United Kingdom
- France
- Italy
- Russia
- Rest of Europe
- Asia-Pacific
- China
- Japan
- India
- South Korea
- Australia
- Rest of Asia-Pacific
- South America
- Brazil
- Rest of South America
- Middle East and Africa
- Middle East
- United Arab Emirates
- Saudi Arabia
- Turkey
- Rest of Middle East
- Africa
- South Africa
- Rest of Africa
- Middle East
- North America
Data Sources, Market Sizing, and Validation
Desk Research
Desk work was used to set the demand context and make sure the market boundaries match how defense programs buy and integrate these systems. Public sources helped anchor vehicle fleet trends and procurement signals, including defense budget documents and procurement portals, NATO and allied publications, UN Comtrade trade statistics, SIPRI defense data summaries, and standards or safety references published by organizations such as NFPA.
We also reviewed supplier public materials such as annual reports, investor presentations, and contract press releases to understand product positioning, program timelines, and typical integration scope across the engine bay and crew compartment protection. Where needed, paid subscriptions for company financials and intelligence, news and financials, patent databases, and defense related market information were used to cross-check program activity and technology direction. The desk sources listed above are not exhaustive, and additional public references were used for data collection, validation, and clarification.
Primary Interviews and Surveys
Primary inputs were collected through expert discussions and structured surveys with defense procurement and sustainment stakeholders, vehicle platform integrators, subsystem engineers, and aftermarket service providers. For a global market view, feedback was balanced across APAC, EMEA, and the Americas so assumptions around fit rates, retrofit intensity, and pricing practices could be tested, then adjusted where regional procurement cycles differ.
Distribution of primary research fieldwork respondents
| Company type | Respondent position | Region |
|---|---|---|
| Top tier: 36% | CXOs: 12% | APAC: 45% |
| Mid tier: 42% | Functional/Unit leaders: 33% | EMEA: 37% |
| Smaller Players: 22% | Managers: 55% | Americas: 18% |
Market-Sizing & Forecasting
Sizing starts from a demand pool build-up where armored vehicle production, upgrade pipelines, and active fleet retrofit activity are translated into addressable system installations by region. From that base, the model applies practical fit rates for new vehicles versus upgrades, then maps the likely system count per vehicle, including protected compartments such as crew, engine, and auxiliary power areas, before value is calculated.
To keep totals realistic, results are corroborated with selective bottom-up approximations, such as supplier revenue splitting, sampled program quotes converted into average selling prices, and channel checks on retrofit kits and service contracts. Key inputs used in the model include new armored vehicle deliveries, fleet age and overhaul cycles, adoption of automatic detection and discharge, the shift toward halon alternatives driven by regulations, and observed pricing differences by vehicle class and protection level. For forecasting, scenario analysis was used, where procurement cycle timing and modernization intensity were varied, then the final path was aligned to the most common expectation shared by interviewed experts. Where direct visibility is limited, gaps are handled by using proxy vehicle platforms with similar protection architecture and then scaling by local procurement intensity.
Data Validation & Update Cycle
Model outputs are checked against independent signals such as announced vehicle orders, upgrade awards, and visible integration activity, and then reviewed for unusual jumps in volume or pricing that do not match program calendars. When a variance shows up, assumptions are re-tested through follow-up outreach, along with re-checking the underlying fleet and procurement inputs before sign-off.
Reports are refreshed annually, and interim updates are made when material events occur, including large multi-year vehicle awards, major retrofit campaigns, and major changes in extinguishing agent rules that can affect pricing and adoption. Before delivery, a final analyst pass is completed so the published numbers reflect the latest information available at that time.
Mordor Intelligence's Armored Vehicle Fire Suppression Systems Market Size Compared With Other Published Estimates
Published numbers for this market can look far apart because different studies count different installation points and different buyer pathways, then apply different pricing logic. Timing also differs, since defense awards often shift between planned, funded, and delivered stages across years.
The main gap comes from whether retrofit and sustainment related fire suppression purchases are counted as part of the market, or whether only new vehicle installations are included, which can change volumes quickly in years with heavy modernization. Some sources also blend broader firefighting equipment around armored platforms into one bucket, which inflates totals, and use fixed average prices that do not reflect higher pricing for multi-compartment systems and protected-agent storage. The estimate by Mordor Intelligence keeps scope focused on onboard armored vehicle fire suppression systems and values them using compartment-level fit logic tied to deliveries and retrofit cycles, then cross-checks against program signals and supplier disclosures.
Benchmark comparison
| Source | Market Size | Gaps in Research Methodology |
|---|---|---|
| Mordor Intelligence | USD 1.78 B (2026) | |
| Defense Industry Brief A | USD 1.52 B (2026) | Often emphasizes new vehicle integration and under-counts retrofit kits and recurring service driven replacements, which can reduce the addressable volume in upgrade-heavy fleets. |
| Trade Journal B | USD 2.10 B (2026) | Tends to bundle adjacent vehicle safety equipment and broader firefighting components into the same total, and may apply uniform average pricing without adjusting for multi-compartment protection and agent type shifts. |
The spread in the table mainly comes down to what is included around retrofit and service demand, and whether adjacent safety equipment is added into the same value pool. By tying value to clear vehicle activity drivers and practical installation assumptions, the estimate remains traceable and repeatable even when procurement timing shifts.
Key Questions Answered in the Report
What is the current value of the armored vehicle fire suppression systems market?
The market is valued at USD 1.78 billion in 2026 and is projected to grow to USD 2.47 billion by 2031, advancing at a 6.73% CAGR. .
Which segment holds the largest armored vehicle fire suppression systems market share?
Combat vehicles account for 49.12% of revenue, making them the dominant vehicle segment.
Why are PFAS-free agents important for future procurements?
Western militaries must eliminate PFAS foams by October 2026, so compliant agents unlock new contracts and avoid environmental liabilities.
Which region is expanding fastest?
Asia-Pacific leads with an 8.07% CAGR, fueled by Japan’s and China’s modernization budgets.
How quickly must modern automatic systems respond to a fire?
State-of-the-art autonomous units detect and discharge within 120-150 milliseconds, meeting NATO survivability benchmarks.
What technological trend could redefine the market in the long term?
Integration of AI-based predictive suppression with active protection systems promises to prevent ignition before flames emerge, creating a proactive survivability layer.