
Market Overview
| Study Period | 2020 - 2031 |
|---|---|
| Market Size (2026) | USD 32.12 Billion |
| Market Size (2031) | USD 42.18 Billion |
| Growth Rate (2026 - 2031) | 5.60 % |
| Fastest Growing Market | Asia-Pacific |
| Largest Market | Europe |
| Market Concentration | Medium |
Major Players *Disclaimer: Major Players sorted in no particular order Image © Mordor Intelligence. Reuse requires attribution under CC BY 4.0. | |
Armored Vehicles Market Analysis by Mordor Intelligence
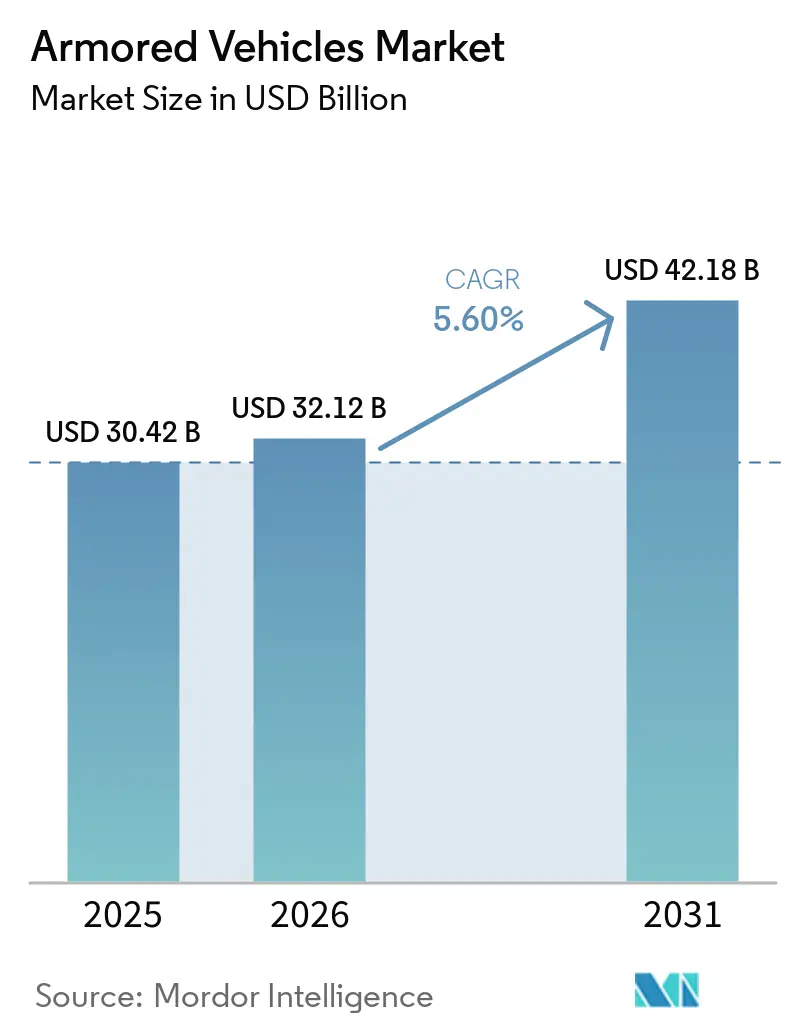
The armored vehicles market size is expected to grow from USD 30.42 billion in 2025 to USD 32.12 billion in 2026 and is forecast to reach USD 42.18 billion by 2031 at 5.6% CAGR over 2026-2031. The demand uptrend reflects intensified recapitalization programs across NATO, elevated procurement in the Asia-Pacific region, and a fast-rising interest in silent-watch electric variants that enhance survivability while reducing fuel burn. Germany’s decision to order 8,500 new vehicles, Poland’s rapid tank buys from South Korea, and India’s Future Infantry Combat Vehicle requirement illustrate how governments are shortening acquisition timelines and favoring modular designs that can be fielded quickly. Competitive rivalry escalates as primes pursue mega-contracts, such as the USD 45 billion XM30 program, and bolt-on acquisitions that shore up US supply-chain access and active-protection know-how. Supply-side friction remains, however, with rare-earth and armor-ceramic shortages slowing line-rate increases and prompting Western governments to subsidize domestic forging capacity.
Key Report Takeaways
- By platform type, infantry fighting vehicles (IFVs) held 34.12% of the armored vehicle market share in 2025, while armored personnel carriers (APCs) are projected to advance at a 6.95% CAGR to 2031.
- By mobility, wheeled systems commanded a 72.63% share of the armored vehicles market size in 2025, and tracked platforms are expected to expand at an 8.65% CAGR through 2031.
- By propulsion, conventional powertrains accounted for 71.58% of the armored vehicles market in 2025, whereas electric systems are forecasted to post a 8.92% CAGR between 2026 and 2031.
- By end-user, armies controlled 53.64% of the armored vehicles market share in 2025, and demand from special forces is projected to grow at an 8.19% CAGR through 2031.
- By geography, Europe led with a 42.41% revenue share in 2025, and the Asia-Pacific region is projected to grow at a 6.98% CAGR during the forecast period.
Note: Market size and forecast figures in this report are generated using Mordor Intelligence’s proprietary estimation framework, updated with the latest available data and insights as of 2026.
Global Armored Vehicles Market Trends and Insights
Drivers Impact Analysis*
| Driver | (~) % Impact on CAGR Forecast | Geographic Relevance | Impact Timeline |
|---|---|---|---|
| Rapid recapitalization programs in NATO and Asia | (+) 1.20% | North America and Europe, APAC core | Medium term (2-4 years) |
| Elevated land-warfare demand post-Ukraine conflict | (+) 1.00% | Global, concentrated in Europe and NATO allies | Short term (≤ 2 years) |
| Wheeled 8×8 platforms favored for expeditionary ops | (+) 0.80% | Global, particularly NATO and allied nations | Medium term (2-4 years) |
| Battlefield electrification and silent-watch capability | (+) 0.60% | North America and Europe, spill-over to APAC | Long term (≥ 4 years) |
| Modular active-protection system (APS) retrofits | (+) 0.70% | Global, concentrated in NATO and APAC | Medium term (2-4 years) |
| IFV surge to modernize combined-arms doctrine | (+) 0.50% | Global, early adoption in North America and Europe | Medium term (2-4 years) |
| Source: Mordor Intelligence | |||
Rapid Recapitalization Programs in NATO and Asia
NATO members inject a record amount of funds into their heavy-armor fleets, reversing three decades of drawdowns. Germany increased its defense spending to 5% of GDP and placed multi-billion-dollar orders for Boxer and Patria vehicles, which will reshape the European force structure. Poland directed USD 6.5 billion toward K2 tanks from South Korea to speed deliveries outside traditional Western channels. The Netherlands reactivated a tank battalion with 46 Leopard 2A8 units, highlighting how even former post-tank nations now regard tracked armor as indispensable. India’s Future Ready Combat Vehicle call for 1,770 platforms in Asia, combined with China’s ongoing Type 99A upgrades, signals a parallel surge in demand. The synchronized orders underpin a multi-year production boom that allows OEMs to amortize new welding halls, robotic paint lines, and modular digital-assembly tooling across global programs.
Elevated Land-Warfare Demand Post-Ukraine Conflict
The Ukraine war has affirmed the centrality of armored vehicles in peer warfare. Kyiv’s need for 23,000 vehicles demonstrated extreme battlefield burn rates, forcing NATO planners to audit inventories and accelerate backfill orders. Survivability gaps became clear, driving retrofits such as the USD 37 million Iron Fist APS award for US Bradley fleets after combat validation.[1] Once set at 10-15 years, procurement cycles are collapsing to 3-5 years, compelling primes to front-load production capacity and governments to accept incremental upgrades while full-rate lines are ramping up.
Wheeled 8×8 Platforms Favored for Expeditionary Operations
Strategic planners now favor wheeled 8×8 chassis for rapid theater shifts, eliminating the need for heavy-equipment transporters. Germany’s 5,000-unit Boxer framework order underscores the shift, with plug-and-play mission modules supporting infantry, command, and medical evacuation roles. Wheeled fleets deliver higher road speed and lower maintenance cost than tracked peers, attributes prized for dispersed Indo-Pacific operations. Survivability remains a focus after Ukraine revealed tire vulnerability, prompting the adoption of thicker appliqué armor, run-flat inserts, and APS integration as a standard fit across NATO programs.[2]
Battlefield Electrification and Silent-Watch Capability
Hybrid-electric drivetrains enable silent creep and persistent sensor watch without engine idle, reducing acoustic and thermal signatures. The US Army validated a 20% fuel-burn cut on its hybrid Bradley demonstrator while proving silent mobility in extended observation posts. GM Defense’s NGTV-H further adds exportable power for drones and jammers that demand stable onboard generation. Industry consensus aligns around hybrid bridges transitioning to full battery vehicles once energy density surpasses the 300 Wh/kg threshold, anticipated near the end of the forecast window.
Restraints Impact Analysis*
| Restraint | (~) % Impact on CAGR Forecast | Geographic Relevance | Impact Timeline |
|---|---|---|---|
| Ballooning unit costs and stretched defense budgets | -0.80% | Global, particularly acute in Europe and developing nations | Short term (≤ 2 years) |
| Industrial supply-chain chokepoints in armour ceramics | -0.60% | Global, concentrated impact in North America and Europe | Medium term (2-4 years) |
| ESG pressure against heavy carbon-footprint fleets | -0.40% | North America and Europe, limited impact in APAC and MEA | Long term (≥ 4 years) |
| Complex export-licensing/ITAR barriers | -0.30% | Global, most acute for cross-border programs | Medium term (2-4 years) |
| Source: Mordor Intelligence | |||
Ballooning Unit Costs and Stretched Defense Budgets
Modern armor platforms now cost well into eight figures. The M10 Booker price has climbed to USD 19 million per unit, while Germany’s Leopard 2A8 buy totals EUR 2.9 billion (USD 3.35 billion) for 105 tanks, squeezing even affluent treasuries.[3] The US Army’s 2025 force-structure reset cancelled multiple vehicle lines and trimmed Stryker orders to cap spending. Smaller nations are extending the service lives of their vehicles or sourcing surplus MRAPs, as Morocco did with 50 M-ATVs, thereby bypassing new-build queues. Rising interest rates and inflation compound affordability concerns, forcing ministries to trade off between airpower, drones, and ground-force recapitalization.
Industrial Supply-Chain Chokepoints in Armor Ceramics
Armor ceramics, rare-earth magnets, and high-strength forgings are subject to chronic shortages. The US forging sector has lost 241 plants since 2000 and now runs at 52% capacity, restricting hull and turret output pace. China refines the bulk of global rare earths, presenting a strategic chokepoint should geopolitical tensions escalate. European chemical supply disruptions threaten propellant coatings and fire-suppressant agents vital to crew-survivability systems.[4] Governments fund stockpiles and domestic mines, but the lead times of five years or more limit near-term relief.
*Our forecasts treat driver/restraint impacts as directional, not additive. The impact forecasts reflect baseline growth, mix effects, and variable interactions.
Segment Analysis
By Platform Type: IFV Dominance Drives Combined-Arms Evolution
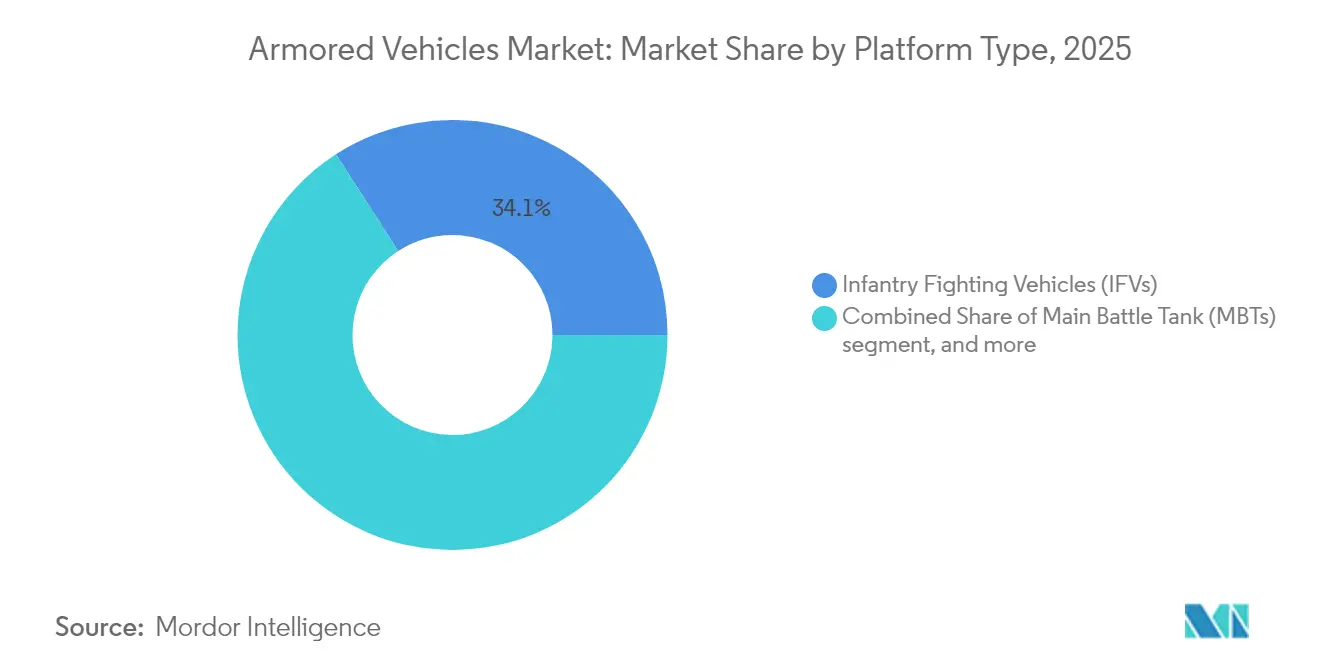
IFVs generated 34.12% of the armored vehicles market in 2025 and remain the centerpiece assets in mechanized brigades. Their balance of troop-carrying capacity and 30–50 mm cannons supports combined-arms tactics from the Baltic forests to the Indo-Pacific littorals. Nations are upgrading legacy fleets with situational-awareness suites and programmable airburst rounds that counter unmanned aerial targets. Supplier consolidation, such as Leonardo's takeover of Iveco Defence, is expected to streamline turret integration, steering the armored vehicle market toward a standard digital backbone.
APCs, including armored personnel carriers, are expanding at a 6.95% CAGR, fueled by lessons from Ukraine that stress troop protection over firepower. Lightweight MRAP designs with V-hulls and blast-attenuating seats are entering police special-operations arsenals, a spillover that diversifies revenue beyond defense ministries. MBTs are undergoing modernization rather than fleet growth, with active-protection kits and sensors extending the platform's relevance.Light reconnaissance vehicles capture niche demand for rapid-strike missions, integrating AI-powered crew aids that reduce operator workload.

By Mobility: Wheeled Platforms Reshape Strategic Doctrine
Wheeled designs held 72.63% of the armored vehicles market share in 2025, a dominance rooted in their ability to self-deploy over paved networks without tank transporters. NATO rapid-reaction brigades favor 8×8 chassis that cruise at highway speeds while offering scalable armor packages. The design trend in the armored vehicle market emphasizes independent suspension, run-flat tires, and central tire inflation to navigate mixed terrain.
Tracked platforms, though smaller in number, are rebounding at an 8.65% CAGR as armies relearn the need for cross-country mobility and heavy frontal protection against tandem-warhead threats. Modern tracks utilize segmented rubber composite pads that enhance road life while maintaining off-road traction. The hybrid fielding of both mobility types allows commanders to tailor task forces, a flexibility that underpins future doctrine.
By Propulsion: Electric Revolution Accelerates
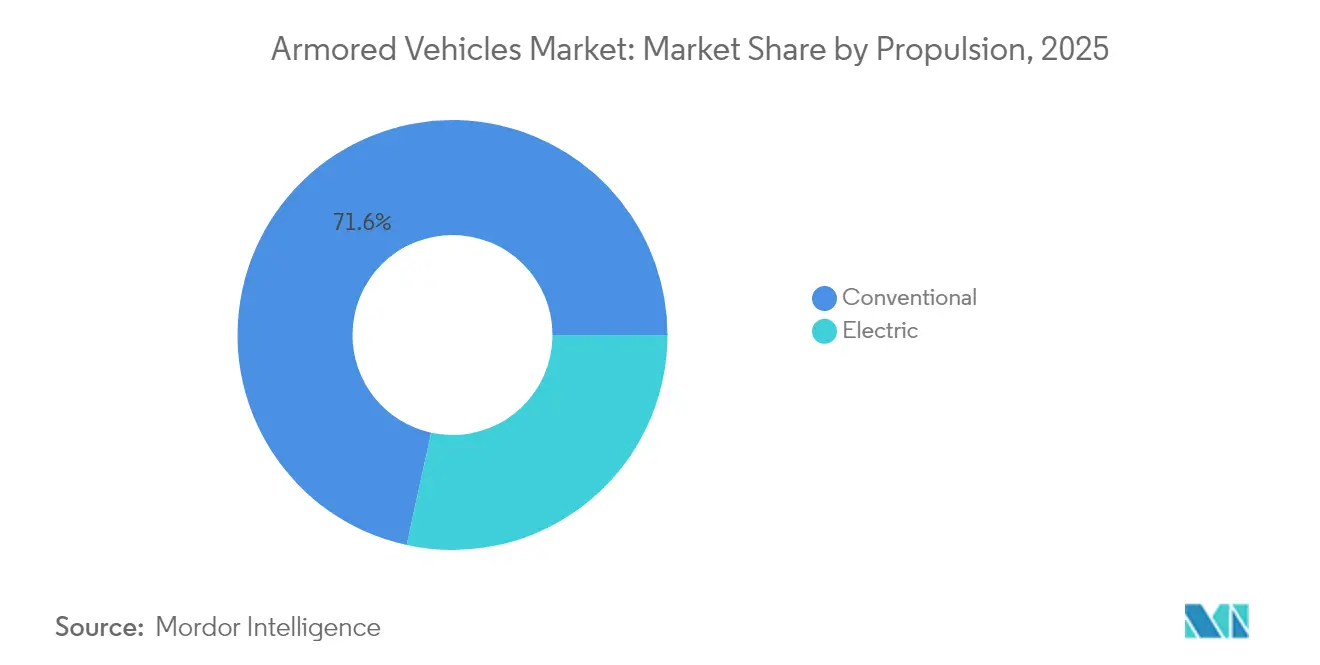
Conventional diesels still power 71.58% of the armored vehicles market, valued for their reliability and global fuel logistics. Yet electric propulsion is pacing the market at a 8.92% CAGR as silent-watch missions and carbon targets converge. Hybrid gensets that supply 300 kW of peak electric drive are already equipped on demonstrators and can be retrofitted to legacy hulls via drop-in power packs. The armored vehicle industry is investing in solid-state batteries and cooling loops capable of handling 100 °C desert environments, overcoming earlier thermal constraints. Charging infrastructure remains a barrier to expeditionary operations, limiting the adoption of fully electric vehicles to modest levels until theater micro-grid solutions mature.
By End-User: Army Dominance and Special Forces Surge
Army formations accounted for 53.64% of the armored vehicles market demand in 2025, outpacing other buyers, as the combined-arms doctrine relies on tanks, IFVs, and APCs in integrated task forces. Force-structure growth in Eastern Europe and Indo-Pacific border regions underwrites long-term baseline orders. Special forces are the fastest-growing segment, with an 8.19% CAGR, favoring lightweight platforms equipped with swarm-drone control consoles and signature-management coatings for clandestine raids. Marine and naval infantry procure amphibious combat vehicles that enhance mobility and survivability, as proven by the US Marine Corps’ first Indo-Pacific deployment in 2025.
Geography Analysis
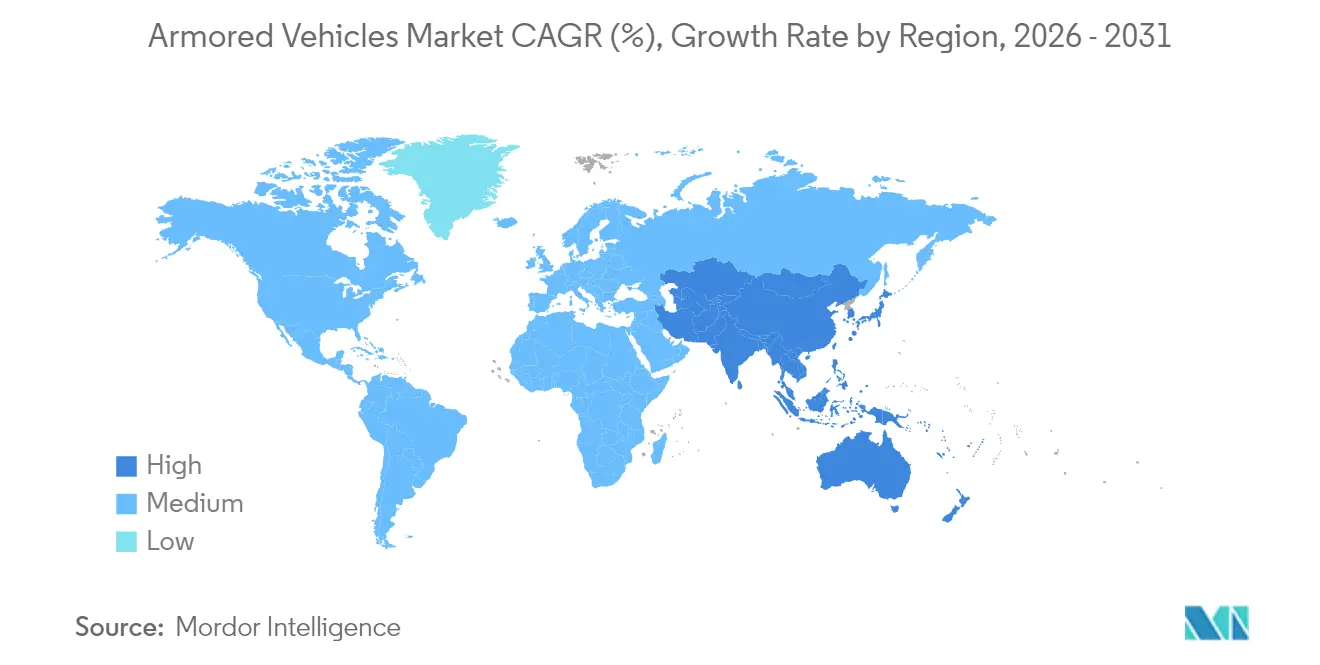
Europe accounted for 42.41% of the armored vehicles market revenue in 2025, driven by Germany’s record orders for the Boxer and Patria, as well as purchases from Nordic consortiums. Eastern members allocate more than 3% of GDP to defense, channeling funds to tracked fleets that bolster Article 5 deterrence. Western states emphasize wheeled fleets for out-of-area deployments, blending strategic lift economy with urban maneuverability.
Asia-Pacific follows as the fastest climber at a 6.98% CAGR. India’s Future Infantry Combat Vehicle tender for 1,750 units worth INR 600 billion (USD 7.2 billion) and China’s Type 99A progressive upgrades energize regional integrators. Japan explores wheeled modular chassis to supplement its Type 10 tank fleet, and Australia pivots to Land 400 Phase 3, reinforcing its infantry close-combat edge.
North America maintains steady modernization budgets, anchored by the XM30 and JLTV A2 programs, which incorporate AI mission cores and hybrid drivetrains. Canada backfills LAV 6.0 attrition losses with domestically produced variants, ensuring supply-chain sovereignty. Mexico invests in refurbished MRAPs for internal security, representing a small but steady aftermarket.
The Middle East allocated USD 78 billion in Saudi defense outlays for 2025, including prospective AyM 2030 armored formations tailored for desert warfare. Gulf buyers prefer high power-to-weight ratios for dune mobility and active cooling kits. Africa remains opportunistic, sourcing surplus vehicles via US Excess Defense Articles and refurb projects.
Regulatory Landscape
Armored vehicle procurement and cross-border sales are shaped by defense acquisition and export-control regimes that influence eligible suppliers, system architectures, and delivery schedules. In the United States, purchases typically route through the Federal Acquisition Regulation (FAR), while exports of armored vehicles and subsystems are controlled under International Traffic in Arms Regulations (ITAR) administered by the Directorate of Defense Trade Controls (DDTC), with selected dual-use components subject to Export Administration Regulations (EAR). In February 2026, the U.S. Army Request for Information for Ground Combat Vehicle Production treated modular open systems, cybersecurity, and supply-chain resilience as formal requirements rather than optional attributes.
In Europe, interoperability and protection standards continue to affect specifications and acceptance testing across multinational buys. The European Defence Agency (EDA) supports materiel standardization through EDSTAR and references NATO-aligned standards such as STANAG 4569 for protection levels and STANAG 4754 (NATO General Vehicle Architecture) for open-architecture vehicle integration. This framework influences how primes and subsystem suppliers qualify for pan-European programs and local-production arrangements.
Value Chain Analysis
The armored vehicles value chain starts with upstream materials and critical components, including armor-grade steel and ceramics, high-strength forgings, transmissions, and increasingly software-defined electronics and vetronics that support modular mission packages. Prime integrators and platform OEMs (including Rheinmetall, KNDS, BAE Systems Hagdunds, and General Dynamics Land Systems) coordinate design authority, systems integration, qualification, and final assembly, then transfer vehicles into government sustainment ecosystems for depot-level overhauls, spares, and upgrades such as active protection system (APS) retrofits.
Key constraints show up in sub-tier capacity and compliance-heavy cross-border flows, where long-lead items and single-source suppliers can slow line-rate increases, and export controls add documentation, classification, and licensing steps for internationally sourced subsystems. Recent large European orders with local participation requirements also show manufacturing and sustainment moving closer to end users; Romania signed an agreement in May 2026 for 298 Lynx KF41 IFVs under a broader modernization package, and Lithuania approved the purchase of 936 Patria 6x6 armored vehicles with in-country production conditions. Security-assistance deliveries similarly shape downstream activity, such as Textron Systems' USD 163.4 million award in January 2026 to deliver 65 COMMANDO Select vehicles to Ukraine, reinforcing the role of government-funded contracting pathways in accelerating deliveries outside traditional multi-year recapitalization cycles.
Competitive Landscape
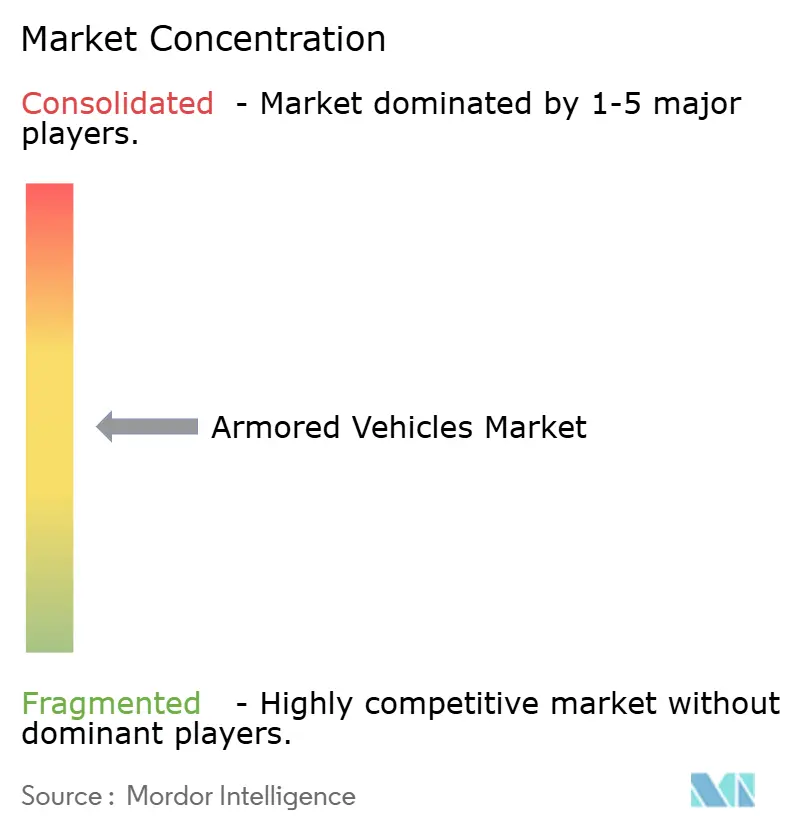
The armored vehicles market exhibits moderate concentration, with the top five suppliers accounting for a significant global revenue share. General Dynamics, Rheinmetall, KMW, BAE Systems, and Leonardo anchor this tier and battle for the USD 45 billion XM30 program, which could significantly swing their share. M&A momentum is reshaping capabilities; Rheinmetall’s USD 950 million acquisition of Loc Performance secures transmission expertise and a US manufacturing footprint. Leonardo’s EUR 1.70 billion (USD 1.96 billion) integration of Iveco Defence creates an Italian land-systems leader capable of bidding as prime on European Tank Main Ground Combat System (MGCS) efforts.
Tier-two entrants specialize in electric propulsion, APS, and autonomy, siphoning sub-system revenues from primes. GM Defense partners with battery start-ups, and Raytheon prototypes virtual crew assistants that could slash manpower needs by 30%. Supply-chain resilience is now a key competitive metric; OEMs are realigning their strategies toward dual-sourcing of armor ceramic lines and investing in domestic rare-earth magnet production facilities.
Joint-venture structures proliferate to localize content, meeting offset rules in Greece, Indonesia, and Brazil while tapping lower labor costs. These partnerships complicate ITAR compliance but grant market entry where single-nation primes lack incumbent status.
Armored Vehicles Industry Leaders
-
Rheinmetall AG
-
General Dynamics Corporation
-
BAE Systems plc
-
Oshkosh Corporation
-
KNDS N.V.
- *Disclaimer: Major Players sorted in no particular order
Market Opportunities and Future Outlook
Opportunities are clustering around industrial capacity expansion, localized production, and open-architecture upgrades that enable faster integration of sensors, turrets, counter-UAS effectors, and APS across mixed fleets. Actions in 2026 reflect a shift from demand signaling to capacity execution, including Rheinmetall's USD 41 million investment across U.S. facilities (Michigan, Ohio, and Maine) to expand production linked to XM30-related work, and the U.S. Army reporting progress on Organic Industrial Base transformation, including robotic welding systems supporting M1 Abrams-related production work at Anniston Army Depot. These steps create headroom for tooling, automation, qualification testing, and scaling of sub-tier components where supply-chain constraints have been visible.
Procurement patterns also point to opportunities in multinational commonality and in accelerated recapitalization for Eastern Europe and partner nations using grant or security-assistance mechanisms. Romania's package for Rheinmetall, which includes 298 Lynx combat vehicles, and Moldova's framework to procure over 100 Roshel armored vehicles financed by a EUR 50 million European Union grant, both underline demand for platforms that can be fielded quickly along with supporting integration and sustainment. Alongside this, formal budget lines for new-generation platforms create additional whitespace for digital backbones and survivability kits, with the U.S. Army budgeting for XM30 procurement quantities in forward-year planning and reinforcing pull for modular open systems architectures and cybersecurity-ready mission systems that can be sustained through iterative upgrades.
Recent Industry Developments
- June 2026: Romania awarded it a 5.7 billion euro defense contract package that includes 298 Lynx combat vehicles alongside Skyranger air defense systems. The award expands Rheinmetall's footprint in Eastern Europe and supports a longer-duration local industrial participation pathway tied to fleet recapitalization and sustainment demand.
- May 2026: General Dynamics Land Systems received a USD 229.7 million contract to produce 50 Stryker Double V-Hull A1 vehicles for the U.S. Army, with work running through June 30, 2028. The order extends production continuity for the in-service platform while keeping upgrade and spares ecosystems active for wheeled armored fleets.
- April 2026: General Dynamics Land Systems was awarded a USD 450 million agreement by the U.S. Marine Corps for the pre-production development phase of the Advanced Reconnaissance Vehicle program. The contract advances prototype integration, mission-systems architecture, and survivability tradeoffs ahead of downselect decisions, pulling suppliers into a broader collaboration and enabling readiness for potential later production.
Research Methodology Framework and Report Scope
Market Definition and Coverage
For this methodology, the armored fighting vehicles market is counted as the value of new-build and major upgrade procurement of protected combat and combat-support ground vehicles used by defense and security forces across major regions.
Scope exclusions: We exclude routine maintenance, spares-only purchases, and small ancillary items that are not part of an armored vehicle procurement or a formal modernization program.
Segmentation Overview
- By Platform Type
- Armored Personnel Carriers (APCs)
- Infantry Fighting Vehicles (IFVs)
- Mine-Resistant Ambush-Protected (MRAP)
- Main Battle Tanks (MBTs)
- Light Protected/Recon Vehicles
- Others
- By Mobility
- Wheeled (4×4, 6×6, 8×8)
- Tracked
- By Propulsion
- Conventional
- Electric
- By End-User
- Army
- Marine/Naval Infantry
- Special Forces
- Homeland Security
- By Geography
- North America
- United States
- Canada
- Mexico
- Europe
- United Kingdom
- France
- Germany
- Russia
- Poland
- Rest of Europe
- Asia-Pacific
- China
- India
- Japan
- South Korea
- Australia
- Rest of Asia-Pacific
- South America
- Brazil
- Rest of South America
- Middle East and Africa
- Middle East
- Saudi Arabia
- United Arab Emirates
- Turkey
- Rest of Middle East
- Africa
- South Africa
- Rest of Africa
- Middle East
- North America
Data Sources, Market Sizing, and Validation
Desk Research
Desk work started with building a clean map of fleets, budget lines, and procurement intent, then tying it back to what is actually ordered and delivered. We relied on public defense budget books and national procurement portals where available, along with sources such as SIPRI, UN Comtrade, World Bank indicators, and congressional or parliamentary defense committee publications for context.
To keep assumptions realistic, we used vehicle program news, contract award notices, and company annual reports and investor presentations to cross-check timing, quantities, and upgrade scope. A paid subscription for news and company financials helped track contract activity and normalize disclosures, and patent databases were used selectively to understand technology directions that can affect upgrade rates and unit value. The sources listed above are illustrative, and we also reviewed other public documents and datasets to collect data, validate inputs, and clarify gaps.
Primary Interviews and Surveys
Primary conversations were used to pressure-test the desk view on what gets counted as a vehicle sale versus a subsystem refresh, and how often fleets are modernized in each region. We spoke with a mix of procurement-facing roles, integrator and component-side experts, and defense end users across APAC, EMEA, and the Americas, so assumptions on delivery schedules, pricing moves, and upgrade scope could be aligned to observed buying behavior.
Distribution of primary research fieldwork respondents
| Company type | Respondent position | Region |
|---|---|---|
| Top tier: 35% | CXOs: 14% | APAC: 40% |
| Mid tier: 43% | Functional/Unit leaders: 40% | EMEA: 36% |
| Smaller Players: 22% | Managers: 46% | Americas: 24% |
Market-Sizing & Forecasting
Sizing used a top-down and bottom-up approach, where defense procurement spending and platform mix by region were reconstructed into an armored vehicle demand pool, then checked against selective build-ups from known program volumes and typical unit values. Because deliveries can lag awards, we aligned the model to expected production and delivery schedules rather than only headline contract announcements.
Key inputs included defense budget trends, planned fleet recapitalization and modernization cycles, tracked versus wheeled mix, the share of new platforms versus mid-life upgrades, and observable shifts in propulsion and protection requirements that tend to change average prices. Where program-level detail was incomplete, gaps were handled through category averages (by vehicle type and mobility), which were re-checked in interviews and then adjusted when a region showed a clear deviation.
For forecasting, scenario analysis was used, with a base case anchored to expected procurement calendars and budget signals, followed by an upside and downside that reflect how quickly awards convert to deliveries and how upgrade content expands. The final trajectory was reviewed against expert expectations on lead times, industrial capacity constraints, and the pace of modernization in priority theaters.
Data Validation & Update Cycle
Outputs were validated by comparing implied vehicle unit values, regional shares, and growth rates against independent signals such as defense budget direction, observed contract cadence, and known delivery pipelines. When a segment produced an outlier result, we re-opened the assumptions behind quantities, upgrade content, and price progression, then rechecked with at least one additional source before sign-off.
We follow a multi-step internal review so totals and segment splits stay consistent with the stated market definition and time base. Reports are refreshed annually, and interim updates are made when major awards, conflicts, or procurement policy shifts materially change demand. Before delivery, we run a fresh update pass so clients receive the most current view that can be supported by evidence.
Mordor Intelligence's Armored Fighting Vehicles Market Size Measured Against Other Published Estimates
Published market sizes for armored fighting vehicles can vary widely because each publisher draws the line differently on what counts as a vehicle market and how multi-year defense programs are time-phased into annual value.
The main gap comes from whether figures include broader armored vehicle spending and support activity, and then how contract value is spread across years in a simplified way. In Mordor Intelligence's model, value is counted when procurement and major modernization spending is tied to AFV platforms and expected delivery timing, which keeps the total aligned to program schedules rather than announcement headlines.
Benchmark comparison
| Source | Market Size | Gaps in Research Methodology |
|---|---|---|
| Mordor Intelligence | USD 30.42 B (2025) | |
| Trade Publisher A | USD 32.41 B (2024) | Uses a broader armored vehicle framing that can include additional support and adjacent vehicle categories, and the year basis differs, which shifts the comparable total even before forecasting assumptions are applied. |
| Industry Publisher B | USD 19.02 B (2024) | Applies a narrower AFV definition and a longer forecast window, and it can understate value if upgrades, electronic content, and delivery phasing for large programs are treated conservatively. |
The spread is mainly explained by scope and timing choices, not by a single data point. By keeping the counted spend tied to AFV procurement and modernization programs and then matching it to expected delivery cadence, the estimate stays traceable to clear variables that can be reviewed and repeated.
Key Questions Answered in the Report
What is the armored vehicles market size in 2026 and how fast will it grow through 2031?
The armored vehicles market is valued at USD 32.12 billion in 2026 and is projected to climb at a 5.6% CAGR, reaching USD 42.18 billion by 2031.
Which region currently generates the highest share of armored vehicle sales?
Europe leads with 42.41% of global revenue in 2025.
Which region is expected to record the quickest expansion?
Asia-Pacific is set to advance at a 6.98% CAGR between 2026 and 2031.
How dominant are wheeled armored vehicles compared with tracked variants?
Wheeled platforms commanded 72.63% of 2025 revenues, reflecting preference for rapid self-deployability.
Who buys the most armored vehicles by end user?
Army formations account for 53.64% of global purchases in 2025.
What is the growth outlook for Armored Personnel Carriers?
Armored Personnel Carriers (APCs) are projected to increase at a 6.95% CAGR through 2031.
Which technology segment shows the highest projected CAGR?
Electric propulsion tops the field with a 8.92% CAGR, driven by silent-watch and fuel-efficiency benefits.