
Market Overview
| Study Period | 2021 - 2031 |
|---|---|
| Forecast Data Period | 2026 - 2031 |
| Base Year Market Size (2025) | 45.82 gigawatt |
| Market Volume (2026) | 47.09 gigawatt |
| Market Volume (2031) | 54.03 gigawatt |
| Growth Rate (2026 - 2031) | 2.78 % |
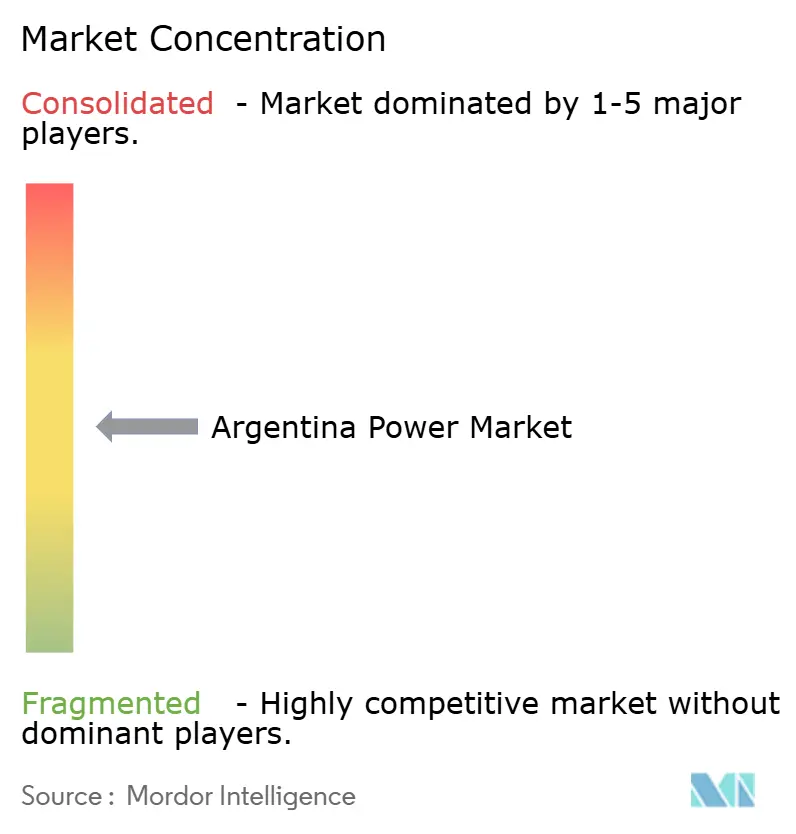
| Market Concentration | Medium |
Major Players *Disclaimer: Major Players sorted in no particular order Image © Mordor Intelligence. Reuse requires attribution under CC BY 4.0. | |
Argentina Power Market Analysis by Mordor Intelligence
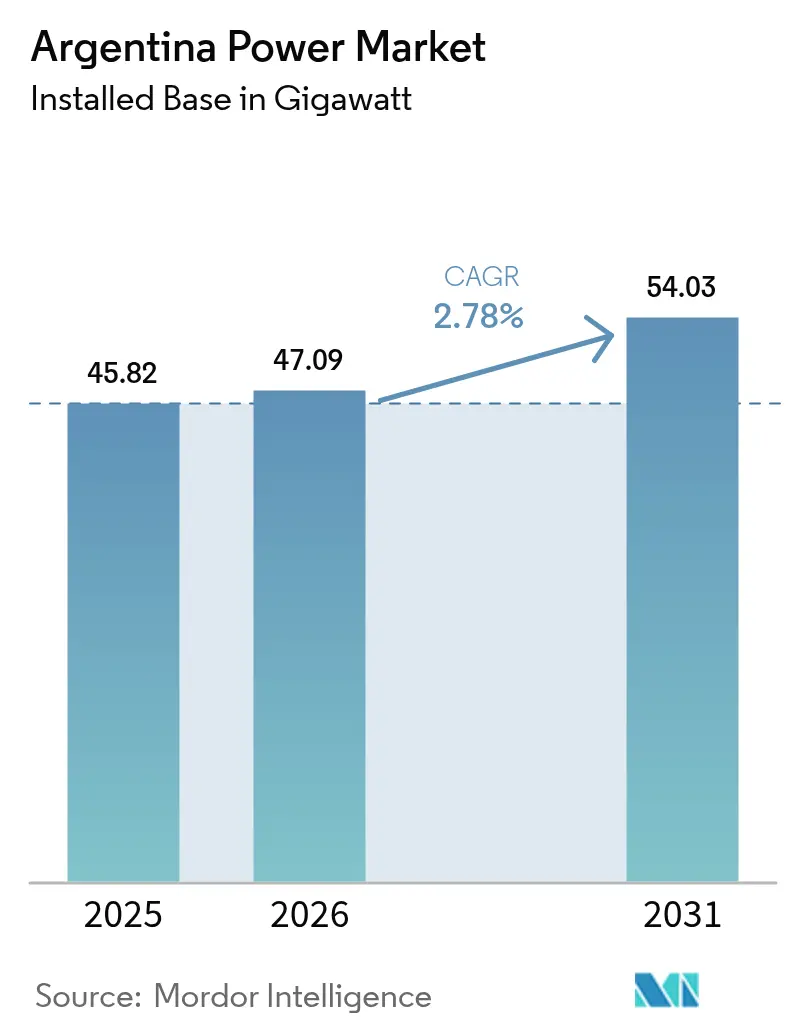
Argentina Power Market size in 2026 is estimated at 47.09 gigawatt, growing from 2025 value of 45.82 gigawatt with 2031 projections showing 54.03 gigawatt, growing at 2.78% CAGR over 2026-2031.
Argentina Power Market expansion is unfolding as President Javier Milei’s tariff reforms shift electricity pricing away from heavy subsidies, while abundant Vaca Muerta gas supplies, a 20% clean energy mandate for 2025, and USD 12 billion in multilateral grid-modernisation support converge to reshape investment flows. A sustained inflow of foreign capital, stricter local-content rules under the third Renovar auction, and growing corporate demand from mining and agro-industrial customers are accelerating renewable additions even as gas-fired plants remain the mainstay of baseload supply. Rising industrial activity in Buenos Aires and the lithium triangle lifts overall demand, yet hydropower drought risks, currency volatility, and transmission congestion still temper the outlook. Private developers are therefore pairing renewables with storage and distributed generation to manage curtailment risk and grid stress while investors pursue acquisition opportunities in a sector moving toward gradual consolidation.
Key Report Takeaways
- By power source, thermal held 56.15% of the Argentine power market share in 2025; nuclear is forecast to expand at 10.4% CAGR through 2031.
- By end-user type, the utilities segment accounted for 59.70% of the Argentine power market size in 2025, while the commercial and industrial segment is projected to advance at a 5.3% CAGR to 2031.
Note: Market size and forecast figures in this report are generated using Mordor Intelligence’s proprietary estimation framework, updated with the latest available data and insights as of 2026.
Argentina Power Market Trends and Insights
Drivers Impact Analysis*
| Driver | (~) % Impact on CAGR Forecast | Geographic Relevance | Impact Timeline |
|---|---|---|---|
| Government Renovar auctions accelerating renewables | 0.80% | National, concentrated in Patagonia, Jujuy, Salta | Medium term (2-4 years) |
| Low-cost gas from Vaca Muerta basin improving plant load factors | 0.60% | National, strongest in Buenos Aires and Neuquén | Short term (≤ 2 years) |
| Multilateral-funded grid modernization projects | 0.40% | Priority corridors: Patagonia-Buenos Aires, Cuyo-Litoral | Long term (≥ 4 years) |
| Industrial rebound lifting electricity demand | 0.50% | Greater Buenos Aires, Córdoba, Santa Fe | Short term (≤ 2 years) |
| Behind-the-meter solar uptake in agro-industrial estates | 0.30% | Pampas, Mendoza, Tucumán | Medium term (2-4 years) |
| Mining-sector corporate PPAs in the Lithium Triangle | 0.40% | Jujuy, Salta, Catamarca | Medium term (2-4 years) |
| Source: Mordor Intelligence | |||
Government “Renovar” Auctions Accelerating Renewables
The third Renovar round targets 400 MW and continues a shift toward competitive tenders that delivered sub-USD 50/MWh solar tariffs.(1)Renewables Now, “Argentina Launches Renovar 3.0 Auction,” renewablesnow.comRecent 373 MW additions in 2024 and a projected 700 MW in 2025 underscore steady progress. Enhanced local-content rules, grid-integration protocols, and the RIGI incentive regime have already unlocked USD 11.8 billion in private bids. Genneia’s 90 MW solar plant and a USD 240 million wind investment illustrate the growing scale of domestic commitments, though success hinges on transmission upgrades backed by the World Bank’s USD 12 billion support package.
Low-Cost Gas from Vaca Muerta Basin Improving Plant Load Factors
Record production of 400,000 bpd in Q3 2024 and a 1 million bpd target for 2030 reposition Vaca Muerta as a cornerstone of Argentina's power market economics. The USD 2.5 billion Vaca Muerta Sur pipeline channels gas to demand hubs, reducing costly LNG imports and lifting thermal capacity factors. YPF's partnership with Eni on floating LNG ensures flexible volumes that can pivot to domestic generators during peak demand.(2)Offshore Magazine, “YPF and Eni Advance Argentina LNG,” offshore-mag.com Natural-gas output averaged 5 Bcf/d in September 2024, with Vaca Muerta contributing more than 70%.
Multilateral-Funded Grid Modernisation Projects
A USD 12 billion World Bank package and IFC’s USD 5.5 billion private-sector window target transmission, storage, and smart-grid upgrades. Central Puerto’s USD 600 million line to north-west mining sites demonstrates how concessional finance aligns with renewable growth and industrial demand. The 2024-2050 transmission plan prioritises high-voltage links and storage integration, directly addressing the curtailment challenges that have constrained Patagonia wind projects.
Industrial Rebound Lifting Electricity Demand
Manufacturing output recovered in 2024 as access to foreign currency improved, raising power demand in Buenos Aires, Córdoba, and Santa Fe. Lithium producers such as Ganfeng’s Mariana project in Salta installed a dedicated 28 MW plant to power an annual 20,000-ton lithium carbonate output. Petrochemical and steel players benefit from cheaper gas feedstocks, while corporate PPAs anchor long-term renewable offtake. Tariff normalisation, however, saw Buenos Aires rates rise 268% in 2024, prompting efficiency upgrades and on-site generation.
Restraints Impact Analysis*
| Restraint | (~) % Impact on CAGR Forecast | Geographic Relevance | Impact Timeline |
|---|---|---|---|
| Macroeconomic volatility and currency risk | -0.50% | Import-dependent projects nationwide | Short term (≤ 2 years) |
| Transmission congestion curtailing renewables | -0.40% | Patagonia-Buenos Aires, Cuyo-Litoral | Medium term (2-4 years) |
| Paraná-basin drought reducing hydro output | -0.30% | Litoral provinces, binational Yacyretá | Short term (≤ 2 years) |
| Community opposition to large Patagonia hydro projects | -0.20% | Santa Cruz province | Long term (≥ 4 years) |
| Source: Mordor Intelligence | |||
Macroeconomic Volatility & Currency Risk
The peso’s 50% December 2023 devaluation raised financing costs and squeezed project cash flows. A USD 2 billion payment backlog at system operator CAMMESA tightens liquidity, even with revised 60-day settlement terms. RIGI offers 30-year tax stability for projects above USD 200 million, yet import restrictions and exchange-rate gaps still push equipment costs 30% higher year on year. World Bank credit lines partly buffer currency risk, but developers remain exposed to further peso losses.
Transmission Congestion Curtailing Renewables
Patagonia wind farms and northern solar arrays often out-generate local demand, forcing curtailment when export capacity is full. The March 2025 heatwave left 620,000 Buenos Aires customers without power and highlighted grid fragility. Resolution 906/2023 creates a framework for battery energy storage to smooth dispatch, while the 2024-2050 plan schedules high-voltage links that would move surplus renewables to load centres.(3)Mercopress, “Heatwave Triggers Buenos Aires Blackout,” mercopress.com Implementation lags, however, keep curtailment a medium-term restraint.
*Our forecasts treat driver/restraint impacts as directional, not additive. The impact forecasts reflect baseline growth, mix effects, and variable interactions.
Segment Analysis
By Power Source: Gas Anchors Today, Nuclear Bets on Tomorrow
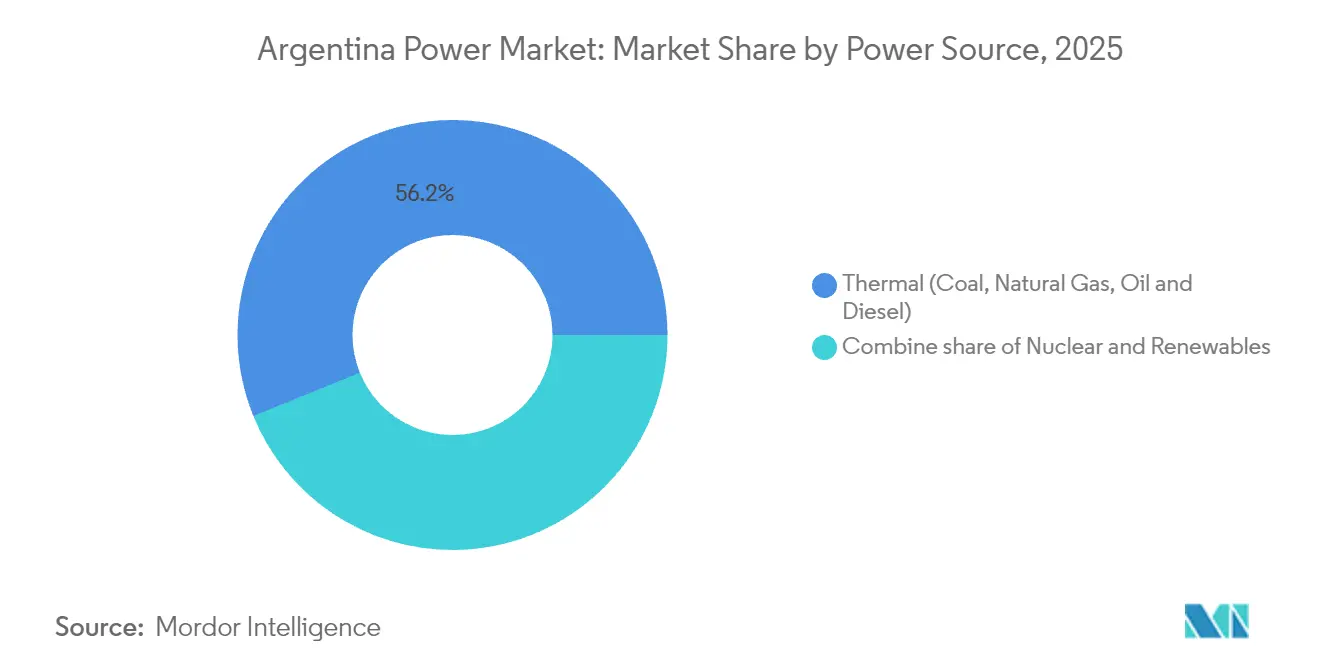
Thermal assets dominated at 56.15% of installed capacity in 2025, confirming gas as the linchpin of present-day supply. This slice equates to 25.73 GW within the Argentina power market size, underpinned by Vaca Muerta feedstock that has displaced LNG imports. Nuclear contributes less than 4% now, yet is poised for a 10.4% CAGR, the fastest pace among all sources, driven by the 32 MW CAREM25 small modular reactor scheduled for 2027 and Chinese-backed life extensions at Atucha I and Embalse. Renewables are accelerating, yet the 15% curtailment of Patagonian wind in 2024 underscores integration hurdles.
Vaca Muerta economics continue to sustain combined-cycle repowerings, including Pampa Energía’s USD 350 million Genelba expansion slated for 2026. Solar capacity in Jujuy rose by 300 MW to serve lithium extraction, while hydro output dropped sharply amid drought, revealing the weather-dependency of legacy assets. The segmentation shows a dual narrative: thermal plants are being optimized for abundant domestic gas, whereas capital for long-life decarbonization is split between baseload nuclear and faster-to-build but grid-constrained renewables.


By End User: Utilities Still Rule, C&I Redraws Boundaries
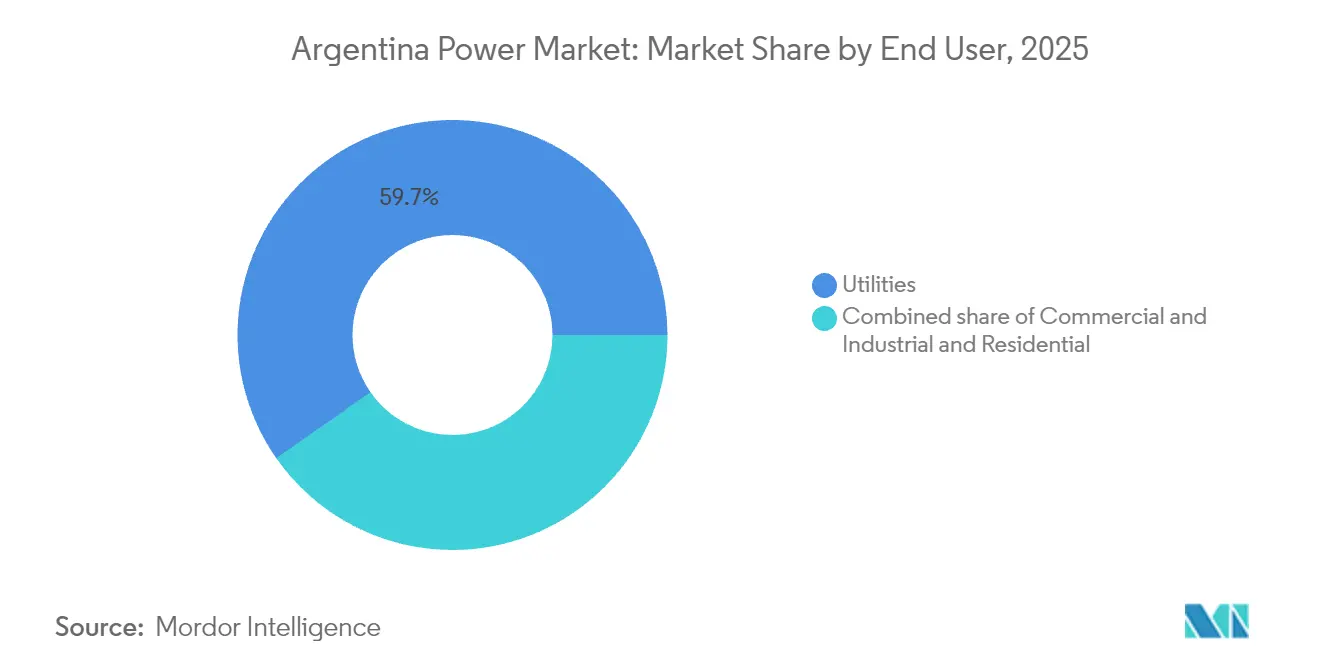
Utilities retained a 59.70% footprint in the 2025 Argentina power market, equal to 27.35 GW of the Argentina power market size under CAMMESA’s centralized dispatch model. However, the C&I segment is forecast to grow 5.3% annually to 2031, riding on lithium-sector PPAs and agro-industrial solar that sidestep tariff risk. Mining companies alone signed offtake deals for 320 MW of clean capacity in 2024, insulating operations from peso volatility.
Subsidy rollbacks lifted residential tariffs by 300% in nominal terms during 2024, causing payment arrears and highlighting inequitable exposure to cost recovery. Developers favor creditworthy miners and exporters, leaving households to bear rising grid charges, a regulatory gap that could deepen social fissures. The Argentine power market demands updated cross-subsidy frameworks to balance self-generation benefits against communal system costs.
Geography Analysis
Regional dynamics strongly influence the Argentine power market. Buenos Aires and the surrounding provinces dominate consumption yet rely on distant resource hubs for supply. The March 2025 blackout, which affected 620,000 customers, underlined the need for stronger high-voltage links. Upgrading transmission will help move wind and solar from Patagonia and the north into this main load centre, reducing curtailment and improving resilience.
Patagonia hosts the country’s best wind regime, with capacity factors above 50%. Projects such as Verano Energy’s 200 MW solar array demonstrate rising solar interest as panel costs fall. Transmission, however, remains a bottleneck until the planned extra-high-voltage corridor is complete. The Argentina power market size for renewable projects in Patagonia is forecast to reach 9.65 GW by 2031, though timely grid expansion will determine actual realisation rates.
Northern provinces, Salta, Jujuy, and Catamarca, form the lithium triangle. Mining expansion translates into rapid power-demand growth. Ganfeng’s Mariana plant requires 28 MW of captive capacity, and Rio Tinto’s USD 2.5 billion project will need a similar supply once operational. Solar irradiation levels support competitive photovoltaic projects, while new transmission lines extend grid reach to remote sites. Hydropower potential, concentrated in the northeast, faces climate-driven variability, with the IEA projecting 15%-28% output declines by the end of the century.
Regulatory Landscape
Argentina’s power sector framework is anchored in Law No. 24.065 (electricity) and Law No. 15.336, with dispatch and settlement centralized through CAMMESA in the Wholesale Electricity Market (MEM). Policy direction in the current cycle emphasizes tariff normalization and a reduced role for generalized subsidies, aiming to align remuneration more closely with supply costs while keeping regulated oversight of distribution and transmission concessions.
Recent regulatory actions include Decree No. 450/2025, which amended core electricity laws to promote investment in transmission, a key constraint for renewable evacuation from Patagonia and northern solar regions. On market rules, Resolution 400/2025 (Secretaria de Energia, November 2025) set out measures for normalization and progressive adaptation of the MEM. Separately, the transition to the merged Ente Nacional Regulador del Gas y la Electricidad (ENReGE, created by Law No. 27.742) consolidates regulatory functions previously split between ENRE and ENARGAS. By June 2026, new distribution tariff structures were implemented for EDESUR S.A., effective June 1, 2026 under Secretaria de Energia resolutions.
Competitive Landscape
The Argentine power market features moderate fragmentation. The top four companies hold about 33% of installed capacity, creating room for new entrants and acquisitions. Foreign investors announced USD 8.9 billion across 99 deals in 2024, and energy accounted for 70% of the transaction value. Pampa Energía balances participation in the Vaca Muerta Sur pipeline with renewable additions, committing USD 1.5 billion to unconventional gas that feeds domestic generators.
Genneia leads private renewable deployment, commissioning 90 MW of solar and investing USD 240 million in wind. AES Argentina is expanding the Vientos Bonaerenses complex by 102.4 MW. Central Puerto leverages a USD 600 million IFC facility to build transmission that unlocks new demand nodes. Technology adoption focuses on battery storage and advanced controls required by Resolution 906/2023, aligning with domestic lithium availability.
Strategic alliances grow in importance. YPF and Eni are progressing toward an LNG final investment decision that would monetise surplus Vaca Muerta gas, while Wärtsilä secured a three-year operations agreement for a lithium-mine power plant in Salta. Distributed generation and corporate PPAs give industrial users direct procurement options, and mining firms increasingly develop captive systems, adding competitive pressure on traditional utilities.
Argentina Power Industry Leaders
Pampa Energia SA
AES Argentina Generación SA
YPF Luz
Enel SpA
Edenor SA
- *Disclaimer: Major Players sorted in no particular order

Market Opportunities and Future Outlook
Transmission-linked renewable buildout and large C&I procurement create near-term whitespace in Argentina’s generation and grid ecosystem, particularly where curtailment and congestion limit dispatch. The March 2026 IFC-backed financing for PCR’s 185.6 MW Olavarria wind farm, paired with expansion on the Bahia Blanca-Abasto transmission corridor under the RIGI incentive framework, offers a tangible reference point for privately financed generation combined with grid capacity. That combination improves bankability for additional wind and solar projects seeking firmer market access.
Corporate-led renewable demand in industrial hubs and resource provinces is translating into visible pipeline progress across registry and commissioning milestones. In Chubut, Aluar completed installation of 56 wind turbines for the 336 MW La Flecha wind farm in June 2026 and moved into technical verification ahead of commercial operation, reinforcing the role of large self-supply and contracted offtake in Patagonia. On the merchant and contract market side, Genneia advanced wholesale participation steps in July 2026 by submitting the 300 MW Sol del Valle solar project in Catamarca to the renewable registry (Renper) and registering the 118 MW Los Sabios I stage II wind project in Buenos Aires province, signaling continued use of the MEM access and project-registration pathway to secure dispatch, PPAs, and financing. In hydro, Resolution 19/2026 (January 2026) set participation conditions in the MEM tied to the concession process for major complexes (Alicura, Piedra del Aguila, Cerros Colorados, and El Chocon), opening near-term opportunities around operational upgrades, contract structures, and ancillary services alongside thermal optimization from domestic gas supply.
Recent Industry Developments
- July 2026: YPF Luz filed to list shares in the United States, advancing an IPO process linked to expanding its capital access. The filing supports financing flexibility for the company’s buildout across renewables and flexibility assets within Argentina.
- April 2026: Pampa Energia placed USD 200 million of Class 27 corporate notes with a 36-month tenor and a 5.49% annual interest rate. The issuance strengthens Pampa Energia’s funding capacity for its generation and infrastructure investments amid a shifting tariff and wholesale-market normalization environment.
- June 2025: YPF and Eni formalized agreements for the Argentina LNG (ARGLNG) project targeting 12 Mtpa using FLNG units to monetize Vaca Muerta gas. Progress on LNG export infrastructure underpins upstream development and expands optionality for domestic gas supply dynamics that influence thermal generation economics.


Research Methodology Framework and Report Scope
Market Definition and Coverage
For this report, the market is defined as Argentina's electricity supply system measured by installed power generation capacity, covering grid connected plants across major fuel types and the demand side groups that purchase power.
Scope exclusions: Generation equipment manufacturing and detailed transmission and distribution asset spending are not counted in the market size totals.
Segmentation Overview
- By Power Source
- Thermal (Coal, Natural Gas, Oil and Diesel)
- Nuclear
- Renewables (Solar, Wind, Hydro, Geothermal, Biomass & Waste, Tidal)
- By End User
- Utilities
- Commercial and Industrial
- Residential
- By T&D Voltage Level (Qualitative Analysis only)
- High-Voltage Transmission (Above 230 kV)
- Sub-Transmission (69 to 161 kV)
- Medium-Voltage Distribution (13.2 to 34.5 kV)
- Low-Voltage Distribution (Up to 1 kV)
Data Sources, Market Sizing, and Validation
Desk Research
Desk research was used to set the structure of the model and to anchor the big public data series that explain how Argentina's power system is changing. We typically start with official generation capacity and production data, then cross-check it against policy targets and grid level updates to avoid mixing announced projects with operating assets.
Public sources that were referenced include materials such as Argentina's national energy statistics and regulatory publications, ISO or grid operator releases on installed capacity and dispatch, IEA and World Bank electricity indicators, and IRENA renewable capacity trackers. To fill gaps and align definitions, we also reviewed company annual reports and presentations, utility and generator press releases, association websites, and reputed local business press. Where needed, a paid subscription for company financials and intelligence and a patent database were used to confirm project ownership changes and technology additions. The desk sources listed here are illustrative only, and many other public documents were also used for data collection, validation, and clarification.
Primary Interviews and Surveys
Primary work focused on validating what is actually operating, what is under construction, and what has a realistic commissioning date, because that is where public project lists can be noisy. We spoke with a mix of power producers, utilities and large buyers, engineering and operations leaders, and sector advisors across Argentina, and then used their inputs to test assumptions like capacity factors, retirement timing, and technology mix shifts.
Distribution of primary research fieldwork respondents
| Company type | Respondent position |
|---|---|
| Top tier: 29% | CXOs: 22% |
| Mid tier: 49% | Functional/Unit leaders: 29% |
| Smaller Players: 22% | Managers: 49% |
Market-Sizing & Forecasting
Sizing starts from a top-down reconstruction of the installed capacity base by technology using official capacity tables and grid disclosures, which are then aligned to the study period and cleaned for re-powered units and retirements. After that, a selective bottom-up check is done using a sampled roll-up of known operating plants and typical unit sizes, along with channel checks on commissioning progress, so totals can be adjusted where public records lag.
Key model inputs include installed capacity additions and retirements, technology mix shares (thermal, nuclear, and renewables), plant commissioning timelines, average utilization assumptions that influence how much capacity is economically retained, and demand signals such as electricity consumption and industrial load recovery. When data is missing for smaller plants, we interpolate using technology level averages and recent build patterns, and then validate that the implied totals still match national aggregates.
For forecasting, we mainly use scenario analysis supported by time series smoothing on the historical capacity trend, and then we stress-test the output against expert views on grid constraints, policy enforcement, and project financing conditions. This keeps the forecast explainable on a client call and also makes the assumptions easy to update when new capacity lists are published.
Data Validation & Update Cycle
Before sign-off, outputs are triangulated against independent signals such as publicly reported capacity totals, generation mix splits, and major project commissioning announcements, and any large variance is investigated before it is accepted. If a change looks material, we re-contact industry participants to confirm whether it is a reporting timing issue, a definition mismatch, or a real market shift.
A multi-step internal review is followed, including checks for year-on-year jumps, technology shares that drift away from known policy or grid limits, and unit consistency across all tables. The report is refreshed annually, and interim updates are made when major events occur, such as policy revisions, large plant outages, or delayed grid connections. Right before delivery, an analyst completes a final pass so clients receive the most current view available.
Mordor Intelligence's Argentina Power Market Size Compared With Other Published Estimates
Published market sizes for Argentina power often do not line up because the word "power" can mean very different things depending on what is being counted, and whether the estimate is built in value terms or in system capacity terms. Differences also show up when some publishers include only a slice of the value chain, or when they rely on project pipelines without filtering for realistic commissioning.
Some external figures are reported as spending or revenue pools around grid infrastructure, and some even label a small value number as the whole power market. In contrast, Mordor Intelligence counts installed generation capacity in gigawatts and keeps transmission and distribution spend outside the market total, which changes the number and the unit by design.
Benchmark comparison
| Source | Market Size | Gaps in Research Methodology |
|---|---|---|
| Mordor Intelligence | USD 45.82 B (2025) | |
| Regional Consultancy A | USD 12.49 M (2024) | This figure appears to be a narrowly defined value estimate in USD for a subset of the sector, and it is not comparable to installed capacity based sizing, so the unit choice and scope create a very different headline. |
| Industry Publisher B | USD 1.84 B (2025) | This estimate focuses on transmission and distribution as an infrastructure market, which expands or shifts the scope away from generation capacity, and the outcome is a value pool rather than a power system capacity total. |
The spread in the table is mostly explained by unit choice and what parts of the electricity value chain are included. By keeping the model tied to traceable capacity additions, retirements, and confirmed commissioning, the sizing stays repeatable and easier to reconcile with official system totals even when other publications choose a different scope.


Key Questions Answered in the Report
What is the forecast installed capacity for Argentina in 2031?
Installed capacity is expected to reach 54.03 GW by 2031, implying a 2.78% CAGR from the 2026 base.
Which segment is growing fastest within generation sources?
Nuclear is projected to expand at a 10.4% CAGR, the quickest growth rate among all generation types.
How large is the share of thermal generation today?
Thermal generation accounts for 56.15% of installed capacity, making it the dominant source in 2025.
Why are corporate PPAs significant in Argentina?
They give miners and industrial users tariff certainty and bypass peso volatility, accelerating dedicated renewable projects.
What is causing renewable curtailment in Patagonia?
A constrained 500-kV corridor limits transfers to Buenos Aires, curtailing about 15% of wind output until new lines arrive in 2027.
How is currency risk affecting new projects?
Peso depreciation and inflation inflate financing costs and have triggered force-majeure claims on several wind equipment contracts.
Page last updated on:


 Your data is secure and never sold or shared.


