
Market Overview
| Study Period | 2020 - 2031 |
|---|---|
| Market Size (2026) | USD 390.12 Billion |
| Market Size (2031) | USD 505.03 Billion |
| Growth Rate (2026 - 2031) | 5.30% CAGR |
| Fastest Growing Market | Asia Pacific |
| Largest Market | North America |
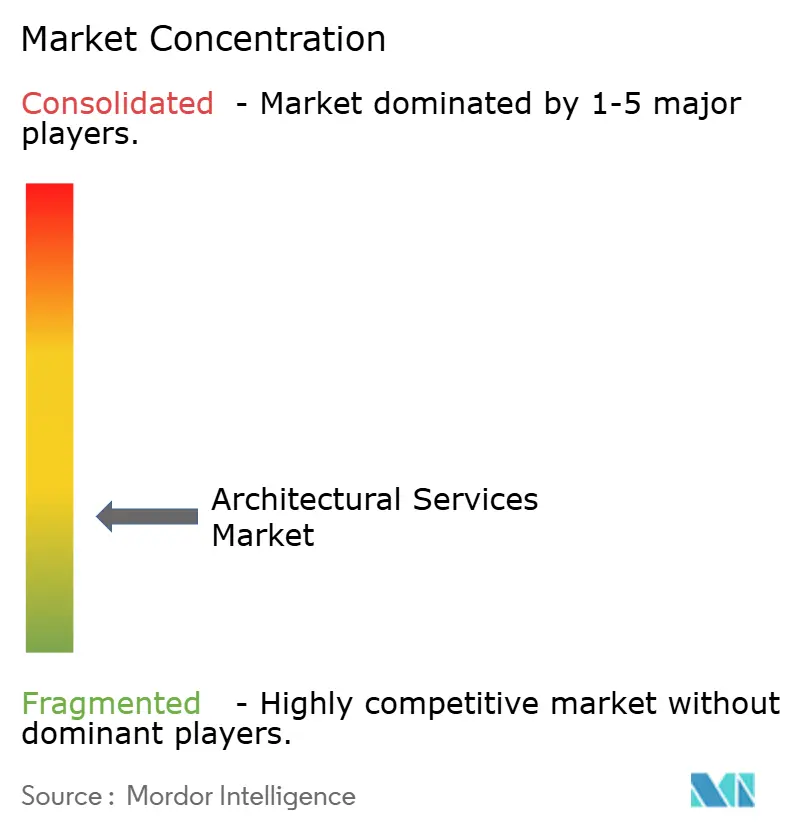
| Market Concentration | Low |
Major Players *Disclaimer: Major Players sorted in no particular order Image © Mordor Intelligence. Reuse requires attribution under CC BY 4.0. | |
Architectural Services Market Analysis by Mordor Intelligence
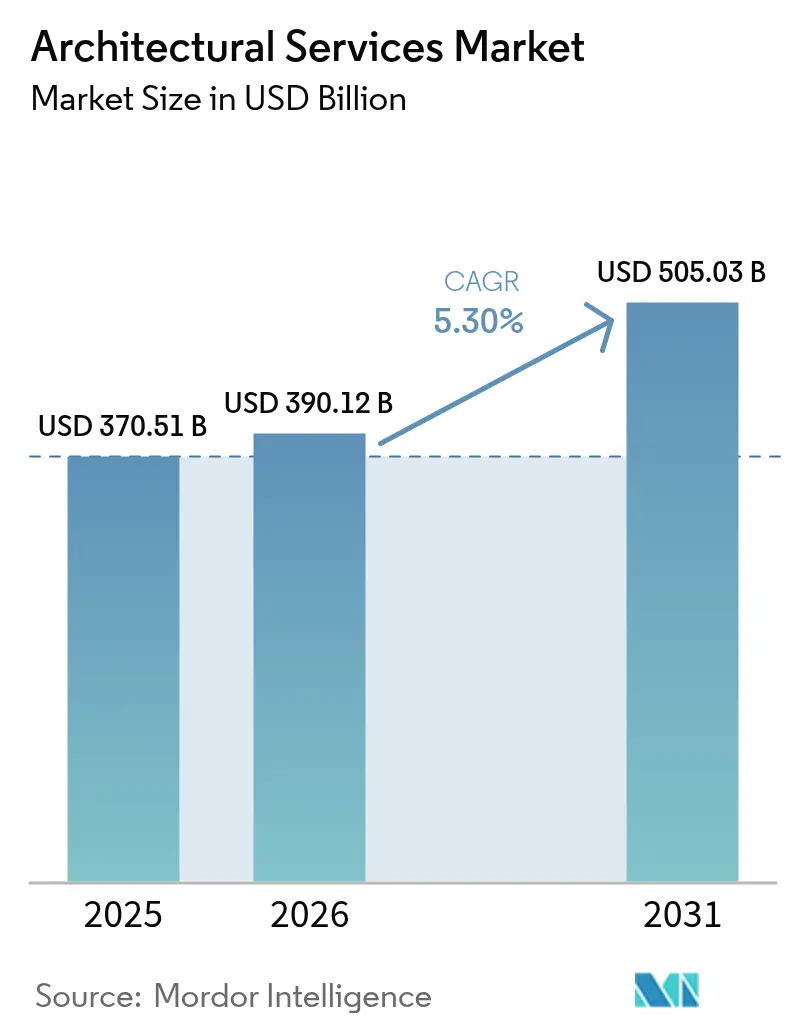
The architectural services market size was valued at USD 370.51 billion in 2025 and estimated to grow from USD 390.12 billion in 2026 to reach USD 505.03 billion by 2031, at a CAGR of 5.30% during the forecast period (2026-2031). Post-pandemic infrastructure outlays, a surge in smart-city programs, and growing sustainability mandates anchor this expansion, while artificial intelligence (AI) and digital-twin platforms improve project speed and accuracy. North America keeps its revenue lead through federally funded transport, power, and water upgrades, yet Asia Pacific produces the steepest growth curve as governments commit large-scale capital to meet urban housing and mobility gaps. Across all regions, heightened client focus on carbon neutrality and operational resilience pushes firms toward low-embodied-carbon materials, net-zero design targets, and climate-risk scoring. Competitive intensity rises as global firms acquire niche specialists to secure multidisciplinary talent and to widen local regulatory expertise. Meanwhile, rising wages and volatile input costs pressure margins, prompting broader use of automation for repetitive documentation and early-stage massing studies.
Key Report Takeaways
- By service type, Design and Documentation commanded 40.92% of the architectural services market share in 2025, while Urban Planning and Master-planning is projected to expand at a 6.28% CAGR through 2031.
- By end user, residential projects accounted for 34.21% of the architectural services market size in 2025; industrial and manufacturing is poised for the fastest growth at 6.12% CAGR to 2031.
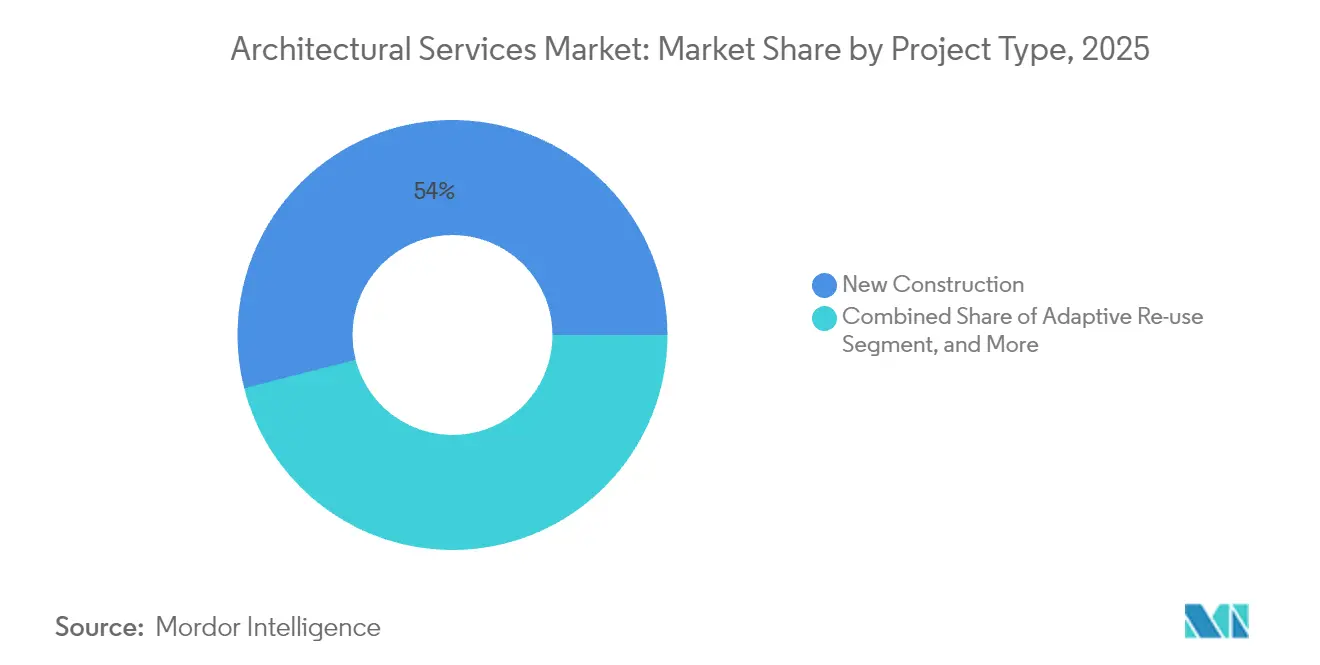
- By project type, new construction held 53.98% of the architectural services market share in 2025, whereas adaptive reuse is set to advance at a 5.98% CAGR during 2026-2031.
- By BIM adoption level, Level 1 workflows represented 54.72% of the architectural services market size in 2025, with Level 3+ integrated environments forecast to grow at 6.29% CAGR through 2031.
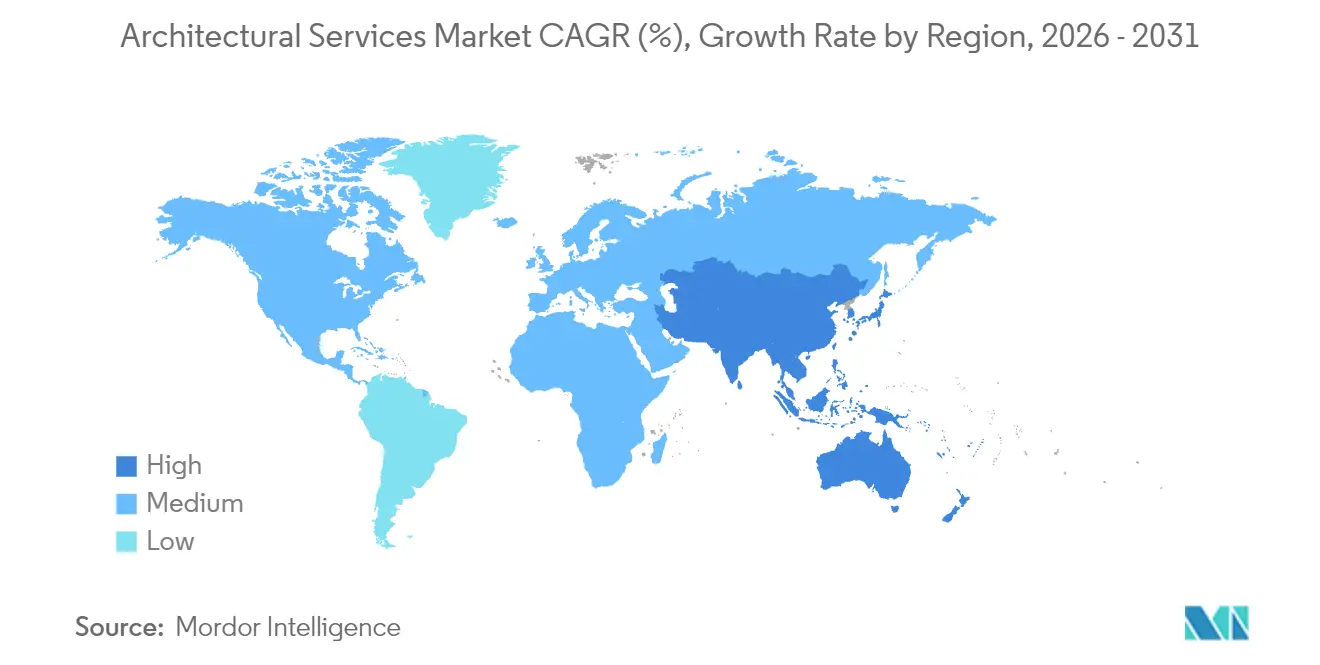
- By region, North America led with 39.14% revenue share in 2025 and Asia Pacific is projected to realize the strongest regional CAGR of 6.07% to 2031
Note: Market size and forecast figures in this report are generated using Mordor Intelligence’s proprietary estimation framework, updated with the latest available data and insights as of 2026.
Global Architectural Services Market Trends and Insights
Drivers Impact Analysis*
| Driver | (~) % Impact on CAGR Forecast | Geographic Relevance | Impact Timeline |
|---|---|---|---|
| Increasing demand for green buildings | +1.2% | Global, with early gains in California, EU, Singapore | Medium term (2-4 years) |
| Growing adoption of Building Information Modelling (BIM) | +0.9% | North America and EU core, spill-over to APAC | Long term (≥ 4 years) |
| Expansion of modular and prefabricated construction | +0.8% | APAC core, Middle East expansion | Short term (≤ 2 years) |
| Urban infrastructure spending rebound post-COVID-19 | +1.1% | Global, concentrated in APAC and North America | Medium term (2-4 years) |
| Generative-AI-driven concept design workflows | +0.7% | North America and EU early adoption | Long term (≥ 4 years) |
| Design-build-operate digital-twin subscription models | +0.6% | Global, with enterprise focus | Long term (≥ 4 years) |
| Source: Mordor Intelligence | |||


Increasing demand for green buildings drives market transformation
Mandatory sustainability codes such as California’s CALGreen and the International Green Construction Code enforce energy-, water-, and carbon-performance thresholds that now shape baseline client expectations.[1]California Building Standards Commission, “CALGreen,” dgs.ca.gov Global corporations link facility strategies to environmental, social, and governance (ESG) targets, rewarding firms that present costed net-zero pathways and cradle-to-cradle material schedules. As LEED v4 remains the dominant global certification, architects build internal capability in daylight simulation, whole-building life-cycle analysis, and renewable-energy integration.[2]U.S. Green Building Council, “LEED v4 for Building Design and Construction,” usgbc.org Fee premiums for verified green design offset rising labor and software costs, and project pipelines advance in healthcare, education, and logistics where net-zero metrics unlock cheaper finance.
Growing adoption of Building Information Modelling transforms project delivery
Singapore’s 90% BIM utilization demonstrates how coordinated 3D environments and design-for-manufacture principles shorten construction cycles and limit rework. Global market value for BIM software is projected to reach USD 22.1 billion by 2030 under a 16.3% CAGR, with advanced Level 3+ environments attracting the highest momentum. Natural-language Text2BIM agents streamline object creation and parameter tagging, curbing authoring time and lowering entry barriers for small studios. Set against this potential, firms cite acute shortages of mid-career BIM managers, intensifying recruitment costs and delaying complex multidisciplinary projects. Governments answer with mandatory BIM documentation on public buildings, accelerating demand despite transitional skill gaps.
Expansion of modular and prefabricated construction reshapes design practices
Permanent modular construction revenue in the Gulf Cooperation Council hit USD 3.4 billion in 2023 and is scaling further on the back of Saudi Vision 2030 megaprojects. Prefabricated and volumetric systems promise 30%-50% faster schedules and significant waste reductions under factory-controlled tolerances. Architect workflows now integrate manufacturing constraints-such as module size limits and robotic welding clearances-conceptually to secure regulatory approvals and site logistics. The Asia Pacific region leads in high-rise modular towers, with proof-of-concept projects exceeding 20 stories and demonstrating viable seismic and fire safety performance. Sustainability dividends arise from material optimization and reduced on-site crew travel, dovetailing with green-building incentives.
Generative-AI-driven concept design workflows enhance speed and creativity
More than half of surveyed construction professionals already apply AI to feasibility testing, zoning analysis, and quantity take-offs. Generative algorithms iterate thousands of massing and façade options against performance metrics, helping clients weigh daylight, structural efficiency, and cost within hours. Firms confirm productivity gains of up to 31% on schematic-design phases, freeing senior architects to focus on client interaction and code negotiation. Intellectual-property concerns and cyber-security risks remain, but early adopters gain a pricing edge, especially in build-to-rent residential and data-center briefs.
Restraints Impact Analysis*
| Restraint | (~) % Impact on CAGR Forecast | Geographic Relevance | Impact Timeline |
|---|---|---|---|
| Shortage of BIM-proficient architects | -0.8% | Global, acute in North America and EU | Medium term (2-4 years) |
| Volatile construction-material prices | -0.6% | Global, with regional variations | Short term (≤ 2 years) |
| Regulatory fragmentation across municipalities | -0.4% | North America and EU primarily | Long term (≥ 4 years) |
| Cyber-security risk in connected-building design files | -0.3% | Global, enterprise-focused markets | Medium term (2-4 years) |
| Source: Mordor Intelligence | |||
Shortage of BIM-proficient architects constrains market growth
Industry surveys show that 96% of design firms experience skills shortages, especially at intermediate BIM levels, forcing 51% of companies to decline new work. U.S. architecture services lost 1,300 jobs in November 2024, even as the wider construction sector must add 439,000 workers by 2025 to meet demand. Salaries for BIM coordinators have climbed faster than inflation, eroding profit margins. Companies fund internal academies and partner with universities, yet training cycles lag behind project timetables. AI-assisted modeling automates repetitive layout tasks but cannot replace human code interpretation, client liaison, or context-specific detailing, keeping skilled labor pivotal.
Regulatory fragmentation across municipalities creates compliance challenges
The 2024 International Building Code introduced sweeping revisions on energy storage and wind-borne debris, while local overlays differ in carbon-emission caps and accessibility provisions. Developers working across states face varying plan-check timelines, fee structures, and sustainability thresholds, complicating cost certainty. National Multifamily Housing Council research indicates that code variance can add double-digit percentage premiums to baseline construction budgets. Continuous updates require architects to track multiple amendment cycles, raising internal legal and documentation overheads. Digital-plan-review portals improve transparency, yet uneven adoption across jurisdictions sustains project-start risks.
*Our forecasts treat driver/restraint impacts as directional, not additive. The impact forecasts reflect baseline growth, mix effects, and variable interactions.
Segment Analysis
By Service Type: Design services retain scale while planning accelerates
Design and Documentation held 40.92% revenue in 2025, underlining their place as the indispensable core of every capital project. This dominance safeguards predictable fee flows because regulatory submittals mandate sealed drawings and specifications. The architectural services market size for Urban Planning and Master-planning is predicted to grow at a 6.28% CAGR, driven by new-town developments in India and rail-corridor rejuvenations in the United States. Municipalities demand advanced scenario modeling that blends land-use analytics, mobility forecasts, and green-infrastructure overlays, encouraging firms to expand GIS and socio-economic research teams. Interior and Space Planning keeps steady volume as hybrid workplaces and data-center suites require reconfigurable layouts that support well-being standards. Restoration and Conservation, although niche, rises on incentives for embodied-carbon retention and cultural-tourism value. Across every service, AI-assisted parametric templates speed code-compliant detailing, with pilot studies showing 31% document-production savings by 2030.
Project-management add-ons grow as owners favor single-contract design-build packaging to reduce risk. Stantec’s 2025 acquisition of Page exemplifies how multidisciplinary scope wins market share in advanced manufacturing and healthcare, sectors that prize integrated design-construction oversight. Firms also integrate digital-twin maintenance dashboards, transforming one-off contracts into recurring facilities-support subscriptions.


By End User: Housing scale meets industrial momentum
Residential schemes yielded 34.21% of 2025 billings as national housing deficits persist, ranging between 1.5 million and 7.3 million units in the United States alone. Yet tighter lending terms, higher mortgage rates, and land scarcity in core metros push architects toward middle-income multifamily, senior living, and build-to-rent platforms that promise predictable occupancy. Conversely, industrial and manufacturing inquiries surge at 6.12% CAGR through 2031 on reshoring of semiconductor fabs, battery plants, and cloud-computing data centers. These programs demand clean-room design, thermal-load balancing, and resilience audits against power interruptions, placing premium fees on specialist consultants.
Office pipelines remain subdued following hybrid-work adoption; however, adaptive reuse of under-occupied towers into life-science labs or residential lofts unlocks new revenue. Healthcare and education remain counter-cyclical mainstays; demographic aging sustains clinic and long-term-care expansion, while universities modernize research wings to compete for grants. Public-sector infrastructure, funded by multiyear appropriations, offers stable volume in transit, courthouse, and water-treatment segments, especially for firms versed in Davis-Bacon wage and Buy-America sourcing rules.
By Project Type: New builds dominate but reuse gains speed
New construction still accounts for 53.98% of architectural services market share due to relentless urbanization and large-scale manufacturing investments. In Asia Pacific, metro-rail stations, mixed-use superblocks, and logistics parks demand ground-up solutions. However, adaptive reuse projects register the highest growth at 5.98% CAGR as city councils favor carbon-saving refurbishments over demolition. Tax credits and expedited entitlements for repositioning heritage warehouses or mid-century offices lower carrying costs for developers. Renovation and retrofit pipelines likewise strengthen because commercial landlords seek energy-performance upgrades that satisfy incoming leasing-disclosure rules in New York City and London.
Heritage restoration garners cultural and tourism funding, such as the regeneration of industrial waterfronts into arts precincts. Architects balance original fabric conservation against modern accessibility and mechanical-electrical-plumbing integration, often using laser scan-to-BIM workflows for precision. Lifecycle carbon accounting now regularly ranks beside cost and aesthetics in briefing documents, steering materials selection toward recycled steel and mass timber where codes allow.
By BIM Adoption Level: Basic modeling cedes ground to integrated environments
Level 1 BIM environments, characterized by 3D modeling with minimal data linking, represented 54.72% of the architectural services market size in 2025. Adoption remains high because software entry costs are modest and model exchanges occur via traditional PDF outputs. Nonetheless, Level 3+ integrated data environments grow at 6.29% CAGR as owners pursue digital twins for facility management. Cloud platforms consolidate structural, environmental, and asset-tag information, enabling predictive maintenance and energy optimization without manual draw-downs.
Level 2 collaboration gains moderate ground where public procurers insist on federated models shared among architects, engineers, and contractors. Implementation barriers persist, chiefly training budgets, process re-engineering, and contractual risk allocation. Non-BIM or 2D-CAD usage continues its slide as insurers, lenders, and regulators deem manually coordinated sets prone to conflict. Overall, the architectural services market benefits from layered software revenue and consulting add-ons linked to BIM maturity journeys.
Geography Analysis
North America sustained 39.14% of global billings in 2025, buoyed by USD 1.2 trillion in federal infrastructure allocations that translate into sustained design spending across highways, rail, and flood-control systems. Mandatory BIM on federal buildings, stringent energy codes, and voluntary WELL and LEED commitments encourage high-fee technical consulting. Nevertheless, the Architecture Billings Index fell to 45.6 in January 2025, showing softness in private commercial work as higher interest rates defer speculative office and retail starts. Mergers such as Stantec-Page shore up geographic coverage and deepen advanced manufacturing competencies to capture reshoring demand.
Asia Pacific delivers the fastest regional CAGR at 6.07% through 2031 on back of USD 1.7 trillion average annual infrastructure needs.Southeast Asian economies attract industrial plant designs due to competitive labor and export-zone incentives, while India’s smart-city program accelerates metro-station and affordable-housing tenders. Singapore’s 90% BIM penetration sets a regional benchmark, with governments in Malaysia and Indonesia launching similar mandates. In the Gulf, sovereign wealth-funded giga-projects spur modular high-rise adoption and data-center clusters, opening opportunities for mission-critical designers.
Europe posts steady gains under rigorous decarbonization policies. The European Union’s Renovation Wave strategy seeds pipeline certainty for deep-energy retrofits, while cultural preservation funding supports restoration specialists. Diverse code bases complicate cross-border delivery, yet pan-EU digital-twin research consortia promote standardization. South America and Africa remain smaller contributors but grow off low bases as urbanization and private-equity investment in logistics and renewable energy schemes widen design scope.

Regulatory Landscape
Regulation of architectural services is shaped by professional licensure, public-procurement rules, and building-code compliance, with additional barriers from cross-border restrictions reflected in intergovernmental frameworks such as the OECD Services Trade Restrictiveness Index and the WTO guidance for architecture services. Municipal and national overlays continue to drive uneven permitting and documentation requirements, and the 2024 International Building Code revisions (including updates tied to energy storage and wind-borne debris) add to an ongoing cycle of local amendments that global firms must track to keep sealed submittals compliant.
Regulators are also digitizing approvals and compliance workflows, moving plan review closer to BIM-native checking. Singapore made CORENET X mandatory for large projects in October 2025, which accelerated automated, model-based submissions, while the United Kingdoms Ministry of Housing, Communities and Local Government opened a January 2026 consultation to streamline building control for telecommunications work in higher-risk buildings. Sector-specific scrutiny is increasing for high-impact asset classes such as data centers, including a March 2026 US proposal for a temporary moratorium on new data center construction, which raises the need for documented environmental and grid-impact responses within architectural briefs and permitting packages.
Competitive Landscape
Market concentration is moderate. The top 5 global firms account for roughly 22% of revenue, leaving room for regional champions and boutique specialists. Stantec’s USD 546.2 million acquisition of Page propels combined revenue above USD 1.3 billion and doubles its Texas footprint. Gensler leads with USD 1.83 billion, leveraging workplace strategy and data-center depth to defend share. Perkins&Will and HKS pursue healthcare innovation hubs and university laboratories, respectively, while bolstering AI-powered design teams.
Technology differentiation intensifies. Over 52% of construction professionals already deploy AI in project management, and leading firms embed custom language models into Revit and Rhino environments for automatic code checks. Digital-twin subscriptions secure multiyear engagements; clients pay monthly for asset performance dashboards, sensor calibration, and regulatory reporting. Private-equity capital continues to roll up mid-sized practices, exemplified by MG2’s merger with Colliers Engineering, driving economies of scale in back-office systems and software licensing.
Firms visualize whitespace in adaptive reuse, net-zero retrofits, and mass-timber commercial buildings. Client selection criteria now weigh cyber-security posture, favoring practices that certify to ISO 27001 and deploy secure common-data environments. Geographic diversification protects against local downturns; for example, North America-based firms open delivery hubs in Vietnam and the Philippines to cover time-zone gaps and lower production costs.
Architectural Services Industry Leaders
IBI Group Inc.
Aedas Ltd.
AECOM
HDR Architecture Inc.
Gensler Design and Planning Inc.
- *Disclaimer: Major Players sorted in no particular order

Market Opportunities and Future Outlook
Whitespace is expanding in compliance-led, BIM-centered delivery where owners and authorities want model-based evidence rather than drawing-only submissions. That direction is supported by mandatory digital submission pathways in some jurisdictions, including Singapores CORENET X requirement for large projects, and by research momentum around automated code checking that links BIM objects to machine-readable rules. For architects, this creates room to package higher-value compliance analysis, audit trails, and faster re-submittal support alongside core Design and Documentation services, which held 40.92% share in 2025. It also supports platform-style offerings around secure common data environments and cyber-hardened file handling, aligning with enterprise concerns about connected-building design files.
A second opportunity cluster sits at the intersection of infrastructure spending, mission-critical facilities, and lifecycle services. North America has visible multi-year public programs, including USD 1.2 trillion in federal infrastructure allocations cited in the report context, and large buyers increasingly bundle multi-discipline scopes into multi-task contracts that reward scale and repeatable delivery. Recent federal awards to major providers for nationwide critical infrastructure modernization and large-ceiling IDIQ vehicles show continuing demand for architecture-led planning, design management, and digital-twin handover requirements, which can extend engagement beyond one-time design fees into longer-running operations support and performance reporting work.
Recent Industry Developments
- June 2026: AECOM was selected by the US Department of Homeland Security to continue providing architecture and engineering services supporting critical infrastructure modernization nationwide. The award reinforces the role of large, multi-discipline firms in multi-year federal programs where compliance, security requirements, and rapid task-order execution shape vendor selection.
- March 2026: AECOM secured a position on the US Missile Defense Agencys SHIELD IDIQ contract with a USD 151 billion ceiling. This expands access to defense-led modernization work where integrated planning, facilities design, and program management capabilities translate into recurring task orders across multiple sites.
- March 2025: Stantec acquired Page for USD 546.2 million, strengthening its US architecture footprint and adding depth in advanced manufacturing and healthcare. The deal supports broader end-to-end offerings that combine design, documentation, and project management add-ons, and it intensifies consolidation pressure on mid-sized practices competing for specialized talent.


Research Methodology Framework and Report Scope
Market Definition and Coverage
The architectural services market is defined as revenue earned from professional architectural work delivered for building and infrastructure projects, starting from concept design and documentation through design development and construction stage support, across public and private clients.
Scope exclusions: This sizing excludes physical construction materials, contractor labor, and pure software licensing fees that are not billed as part of an architectural services contract.
Segmentation Overview
- By Service Type
- Design and Documentation
- Construction and Project Management
- Interior and Space Planning
- Urban Planning and Master-planning
- Restoration and Conservation
- By End User
- Residential
- Corporate / Commercial Offices
- Retail and Hospitality
- Healthcare
- Educational and Cultural
- Industrial and Manufacturing
- Public Infrastructure and Government
- Other End Users
- By Project Type
- New Construction
- Renovation and Retrofit
- Adaptive Re-use
- Heritage Restoration
- By BIM Adoption Level
- Non-BIM / 2D-CAD
- BIM Level 1 (3D Modelling)
- BIM Level 2 (Collaboration)
- BIM Level 3+ (Integrated Data Environment)
- By Geography
- North America
- United States
- Canada
- Mexico
- South America
- Brazil
- Argentina
- Chile
- Peru
- Rest of South America
- Europe
- Germany
- United Kingdom
- France
- Italy
- Spain
- Rest of Europe
- Asia-Pacific
- China
- Japan
- South Korea
- India
- Australia
- New Zealand
- Rest of Asia-Pacific
- Middle East and Africa
- Middle East
- United Arab Emirates
- Saudi Arabia
- Rest of Middle East
- Africa
- South Africa
- Nigeria
- Rest of Africa
- Middle East
- North America
Data Sources, Market Sizing, and Validation
Desk Research
Desk research was used to map the demand pool for architecture work and to anchor the model on construction activity and building stock changes. We reviewed public sources such as the US Census Bureau construction spending series, Eurostat construction indicators, the World Bank and IMF macro series, and national statistical offices that publish housing starts, permits, and floor area trends.
To refine assumptions, we also used materials from planning and building authorities, green building and energy-code references, and public procurement portals that show tender volumes and project types. Company filings, annual reports, and investor presentations were used to understand service mix and fee behavior across different geographies, and a paid subscription for company financials and news helped validate revenue direction and major contract wins. These examples are not exhaustive, and many other public sources were also referenced for data collection, cross-checks, and clarification.
Primary Interviews and Surveys
Primary work focused on confirming how architecture fees move with project size, design scope, and local procurement norms, and then testing the share of work tied to new build versus renovation. We spoke with a spread of firms, independent practitioners, and buyers such as developers and public agencies across major regions, so gaps from desk research could be closed and key assumptions rechecked before finalizing the model.
Distribution of primary research fieldwork respondents
| Company type | Respondent position | Region |
|---|---|---|
| Top tier: 27% | CXOs: 18% | APAC: 46% |
| Mid tier: 53% | Functional/Unit leaders: 31% | EMEA: 34% |
| Smaller Players: 20% | Managers: 51% | Americas: 20% |
Market-Sizing & Forecasting
Sizing was built using a top-down approach where construction output, building permits, and renovation intensity were used to reconstruct the annual addressable pool of design work, then converted into service revenue using typical fee ranges by project type. To keep the figures practical, we treated the market as fees earned for architectural deliverables and design support, then separated out adjacent items that are often billed outside architecture contracts.
The model used inputs that are easy to track and update, such as new construction starts, retrofit and renovation activity, non-residential project pipelines, urbanization and office or retail build trends, and the share of projects adopting higher levels of BIM workflows. Once the market total was produced, it was corroborated using selective bottom-up approximations such as sampled firm revenue checks, service mix splits, and simple ASP-to-volume logic for a small set of representative project categories. Where direct values were not available, gaps were handled by using proxy fee norms and utilization patterns from similar markets.
Forecasts relied mainly on scenario analysis, since architecture demand is sensitive to interest rates, public infrastructure budgets, and commercial real estate cycles. Scenario weights were tuned using what interviewees expected for project cancellations, timeline slippage, and fee pressure, and the final outlook was then smoothed to avoid unrealistic jumps between years.
Data Validation & Update Cycle
Outputs were validated through multiple checks, including reconciling implied fee pools against construction spending signals and reviewing year-over-year variance by region for outliers. When a metric moved too far from its historical relationship, the inputs and conversion factors were revisited, and interview follow-ups were triggered to confirm whether the shift was real or data related.
Before sign-off, the model and assumptions go through a multi-step analyst review so calculations, currency handling, and time-period alignment are consistent. The report is refreshed annually, and interim adjustments are made when material events occur, such as policy changes affecting permits, a sharp construction downturn, or a meaningful shift in public infrastructure awards. Right before delivery, a final pass is done to reflect the most recent data releases and the latest news flow.
Mordor Intelligence's Architectural Services Market Estimate Compared With Other Published Estimates
Published market sizes for architectural services can vary even when the topic sounds the same, since firms often draw the line differently between architecture-only fees and broader AEC consulting revenue. Differences also show up from the year used, the currency conversion timing, and whether numbers are anchored on construction activity signals or mainly on company revenue rollups.
In this study, the main drivers behind the spread are how design-stage work is counted across new build and renovation, how interior design and engineering support are treated inside the service scope, and how fee rate progression is applied when construction cycles soften. The 2025 value below is tied to permit and construction output indicators and then cross-checked with sampled revenue splits, which helps keep adjacent consulting categories from being over-counted, a scope choice applied by Mordor Intelligence.
Benchmark comparison
| Source | Market Size | Gaps in Research Methodology |
|---|---|---|
| Mordor Intelligence | USD 370.51 B (2025) | |
| Global Consultancy A | USD 411.67 B (2025) | Uses a broader service basket that can bundle architecture with adjacent consulting lines, and the uplift can also reflect different fee normalization across regions with higher billed rates. |
| Industry Publisher B | USD 398.33 B (2025) | Applies an alternate regional weighting and solution mapping that may keep more project management and engineering services inside the counted total, which increases the reported 2025 base. |
The table indicates that the gap mostly comes from scope and conversion choices rather than from a single demand driver. By keeping the demand pool tied to observable construction signals and then rechecking fee assumptions with interviews, we get a transparent number that can be replicated and updated when permits, pipelines, or pricing norms change.


Key Questions Answered in the Report
What is the valuation of the architectural services market in 2026?
The architectural services market size stands at USD 390.12 billion in 2026.
How fast is the architectural services market expected to grow?
Industry revenue is projected to rise at a 5.30% CAGR, reaching USD 505.03 billion by 2031.
Which region leads in architectural services revenue?
North America holds the highest 2025 share at 39.14%, supported by large federal infrastructure programs.
Which region is expanding the quickest?
Asia Pacific shows the fastest CAGR of 6.07% through 2031 due to massive infrastructure investments.
What service segment is growing most rapidly?
Urban Planning and Master-planning leads with a forecast 6.28% CAGR as cities launch smart-growth initiatives.
How are digital twins influencing future fees?
Subscription-based digital-twin services turn one-time design contracts into recurring revenue streams by providing ongoing building-performance analytics.
Page last updated on:


