
| Study Period | 2017 - 2029 |
| Base Year For Estimation | 2023 |
| Forecast Data Period | 2024 - 2029 |
| Market Size (2024) | USD 2.64 Billion |
| Market Size (2029) | USD 3.63 Billion |
| CAGR (2024 - 2029) | 6.52 % |
| Market Concentration | High |
Major Players*Disclaimer: Major Players sorted in no particular order |


Aramids Market Analysis
The Aramids Market size is estimated at 2.64 billion USD in 2024, and is expected to reach 3.63 billion USD by 2029, growing at a CAGR of 6.52% during the forecast period (2024-2029).
The aramids industry is experiencing significant transformation driven by broader developments in the manufacturing sector and technological advancements. The manufacturing sector continues to be a crucial economic driver, as evidenced by its substantial 26.6% contribution to Russia's GDP in 2022. This reflects the growing importance of advanced materials like aramids across industrial applications. The increasing focus on material innovation and performance enhancement has led to greater adoption of synthetic fiber and technical textile solutions across various industries due to their exceptional properties, including lightweight characteristics, high strength, and superior corrosion resistance. This shift is particularly notable in regions with expanding manufacturing capabilities, where aramids are increasingly replacing traditional materials in high-performance applications.
Global industrial production trends are reshaping the aramids landscape, with significant developments in key end-use sectors. The global production revenue of aerospace components reached USD 505.5 billion in 2023, highlighting the growing demand for high-performance materials in critical applications. The industry is witnessing a notable shift towards sustainable and environmentally conscious manufacturing practices, with manufacturers increasingly focusing on developing eco-friendly production processes and reducing environmental impact. This transformation is supported by stringent regulatory frameworks across major markets, driving innovation in material development and application techniques.
The market is experiencing a significant evolution in terms of product development and application scope. In 2023, the global electrical and electronics production revenue stood at USD 6,231.8 billion, demonstrating the massive scale of potential applications for technical fiber and industrial fiber solutions in this sector. Manufacturers are increasingly investing in research and development to enhance product performance and expand application possibilities. The industry is witnessing a growing emphasis on customized solutions to meet specific end-user requirements, leading to the development of specialized aramid variants with enhanced properties.
The global manufacturing landscape is undergoing substantial changes with the emergence of new production hubs and technological capabilities. In 2023, worldwide vehicle production reached 150.9 million units, indicating the robust demand for high-performance materials across manufacturing sectors. The industry is experiencing increased collaboration between material manufacturers and end-users to develop innovative solutions and optimize product performance. This trend is particularly evident in emerging markets, where rapid industrialization and growing manufacturing capabilities are creating new opportunities for advanced composite and synthetic fiber applications. The focus on quality improvement and performance enhancement continues to drive research and development efforts in the industry.
Global Aramids Market Trends
Technological advancements in electronics industry may foster the growth
- The rapid pace of technological innovation in electronic products is driving the consistent demand for new and fast electrical and electronic products. In 2022, the global revenue of electrical and electronics stood at USD 5,807 billion, with Asia-Pacific holding a 74% market share, followed by Europe with a 13% share. The global electrical and electronics market is expected to record a CAGR of 6.61% during the forecast period.
- In 2018, the Asia-Pacific region witnessed strong economic growth owing to rapid industrialization in China, South Korea, Japan, India, and ASEAN countries. In 2020, due to the pandemic, there was a slowdown in global electrical and electronics production due to the shortage of chips and inefficiencies in the supply chain, which led to a stagnant growth rate of 0.1% in revenue compared to the previous year. This growth was driven by the demand for consumer electronics for remote working and home entertainment as people were forced to remain indoors during the pandemic.
- The demand for advanced technologies, such as digitalization, robotics, virtual reality, augmented reality, IoT (Internet of Things), and 5G connectivity, is expected to grow during the forecast period. Global electrical and electronics production is expected to register a growth rate of 5.9% in 2027. As a result of technological advancements, the demand for consumer electronics is expected to rise during the forecast period. For instance, the global consumer electronics industry is projected to witness a revenue reach of around USD 904.6 billion in 2027, compared to USD 719.1 billion in 2023. As a result, technological development is projected to lead the demand for electrical and electronic products during the forecast period.

Understand The Key Trends Shaping This Market
Download PDF
OTHER KEY INDUSTRY TRENDS COVERED IN THE REPORT
- Fast-paced growth of aviation industry and increased aircraft contracts may aid market growth
- Fast-paced urbanization and investments in Asia-Pacific region may boost the industry
- Growing demand for electric vehicles may boost automobile industry growth
- Demand for flexible packaging from the food and beverage industry boosting market growth
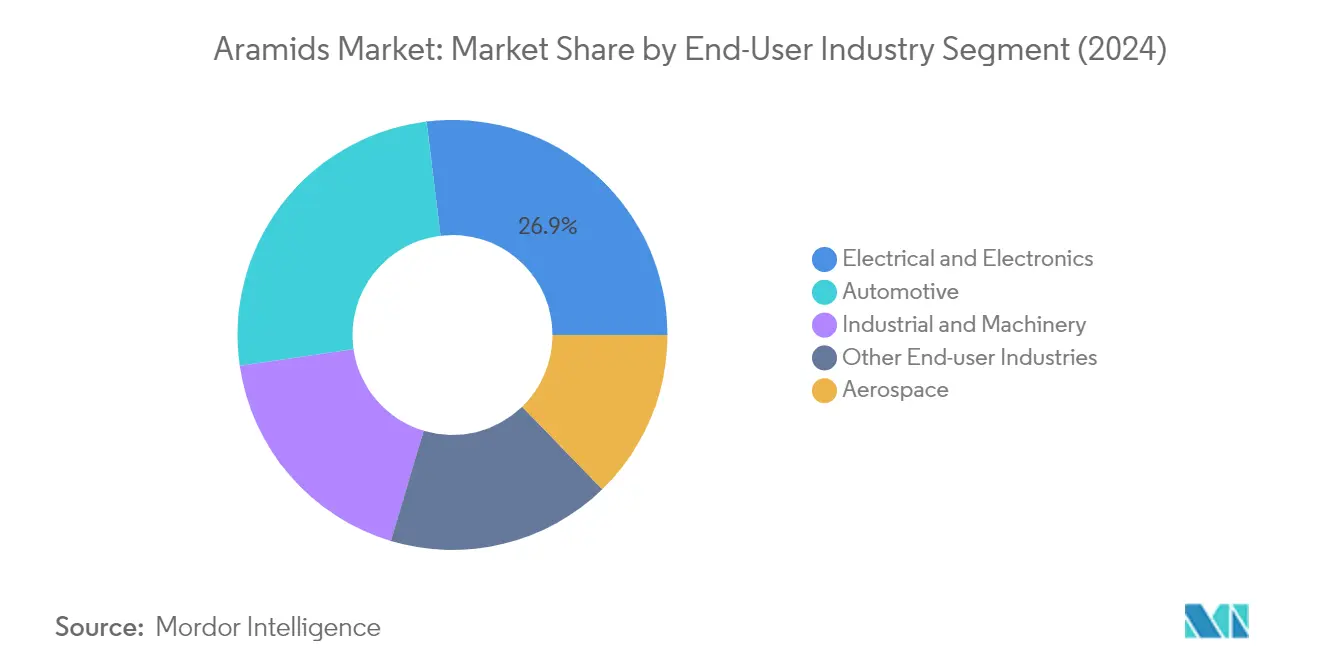
Segment Analysis: End User Industry
Electrical & Electronics Segment in Aramids Market
The electrical and electronics industry represents the dominant segment in the global aramids market, commanding approximately 27% of the total market share in 2024. This segment's leadership position is primarily attributed to the extensive use of aramids in applications such as electrical insulation for high-temperature conditions, high-strength components, and, most importantly, as binders or reinforcements for optical cable fibers and cables. The rapid expansion in the optical cable industry, driven by increasing demand from the telecommunications sector, rising demand for FTTX, and growing technological advancements, has significantly boosted the segment's growth. Furthermore, this segment is also experiencing the fastest growth trajectory, supported by the increasing production in the electrical and electronics industry globally. The segment's growth is particularly driven by the internet's expanding popularity, usability, and dependability, which have dramatically increased the demand for optical fiber cables worldwide.
Remaining Segments in End User Industry
The aramids market encompasses several other significant end-user segments, including automotive, industrial and machinery, aerospace, and other industries. The automotive sector stands as a crucial segment, where aramids find applications in automobile hoses, belts, tire reinforcement, transmission boxes, braking systems, vehicle armor, and airbags. The industrial and machinery segment utilizes technical fiber in applications such as centrifugal pumps, compressors, vacuum pumps, agitators, and propeller shaft seals. The aerospace sector employs advanced composite materials in applications requiring high performance and lightweight materials, particularly in aircraft components and safety equipment. Other end-user industries include marine, consumer goods, locomotive, and medical industries, where protective clothing material and ballistic fiber are used in products such as body armor, composite materials, parachute lines, heat-resistant fabrics, highly loaded textile materials, ropes, and harnesses.
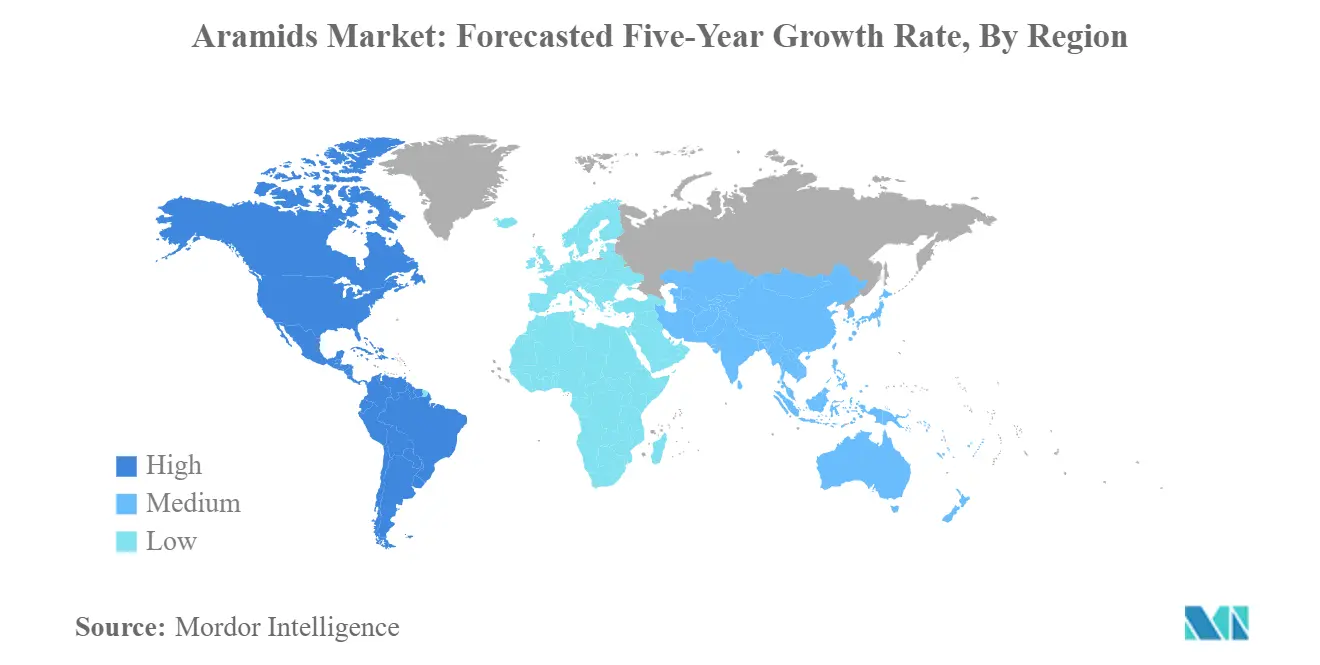
Aramids Market Geography Segment Analysis
Aramids Market in Africa
The African aramids market is characterized by its developing industrial base and growing manufacturing capabilities. The region's market dynamics are primarily driven by South Africa and Nigeria, with increasing adoption in the automotive and electrical/electronics sectors. The market shows particular strength in these sectors due to ongoing industrialization efforts and increasing investments in manufacturing infrastructure across the continent.
Aramids Market in South Africa
South Africa stands as the dominant force in the African aramid market, holding approximately 34% of the regional volume consumption. The country's market leadership is built on its well-established manufacturing sector, advanced technologies for producing high-quality goods, and strategic location ensuring access to the rest of the continent. The automotive and electrical/electronics industries are the primary drivers of aramid consumption, supported by the country's robust industrial infrastructure and technological advancement.
Aramids Market Growth in South Africa
South Africa continues to demonstrate strong growth potential in the aramid market, with an expected growth rate of approximately 6% during 2024-2029. This growth is primarily driven by rapid expansion in the electrical and electronics industry, particularly in wire and cable insulation and optical cable reinforcement applications. The country's focus on strengthening network infrastructure for data transmission and increasing government-implemented schemes are further catalyzing market growth.
Aramids Market in Asia-Pacific
The Asia-Pacific region represents the largest aramid market globally, characterized by its diverse industrial landscape and robust manufacturing capabilities. The region's market is primarily driven by highly industrialized nations like China, Japan, and South Korea, where electrical and electronics, automotive, and industrial machinery segments are the most prominent end-user industries. The presence of major manufacturing hubs and increasing investments in various industrial sectors continues to strengthen the region's market position.
Aramids Market in China
China dominates the Asia-Pacific aramid market, commanding approximately 62% of the regional volume consumption. The country's market leadership is attributed to its extensive manufacturing capabilities, particularly in automotive, electrical and electronics, and machinery manufacturing industries. China's position as a global manufacturing hub, supported by factors such as inexpensive labor and favorable taxation policies, continues to drive its market dominance.
Aramids Market Growth in India
India emerges as the fastest-growing market in the Asia-Pacific region, with an expected growth rate of approximately 8% during 2024-2029. This growth is driven by rapid industrialization, expanding manufacturing output, and increasing investments under government initiatives like 'Made in India' and 'Aatma Nirbhar Bharat'. The country's electrical and electronics sector is particularly dynamic, showing strong adoption of aramids in various applications.
Aramids Market in Europe
Europe maintains a significant position in the global aramid market, with a strong industrial base spread across multiple countries. The region's market is characterized by advanced manufacturing capabilities, particularly in Germany, France, and Italy. The market shows particular strength in automotive, electrical and electronics, and industrial machinery sectors, with an increasing focus on sustainable and high-performance materials, including industrial fiber applications.
Aramids Market in Germany
Germany leads the European aramid market, with its robust industrial ecosystem dominated by automotive, machinery, electrical, and chemical processing industries. The country's market leadership is supported by its advanced manufacturing capabilities, strong research and development infrastructure, and presence of major industrial players. The automotive and industrial machinery sectors are particularly significant drivers of aramid consumption, reflecting the country's commitment to innovation in the synthetic fiber industry.
Aramids Market Growth in France
France demonstrates the most dynamic growth in the European aramid market, driven primarily by its aerospace and electrical/electronics industries. The country's strong aerospace sector, supported by major manufacturers like Airbus, Thales, and Safran, plays a crucial role in driving market growth. Increasing investments in research and development and focus on high-performance materials continue to strengthen France's position in the market, particularly in the technical textile industry.
Aramids Market in Middle East
The Middle East aramid market is experiencing significant growth, primarily driven by increasing investments in various industrial sectors. The United Arab Emirates leads the regional market both in terms of size and growth rate, particularly strong in the electrical and electronics industry. Saudi Arabia follows as the second-largest market, with notable demand from electrical and electronics and automotive sectors. The region's focus on diversifying from oil-dependent economies and increasing investments in manufacturing sectors continues to drive market growth, with applications in military textile sectors gaining attention.
Aramids Market in North America
The North American aramid market is characterized by its advanced manufacturing capabilities and diverse industrial applications. The United States leads the regional market, with significant demand from automotive, electrical and electronics, and industrial machinery sectors. Mexico emerges as the fastest-growing market in the region, driven by its expanding manufacturing base and increasing foreign investments. Canada also maintains a strong presence, particularly in the automotive and aerospace sectors, contributing to the region's prominence in the industrial fiber sector.
Aramids Market in South America
The South American aramid market shows promising growth potential, with Brazil leading the regional market as the most industrialized country. The market is particularly strong in automotive and electrical and electronics sectors, with Argentina emerging as the fastest-growing market. The region's economic progress and increasing manufacturing capabilities, particularly in Brazil's automotive sector and Argentina's industrial machinery segment, continue to drive market growth, with the synthetic fiber industry playing a pivotal role.
Get Analysis on Important Geographic Markets
Download PDF
Aramids Industry Overview
Top Companies in Aramids Market
The global aramids market is characterized by continuous product innovation focused on developing high-performance fibers with enhanced properties for specific end-use applications. Leading companies are investing heavily in research and development to create advanced aramid variants with improved strength, heat resistance, and durability characteristics. Operational agility has become crucial as manufacturers work to optimize production processes and maintain reliable supply chains amid growing demand. Strategic moves in the industry primarily revolve around capacity expansions, with major players announcing significant investments to increase their production capabilities across different regions. Companies are also focusing on strengthening their distribution networks and establishing strategic partnerships with end-users in key industries like automotive, electronics, and aerospace to ensure stable demand channels.
Consolidated Market Led by Global Players
The aramid market exhibits a highly consolidated structure with the top five companies controlling a significant portion of the global market share. These dominant players are large multinational conglomerates with extensive manufacturing capabilities, established distribution networks, and strong research and development infrastructure. DuPont leads the market with its well-known Kevlar brand, followed by other major players like Teijin Limited and Yantai Tayho Advanced Materials. These companies leverage their technological expertise, economies of scale, and long-standing relationships with key customers to maintain their market positions.
The market has seen limited merger and acquisition activity, with companies primarily focusing on organic growth through capacity expansions and product development. Regional players, particularly in Asia-Pacific, are gradually expanding their presence by investing in new production facilities and developing innovative products. The competitive landscape is characterized by high entry barriers due to the capital-intensive nature of production, complex manufacturing processes, and the need for specialized technical expertise. This has resulted in most new entrants being established chemical companies or conglomerates with significant financial resources and technical capabilities.
Innovation and Market Access Drive Success
For incumbent companies to maintain and increase their market share, continuous investment in research and development remains crucial for developing innovative products that meet evolving customer requirements. Establishing strong relationships with key end-users in high-growth industries like electrical and electronics, automotive, and aerospace is essential for securing long-term demand. Companies must also focus on optimizing their production costs, expanding their geographic presence, and maintaining reliable supply chains to remain competitive in the market.
New entrants and smaller players can gain ground by focusing on specific market segments or geographic regions where they can build competitive advantages. Developing specialized products for niche applications, such as Nomex and Twaron, establishing strategic partnerships with local distributors, and investing in efficient production technologies are key strategies for success. The risk of substitution from alternative materials remains relatively low due to the unique properties of aromatic polyamide fibers, though companies must continue innovating to maintain this advantage. Regulatory requirements, particularly in areas like environmental compliance and product safety, are becoming increasingly important factors that companies must address to ensure long-term success in the market.
Aramids Market Leaders
-
DuPont
-
Hyosung Advanced Materials
-
Kolon Industries, Inc.
-
Teijin Limited
-
Yantai Tayho Advanced Materials Co.,Ltd.
- *Disclaimer: Major Players sorted in no particular order

Need More Details on Market Players and Competiters?
Download PDF
Aramids Market News
- November 2021: A new project of Newstar meta-aramid industrialization was put into production by Yantai Tayho Advanced Materials Co.,Ltd. The project makes use of third-generation meta-aramid manufacturing technology, which is at the forefront of the international market.
- November 2020: Teijin announced plans to expand its production capacity of Aramids by 25% and increase its sales volume across locations.
- April 2020: Yantai Tayho Advanced Materials Co.,Ltd. has successfully launched the trial production of Taparan para-aramid. The increase in capacity due to quality upgrading contributes to the increasing demand for high performance fiber both domestically and globally.
Free With This Report
We provide a complimentary and exhaustive set of data points on global and regional metrics that present the fundamental structure of the industry. Presented in the form of 15+ free charts, the section covers rare data on various end-user production trends including passenger vehicle production, commercial vehicle production, motorcycle production, aerospace components production, electrical and electronics production, and regional data for engineering plastics demand etc.


Aramids Market Report - Table of Contents
1. EXECUTIVE SUMMARY & KEY FINDINGS
2. REPORT OFFERS
3. INTRODUCTION
- 3.1 Study Assumptions & Market Definition
- 3.2 Scope of the Study
- 3.3 Research Methodology
4. KEY INDUSTRY TRENDS
-
4.1 End User Trends
- 4.1.1 Aerospace
- 4.1.2 Automotive
- 4.1.3 Building and Construction
- 4.1.4 Electrical and Electronics
- 4.1.5 Packaging
-
4.2 Regulatory Framework
- 4.2.1 Argentina
- 4.2.2 Australia
- 4.2.3 Brazil
- 4.2.4 Canada
- 4.2.5 China
- 4.2.6 EU
- 4.2.7 India
- 4.2.8 Japan
- 4.2.9 Malaysia
- 4.2.10 Mexico
- 4.2.11 Nigeria
- 4.2.12 Russia
- 4.2.13 Saudi Arabia
- 4.2.14 South Africa
- 4.2.15 South Korea
- 4.2.16 United Arab Emirates
- 4.2.17 United Kingdom
- 4.2.18 United States
- 4.3 Value Chain & Distribution Channel Analysis
5. MARKET SEGMENTATION (includes market size in Value in USD and Volume, Forecasts up to 2029 and analysis of growth prospects)
-
5.1 End User Industry
- 5.1.1 Aerospace
- 5.1.2 Automotive
- 5.1.3 Electrical and Electronics
- 5.1.4 Industrial and Machinery
- 5.1.5 Other End-user Industries
-
5.2 Region
- 5.2.1 Africa
- 5.2.1.1 By Country
- 5.2.1.1.1 Nigeria
- 5.2.1.1.2 South Africa
- 5.2.1.1.3 Rest of Africa
- 5.2.2 Asia-Pacific
- 5.2.2.1 By Country
- 5.2.2.1.1 Australia
- 5.2.2.1.2 China
- 5.2.2.1.3 India
- 5.2.2.1.4 Japan
- 5.2.2.1.5 Malaysia
- 5.2.2.1.6 South Korea
- 5.2.2.1.7 Rest of Asia-Pacific
- 5.2.3 Europe
- 5.2.3.1 By Country
- 5.2.3.1.1 France
- 5.2.3.1.2 Germany
- 5.2.3.1.3 Italy
- 5.2.3.1.4 Russia
- 5.2.3.1.5 United Kingdom
- 5.2.3.1.6 Rest of Europe
- 5.2.4 Middle East
- 5.2.4.1 By Country
- 5.2.4.1.1 Saudi Arabia
- 5.2.4.1.2 United Arab Emirates
- 5.2.4.1.3 Rest of Middle East
- 5.2.5 North America
- 5.2.5.1 By Country
- 5.2.5.1.1 Canada
- 5.2.5.1.2 Mexico
- 5.2.5.1.3 United States
- 5.2.6 South America
- 5.2.6.1 By Country
- 5.2.6.1.1 Argentina
- 5.2.6.1.2 Brazil
- 5.2.6.1.3 Rest of South America
6. COMPETITIVE LANDSCAPE
- 6.1 Key Strategic Moves
- 6.2 Market Share Analysis
- 6.3 Company Landscape
-
6.4 Company Profiles (includes Global Level Overview, Market Level Overview, Core Business Segments, Financials, Headcount, Key Information, Market Rank, Market Share, Products and Services, and Analysis of Recent Developments).
- 6.4.1 China Petroleum & Chemical Corporation
- 6.4.2 DuPont
- 6.4.3 Huvis Corp.
- 6.4.4 Hyosung Advanced Materials
- 6.4.5 JSC "Kamenskvolokno"
- 6.4.6 Kolon Industries, Inc.
- 6.4.7 Taekwang Industrial Co., Ltd
- 6.4.8 Teijin Limited
- 6.4.9 X-FIPER New Material Co., Ltd
- 6.4.10 Yantai Tayho Advanced Materials Co.,Ltd.
7. KEY STRATEGIC QUESTIONS FOR ENGINEERING PLASTICS CEOS
8. APPENDIX
-
8.1 Global Overview
- 8.1.1 Overview
- 8.1.2 Porter’s Five Forces Framework (Industry Attractiveness Analysis)
- 8.1.3 Global Value Chain Analysis
- 8.1.4 Market Dynamics (DROs)
- 8.2 Sources & References
- 8.3 List of Tables & Figures
- 8.4 Primary Insights
- 8.5 Data Pack
- 8.6 Glossary of Terms
You Can Purchase Parts Of This Report. Check Out Prices For Specific Sections
Get Price Break-up Now
List of Tables & Figures
- Figure 1:
- PRODUCTION REVENUE OF AEROSPACE COMPONENTS, USD, GLOBAL, 2017 - 2029
- Figure 2:
- PRODUCTION VOLUME OF AUTOMOBILES, UNITS, GLOBAL, 2017 - 2029
- Figure 3:
- FLOOR AREA OF NEW CONSTRUCTION, SQUARE FEET, GLOBAL, 2017 - 2029
- Figure 4:
- PRODUCTION REVENUE OF ELECTRICAL AND ELECTRONICS, USD, GLOBAL, 2017 - 2029
- Figure 5:
- PRODUCTION VOLUME OF PLASTIC PACKAGING, TONS, GLOBAL, 2017 - 2029
- Figure 6:
- VOLUME OF ARAMID CONSUMED, TONS, GLOBAL, 2017 - 2029
- Figure 7:
- VALUE OF ARAMID CONSUMED, USD, GLOBAL, 2017 - 2029
- Figure 8:
- VOLUME OF ARAMID CONSUMED BY END USER INDUSTRY, TONS, GLOBAL, 2017 - 2029
- Figure 9:
- VALUE OF ARAMID CONSUMED BY END USER INDUSTRY, USD, GLOBAL, 2017 - 2029
- Figure 10:
- VOLUME SHARE OF ARAMID CONSUMED BY END USER INDUSTRY, %, GLOBAL, 2017, 2023, AND 2029
- Figure 11:
- VALUE SHARE OF ARAMID CONSUMED BY END USER INDUSTRY, %, GLOBAL, 2017, 2023, AND 2029
- Figure 12:
- VOLUME OF ARAMID CONSUMED IN AEROSPACE INDUSTRY, TONS, GLOBAL, 2017 - 2029
- Figure 13:
- VALUE OF ARAMID CONSUMED IN AEROSPACE INDUSTRY, USD, GLOBAL, 2017 - 2029
- Figure 14:
- VALUE SHARE OF ARAMID CONSUMED IN AEROSPACE INDUSTRY BY REGION, %, GLOBAL, 2022 VS 2029
- Figure 15:
- VOLUME OF ARAMID CONSUMED IN AUTOMOTIVE INDUSTRY, TONS, GLOBAL, 2017 - 2029
- Figure 16:
- VALUE OF ARAMID CONSUMED IN AUTOMOTIVE INDUSTRY, USD, GLOBAL, 2017 - 2029
- Figure 17:
- VALUE SHARE OF ARAMID CONSUMED IN AUTOMOTIVE INDUSTRY BY REGION, %, GLOBAL, 2022 VS 2029
- Figure 18:
- VOLUME OF ARAMID CONSUMED IN ELECTRICAL AND ELECTRONICS INDUSTRY, TONS, GLOBAL, 2017 - 2029
- Figure 19:
- VALUE OF ARAMID CONSUMED IN ELECTRICAL AND ELECTRONICS INDUSTRY, USD, GLOBAL, 2017 - 2029
- Figure 20:
- VALUE SHARE OF ARAMID CONSUMED IN ELECTRICAL AND ELECTRONICS INDUSTRY BY REGION, %, GLOBAL, 2022 VS 2029
- Figure 21:
- VOLUME OF ARAMID CONSUMED IN INDUSTRIAL AND MACHINERY INDUSTRY, TONS, GLOBAL, 2017 - 2029
- Figure 22:
- VALUE OF ARAMID CONSUMED IN INDUSTRIAL AND MACHINERY INDUSTRY, USD, GLOBAL, 2017 - 2029
- Figure 23:
- VALUE SHARE OF ARAMID CONSUMED IN INDUSTRIAL AND MACHINERY INDUSTRY BY REGION, %, GLOBAL, 2022 VS 2029
- Figure 24:
- VOLUME OF ARAMID CONSUMED IN OTHER END-USER INDUSTRIES INDUSTRY, TONS, GLOBAL, 2017 - 2029
- Figure 25:
- VALUE OF ARAMID CONSUMED IN OTHER END-USER INDUSTRIES INDUSTRY, USD, GLOBAL, 2017 - 2029
- Figure 26:
- VALUE SHARE OF ARAMID CONSUMED IN OTHER END-USER INDUSTRIES INDUSTRY BY REGION, %, GLOBAL, 2022 VS 2029
- Figure 27:
- VOLUME OF ARAMID CONSUMED BY REGION, TONS, GLOBAL, 2017 - 2029
- Figure 28:
- VALUE OF ARAMID CONSUMED BY REGION, USD, GLOBAL, 2017 - 2029
- Figure 29:
- VOLUME SHARE OF ARAMID CONSUMED BY REGION, %, GLOBAL, 2017, 2023, AND 2029
- Figure 30:
- VALUE SHARE OF ARAMID CONSUMED BY REGION, %, GLOBAL, 2017, 2023, AND 2029
- Figure 31:
- VOLUME OF ARAMID CONSUMED BY COUNTRY, TONS, AFRICA, 2017 - 2029
- Figure 32:
- VALUE OF ARAMID CONSUMED BY COUNTRY, USD, AFRICA, 2017 - 2029
- Figure 33:
- VOLUME SHARE OF ARAMID CONSUMED BY COUNTRY, %, AFRICA, 2017, 2023, AND 2029
- Figure 34:
- VALUE SHARE OF ARAMID CONSUMED BY COUNTRY, %, AFRICA, 2017, 2023, AND 2029
- Figure 35:
- VOLUME OF ARAMID CONSUMED, TONS, NIGERIA, 2017 - 2029
- Figure 36:
- VALUE OF ARAMID CONSUMED, USD, NIGERIA, 2017 - 2029
- Figure 37:
- VALUE SHARE OF ARAMID CONSUMED BY END USER INDUSTRY, %, NIGERIA, 2022 VS 2029
- Figure 38:
- VOLUME OF ARAMID CONSUMED, TONS, SOUTH AFRICA, 2017 - 2029
- Figure 39:
- VALUE OF ARAMID CONSUMED, USD, SOUTH AFRICA, 2017 - 2029
- Figure 40:
- VALUE SHARE OF ARAMID CONSUMED BY END USER INDUSTRY, %, SOUTH AFRICA, 2022 VS 2029
- Figure 41:
- VOLUME OF ARAMID CONSUMED, TONS, REST OF AFRICA, 2017 - 2029
- Figure 42:
- VALUE OF ARAMID CONSUMED, USD, REST OF AFRICA, 2017 - 2029
- Figure 43:
- VALUE SHARE OF ARAMID CONSUMED BY END USER INDUSTRY, %, REST OF AFRICA, 2022 VS 2029
- Figure 44:
- VOLUME OF ARAMID CONSUMED BY COUNTRY, TONS, ASIA-PACIFIC, 2017 - 2029
- Figure 45:
- VALUE OF ARAMID CONSUMED BY COUNTRY, USD, ASIA-PACIFIC, 2017 - 2029
- Figure 46:
- VOLUME SHARE OF ARAMID CONSUMED BY COUNTRY, %, ASIA-PACIFIC, 2017, 2023, AND 2029
- Figure 47:
- VALUE SHARE OF ARAMID CONSUMED BY COUNTRY, %, ASIA-PACIFIC, 2017, 2023, AND 2029
- Figure 48:
- VOLUME OF ARAMID CONSUMED, TONS, AUSTRALIA, 2017 - 2029
- Figure 49:
- VALUE OF ARAMID CONSUMED, USD, AUSTRALIA, 2017 - 2029
- Figure 50:
- VALUE SHARE OF ARAMID CONSUMED BY END USER INDUSTRY, %, AUSTRALIA, 2022 VS 2029
- Figure 51:
- VOLUME OF ARAMID CONSUMED, TONS, CHINA, 2017 - 2029
- Figure 52:
- VALUE OF ARAMID CONSUMED, USD, CHINA, 2017 - 2029
- Figure 53:
- VALUE SHARE OF ARAMID CONSUMED BY END USER INDUSTRY, %, CHINA, 2022 VS 2029
- Figure 54:
- VOLUME OF ARAMID CONSUMED, TONS, INDIA, 2017 - 2029
- Figure 55:
- VALUE OF ARAMID CONSUMED, USD, INDIA, 2017 - 2029
- Figure 56:
- VALUE SHARE OF ARAMID CONSUMED BY END USER INDUSTRY, %, INDIA, 2022 VS 2029
- Figure 57:
- VOLUME OF ARAMID CONSUMED, TONS, JAPAN, 2017 - 2029
- Figure 58:
- VALUE OF ARAMID CONSUMED, USD, JAPAN, 2017 - 2029
- Figure 59:
- VALUE SHARE OF ARAMID CONSUMED BY END USER INDUSTRY, %, JAPAN, 2022 VS 2029
- Figure 60:
- VOLUME OF ARAMID CONSUMED, TONS, MALAYSIA, 2017 - 2029
- Figure 61:
- VALUE OF ARAMID CONSUMED, USD, MALAYSIA, 2017 - 2029
- Figure 62:
- VALUE SHARE OF ARAMID CONSUMED BY END USER INDUSTRY, %, MALAYSIA, 2022 VS 2029
- Figure 63:
- VOLUME OF ARAMID CONSUMED, TONS, SOUTH KOREA, 2017 - 2029
- Figure 64:
- VALUE OF ARAMID CONSUMED, USD, SOUTH KOREA, 2017 - 2029
- Figure 65:
- VALUE SHARE OF ARAMID CONSUMED BY END USER INDUSTRY, %, SOUTH KOREA, 2022 VS 2029
- Figure 66:
- VOLUME OF ARAMID CONSUMED, TONS, REST OF ASIA-PACIFIC, 2017 - 2029
- Figure 67:
- VALUE OF ARAMID CONSUMED, USD, REST OF ASIA-PACIFIC, 2017 - 2029
- Figure 68:
- VALUE SHARE OF ARAMID CONSUMED BY END USER INDUSTRY, %, REST OF ASIA-PACIFIC, 2022 VS 2029
- Figure 69:
- VOLUME OF ARAMID CONSUMED BY COUNTRY, TONS, EUROPE, 2017 - 2029
- Figure 70:
- VALUE OF ARAMID CONSUMED BY COUNTRY, USD, EUROPE, 2017 - 2029
- Figure 71:
- VOLUME SHARE OF ARAMID CONSUMED BY COUNTRY, %, EUROPE, 2017, 2023, AND 2029
- Figure 72:
- VALUE SHARE OF ARAMID CONSUMED BY COUNTRY, %, EUROPE, 2017, 2023, AND 2029
- Figure 73:
- VOLUME OF ARAMID CONSUMED, TONS, FRANCE, 2017 - 2029
- Figure 74:
- VALUE OF ARAMID CONSUMED, USD, FRANCE, 2017 - 2029
- Figure 75:
- VALUE SHARE OF ARAMID CONSUMED BY END USER INDUSTRY, %, FRANCE, 2022 VS 2029
- Figure 76:
- VOLUME OF ARAMID CONSUMED, TONS, GERMANY, 2017 - 2029
- Figure 77:
- VALUE OF ARAMID CONSUMED, USD, GERMANY, 2017 - 2029
- Figure 78:
- VALUE SHARE OF ARAMID CONSUMED BY END USER INDUSTRY, %, GERMANY, 2022 VS 2029
- Figure 79:
- VOLUME OF ARAMID CONSUMED, TONS, ITALY, 2017 - 2029
- Figure 80:
- VALUE OF ARAMID CONSUMED, USD, ITALY, 2017 - 2029
- Figure 81:
- VALUE SHARE OF ARAMID CONSUMED BY END USER INDUSTRY, %, ITALY, 2022 VS 2029
- Figure 82:
- VOLUME OF ARAMID CONSUMED, TONS, RUSSIA, 2017 - 2029
- Figure 83:
- VALUE OF ARAMID CONSUMED, USD, RUSSIA, 2017 - 2029
- Figure 84:
- VALUE SHARE OF ARAMID CONSUMED BY END USER INDUSTRY, %, RUSSIA, 2022 VS 2029
- Figure 85:
- VOLUME OF ARAMID CONSUMED, TONS, UNITED KINGDOM, 2017 - 2029
- Figure 86:
- VALUE OF ARAMID CONSUMED, USD, UNITED KINGDOM, 2017 - 2029
- Figure 87:
- VALUE SHARE OF ARAMID CONSUMED BY END USER INDUSTRY, %, UNITED KINGDOM, 2022 VS 2029
- Figure 88:
- VOLUME OF ARAMID CONSUMED, TONS, REST OF EUROPE, 2017 - 2029
- Figure 89:
- VALUE OF ARAMID CONSUMED, USD, REST OF EUROPE, 2017 - 2029
- Figure 90:
- VALUE SHARE OF ARAMID CONSUMED BY END USER INDUSTRY, %, REST OF EUROPE, 2022 VS 2029
- Figure 91:
- VOLUME OF ARAMID CONSUMED BY COUNTRY, TONS, MIDDLE EAST, 2017 - 2029
- Figure 92:
- VALUE OF ARAMID CONSUMED BY COUNTRY, USD, MIDDLE EAST, 2017 - 2029
- Figure 93:
- VOLUME SHARE OF ARAMID CONSUMED BY COUNTRY, %, MIDDLE EAST, 2017, 2023, AND 2029
- Figure 94:
- VALUE SHARE OF ARAMID CONSUMED BY COUNTRY, %, MIDDLE EAST, 2017, 2023, AND 2029
- Figure 95:
- VOLUME OF ARAMID CONSUMED, TONS, SAUDI ARABIA, 2017 - 2029
- Figure 96:
- VALUE OF ARAMID CONSUMED, USD, SAUDI ARABIA, 2017 - 2029
- Figure 97:
- VALUE SHARE OF ARAMID CONSUMED BY END USER INDUSTRY, %, SAUDI ARABIA, 2022 VS 2029
- Figure 98:
- VOLUME OF ARAMID CONSUMED, TONS, UNITED ARAB EMIRATES, 2017 - 2029
- Figure 99:
- VALUE OF ARAMID CONSUMED, USD, UNITED ARAB EMIRATES, 2017 - 2029
- Figure 100:
- VALUE SHARE OF ARAMID CONSUMED BY END USER INDUSTRY, %, UNITED ARAB EMIRATES, 2022 VS 2029
- Figure 101:
- VOLUME OF ARAMID CONSUMED, TONS, REST OF MIDDLE EAST, 2017 - 2029
- Figure 102:
- VALUE OF ARAMID CONSUMED, USD, REST OF MIDDLE EAST, 2017 - 2029
- Figure 103:
- VALUE SHARE OF ARAMID CONSUMED BY END USER INDUSTRY, %, REST OF MIDDLE EAST, 2022 VS 2029
- Figure 104:
- VOLUME OF ARAMID CONSUMED BY COUNTRY, TONS, NORTH AMERICA, 2017 - 2029
- Figure 105:
- VALUE OF ARAMID CONSUMED BY COUNTRY, USD, NORTH AMERICA, 2017 - 2029
- Figure 106:
- VOLUME SHARE OF ARAMID CONSUMED BY COUNTRY, %, NORTH AMERICA, 2017, 2023, AND 2029
- Figure 107:
- VALUE SHARE OF ARAMID CONSUMED BY COUNTRY, %, NORTH AMERICA, 2017, 2023, AND 2029
- Figure 108:
- VOLUME OF ARAMID CONSUMED, TONS, CANADA, 2017 - 2029
- Figure 109:
- VALUE OF ARAMID CONSUMED, USD, CANADA, 2017 - 2029
- Figure 110:
- VALUE SHARE OF ARAMID CONSUMED BY END USER INDUSTRY, %, CANADA, 2022 VS 2029
- Figure 111:
- VOLUME OF ARAMID CONSUMED, TONS, MEXICO, 2017 - 2029
- Figure 112:
- VALUE OF ARAMID CONSUMED, USD, MEXICO, 2017 - 2029
- Figure 113:
- VALUE SHARE OF ARAMID CONSUMED BY END USER INDUSTRY, %, MEXICO, 2022 VS 2029
- Figure 114:
- VOLUME OF ARAMID CONSUMED, TONS, UNITED STATES, 2017 - 2029
- Figure 115:
- VALUE OF ARAMID CONSUMED, USD, UNITED STATES, 2017 - 2029
- Figure 116:
- VALUE SHARE OF ARAMID CONSUMED BY END USER INDUSTRY, %, UNITED STATES, 2022 VS 2029
- Figure 117:
- VOLUME OF ARAMID CONSUMED BY COUNTRY, TONS, SOUTH AMERICA, 2017 - 2029
- Figure 118:
- VALUE OF ARAMID CONSUMED BY COUNTRY, USD, SOUTH AMERICA, 2017 - 2029
- Figure 119:
- VOLUME SHARE OF ARAMID CONSUMED BY COUNTRY, %, SOUTH AMERICA, 2017, 2023, AND 2029
- Figure 120:
- VALUE SHARE OF ARAMID CONSUMED BY COUNTRY, %, SOUTH AMERICA, 2017, 2023, AND 2029
- Figure 121:
- VOLUME OF ARAMID CONSUMED, TONS, ARGENTINA, 2017 - 2029
- Figure 122:
- VALUE OF ARAMID CONSUMED, USD, ARGENTINA, 2017 - 2029
- Figure 123:
- VALUE SHARE OF ARAMID CONSUMED BY END USER INDUSTRY, %, ARGENTINA, 2022 VS 2029
- Figure 124:
- VOLUME OF ARAMID CONSUMED, TONS, BRAZIL, 2017 - 2029
- Figure 125:
- VALUE OF ARAMID CONSUMED, USD, BRAZIL, 2017 - 2029
- Figure 126:
- VALUE SHARE OF ARAMID CONSUMED BY END USER INDUSTRY, %, BRAZIL, 2022 VS 2029
- Figure 127:
- VOLUME OF ARAMID CONSUMED, TONS, REST OF SOUTH AMERICA, 2017 - 2029
- Figure 128:
- VALUE OF ARAMID CONSUMED, USD, REST OF SOUTH AMERICA, 2017 - 2029
- Figure 129:
- VALUE SHARE OF ARAMID CONSUMED BY END USER INDUSTRY, %, REST OF SOUTH AMERICA, 2022 VS 2029
- Figure 130:
- MOST ACTIVE COMPANIES BY NUMBER OF STRATEGIC MOVES, GLOBAL, 2019 - 2021
- Figure 131:
- MOST ADOPTED STRATEGIES, COUNT, GLOBAL, 2019 - 2021
- Figure 132:
- PRODUCTION CAPACITY SHARE OF ARAMID BY MAJOR PLAYERS, %, GLOBAL, 2022
Aramids Industry Segmentation
Aerospace, Automotive, Electrical and Electronics, Industrial and Machinery are covered as segments by End User Industry. Africa, Asia-Pacific, Europe, Middle East, North America, South America are covered as segments by Region.| End User Industry | Aerospace | |||
| Automotive | ||||
| Electrical and Electronics | ||||
| Industrial and Machinery | ||||
| Other End-user Industries | ||||
| Region | Africa | By Country | Nigeria | |
| South Africa | ||||
| Rest of Africa | ||||
| Asia-Pacific | By Country | Australia | ||
| China | ||||
| India | ||||
| Japan | ||||
| Malaysia | ||||
| South Korea | ||||
| Rest of Asia-Pacific | ||||
| Europe | By Country | France | ||
| Germany | ||||
| Italy | ||||
| Russia | ||||
| United Kingdom | ||||
| Rest of Europe | ||||
| Middle East | By Country | Saudi Arabia | ||
| United Arab Emirates | ||||
| Rest of Middle East | ||||
| North America | By Country | Canada | ||
| Mexico | ||||
| United States | ||||
| South America | By Country | Argentina | ||
| Brazil | ||||
| Rest of South America | ||||
Need A Different Region or Segment?
Customize Now
Market Definition
- End-user Industry - Automotive, Electrical & Electronics, Industrial & Machinery, Aerospace, and Others are the end-user industries considered under the aramid market.
- Resin - Under the scope of the study, consumption of virgin aramid resin in the primary forms such as powder, pellet, etc. are considered.
| Keyword | Definition |
|---|---|
| Acetal | This is a rigid material that has a slippery surface. It can easily withstand wear and tear in abusive work environments. This polymer is used for building applications such as gears, bearings, valve components, etc. |
| Acrylic | This synthetic resin is a derivative of acrylic acid. It forms a smooth surface and is mainly used for various indoor applications. The material can also be used for outdoor applications with a special formulation. |
| Cast film | A cast film is made by depositing a layer of plastic onto a surface then solidifying and removing the film from that surface. The plastic layer can be in molten form, in a solution, or in dispersion. |
| Colorants & Pigments | Colorants & Pigments are additives used to change the color of the plastic. They can be a powder or a resin/color premix. |
| Composite material | A composite material is a material that is produced from two or more constituent materials. These constituent materials have dissimilar chemical or physical properties and are merged to create a material with properties unlike the individual elements. |
| Degree of Polymerization (DP) | The number of monomeric units in a macromolecule, polymer, or oligomer molecule is referred to as the degree of polymerization or DP. Plastics with useful physical properties often have DPs in the thousands. |
| Dispersion | To create a suspension or solution of material in another substance, fine, agglomerated solid particles of one substance are dispersed in a liquid or another substance to form a dispersion. |
| Fiberglass | Fiberglass-reinforced plastic is a material made up of glass fibers embedded in a resin matrix. These materials have high tensile and impact strength. Handrails and platforms are two examples of lightweight structural applications that use standard fiberglass. |
| Fiber-reinforced polymer (FRP) | Fiber-reinforced polymer is a composite material made of a polymer matrix reinforced with fibers. The fibers are usually glass, carbon, aramid, or basalt. |
| Flake | This is a dry, peeled-off piece, usually with an uneven surface, and is the base of cellulosic plastics. |
| Fluoropolymers | This is a fluorocarbon-based polymer with multiple carbon-fluorine bonds. It is characterized by high resistance to solvents, acids, and bases. These materials are tough yet easy to machine. Some of the popular fluoropolymers are PTFE, ETFE, PVDF, PVF, etc. |
| Kevlar | Kevlar is the commonly referred name for aramid fiber, which was initially a Dupont brand for aramid fiber. Any group of lightweight, heat-resistant, solid, synthetic, aromatic polyamide materials that are fashioned into fibers, filaments, or sheets is called aramid fiber. They are classified into Para-aramid and Meta-aramid. |
| Laminate | A structure or surface composed of sequential layers of material bonded under pressure and heat to build up to the desired shape and width. |
| Nylon | They are synthetic fiber-forming polyamides formed into yarns and monofilaments. These fibers possess excellent tensile strength, durability, and elasticity. They have high melting points and can resist chemicals and various liquids. |
| PET preform | A preform is an intermediate product that is subsequently blown into a polyethylene terephthalate (PET) bottle or a container. |
| Plastic compounding | Compounding consists of preparing plastic formulations by mixing and/or blending polymers and additives in a molten state to achieve the desired characteristics. These blends are automatically dosed with fixed setpoints usually through feeders/hoppers. |
| Plastic pellets | Plastic pellets, also known as pre-production pellets or nurdles, are the building blocks for nearly every product made of plastic. |
| Polymerization | It is a chemical reaction of several monomer molecules to form polymer chains that form stable covalent bonds. |
| Styrene Copolymers | A copolymer is a polymer derived from more than one species of monomer, and a styrene copolymer is a chain of polymers consisting of styrene and acrylate. |
| Thermoplastics | Thermoplastics are defined as polymers that become soft material when it is heated and becomes hard when it is cooled. Thermoplastics have wide-ranging properties and can be remolded and recycled without affecting their physical properties. |
| Virgin Plastic | It is a basic form of plastic that has never been used, processed, or developed. It may be considered more valuable than recycled or already used materials. |
Need More Details on Market Definition?
Ask a Question
Research Methodology
Mordor Intelligence follows a four-step methodology in all our reports.
- Step-1: Identify Key Variables: The quantifiable key variables (industry and extraneous) pertaining to the specific product segment and country are selected from a group of relevant variables & factors based on desk research & literature review; along with primary expert inputs. These variables are further confirmed through regression modeling (wherever required).
- Step-2: Build a Market Model: In order to build a robust forecasting methodology, the variables and factors identified in Step-1 are tested against available historical market numbers. Through an iterative process, the variables required for market forecast are set and the model is built on the basis of these variables.
- Step-3: Validate and Finalize: In this important step, all market numbers, variables and analyst calls are validated through an extensive network of primary research experts from the market studied. The respondents are selected across levels and functions to generate a holistic picture of the market studied.
- Step-4: Research Outputs: Syndicated Reports, Custom Consulting Assignments, Databases & Subscription Platforms

Get More Details On Research Methodology
Download PDF


