
Aquaponics Market Size and Share
Market Overview
| Study Period | 2021 - 2031 |
|---|---|
| Market Size (2026) | USD 1.20 Billion |
| Market Size (2031) | USD 2.20 Billion |
| Growth Rate (2026 - 2031) | 12.89 % |
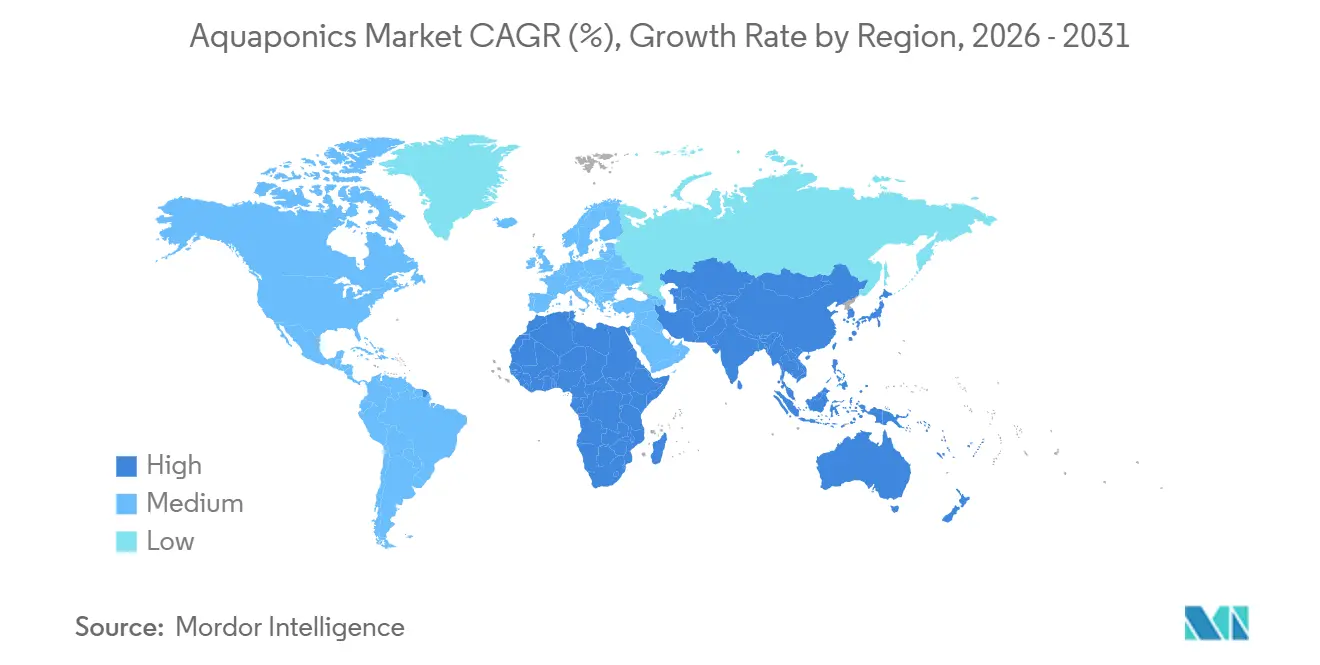
| Fastest Growing Market | Asia Pacific |
| Largest Market | North America |
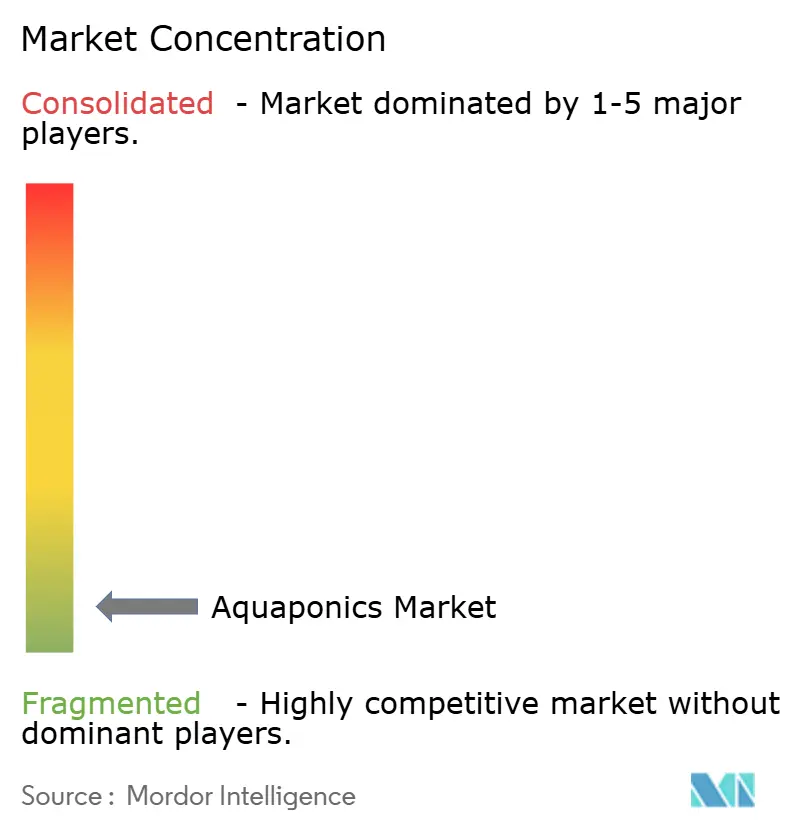
| Market Concentration | Low |
Major Players *Disclaimer: Major Players sorted in no particular order Image © Mordor Intelligence. Reuse requires attribution under CC BY 4.0. | |
Aquaponics Market Analysis by Mordor Intelligence
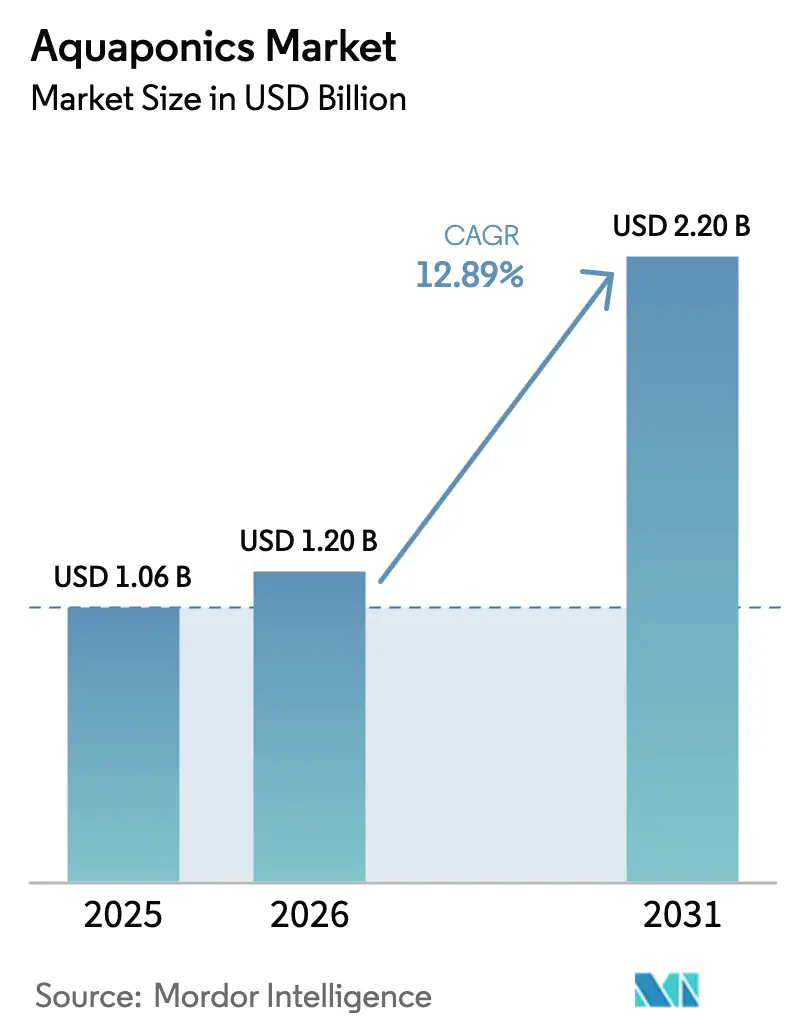
The aquaponics market size was valued at USD 1.06 billion in 2025 and estimated to grow from USD 1.20 billion in 2026 to reach USD 2.20 billion by 2031, at a CAGR of 12.89% during the forecast period (2026-2031). Scaling from experimental greenhouses to climate-controlled commercial hubs, the aquaponics market now supplies grocers, restaurants, and direct-to-consumer channels with synchronized harvests of fresh protein and produce. Demand is strongest in metropolitan regions that value pesticide-free greens, shorter supply chains, and year-round availability, while technology infusions, such as artificial intelligence-guided feeding, Internet of Things (IoT) sensors, and automated climate controls, continue to compress labor inputs and reduce mortality events. Rising water scarcity, circular-economy mandates, and government incentives are expanding the addressable market for aquaponic projects, prompting operators to shift their crop portfolios toward premium herbs and adopt modular designs that reduce upfront capital costs. Competitive intensity remains moderate because no single operator controls sufficient capacity to dictate pricing, yet first movers are consolidating regional footholds through vertical integration across hatchery genetics, proprietary feeds, and direct distribution.
Key Report Takeaways
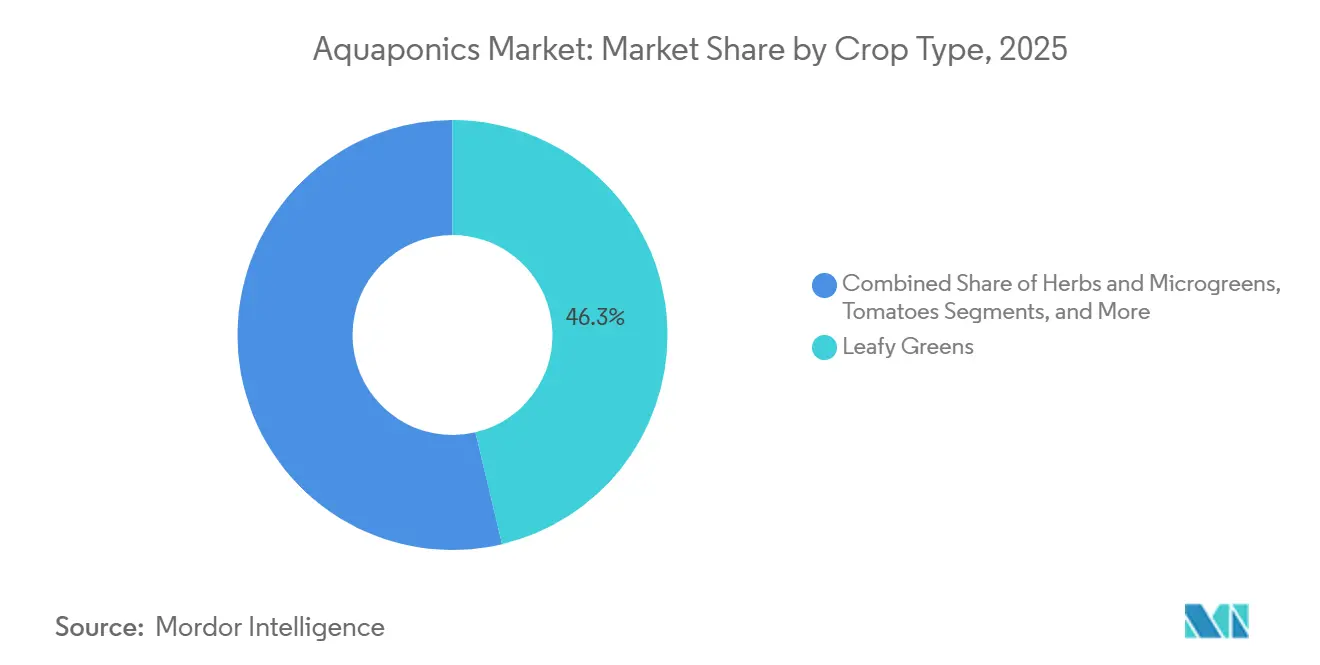
- By crop type, leafy greens accounted for 46.3% of the aquaponics market size in 2025, whereas herbs and microgreens are anticipated to expand at a 13.7% CAGR through 2031.
- By fish species, tilapia commanded 38.7% of revenue in 2025, while catfish is advancing at a 13.4% CAGR through 2031.
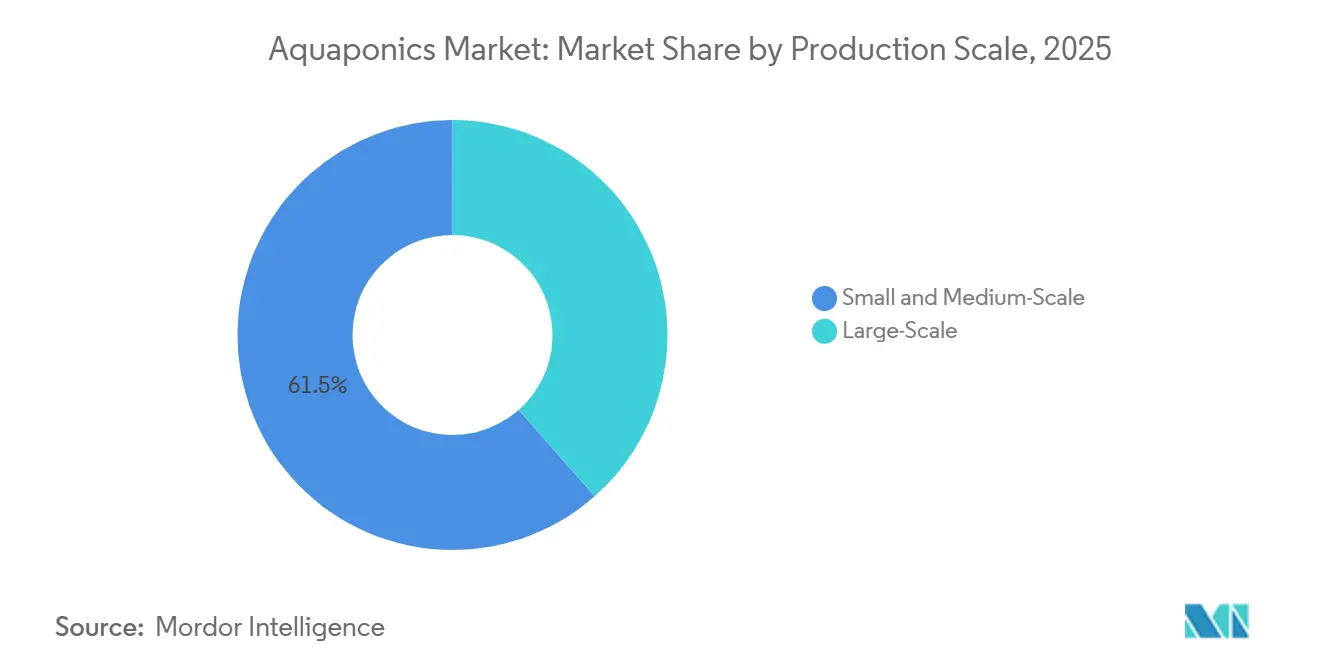
- By production scale, small and medium-scale systems accounted for 61.5% of revenue in 2025 and are projected to grow at 13.3% through 2031.
- By geography, North America led the aquaponics market with a 34.2% share in 2025, while the Asia-Pacific region is projected to be the fastest-growing at a 13.1% CAGR through 2031.
Note: Market size and forecast figures in this report are generated using Mordor Intelligence’s proprietary estimation framework, updated with the latest available data and insights as of January 2026.
Market Trends and Insights
Drivers Impact Analysis of Aquaponics Market*
| Driver | (~) % Impact on CAGR Forecast | Geographic Relevance | Impact Timeline |
|---|---|---|---|
| Rising demand for locally sourced pesticide-free produce | +2.8% | Global with strongest uptake in North America, Europe, and urban Asia-Pacific hubs | Medium term (2-4 years) |
| Adoption of circular-economy water-conservation practices | +2.3% | Middle East, North Africa, and water-stressed areas in Asia-Pacific | Long term (≥4 years) |
| Integration with vertical farming for urban food security | +2.1% | Singapore, China, Japan, and selected Middle Eastern and North American cities | Medium term (2-4 years) |
| Commercialization of high-value medicinal herbs | +1.6% | North America, Europe, and Asia-Pacific pharmaceutical and nutraceutical clusters | Long term (≥4 years) |
| Government incentives for sustainable agriculture | +2.0% | North America, Europe, Asia-Pacific, emerging Middle East and Africa | Short term (≤2 years) |
| Advances in controlled-environment monitoring | +2.4% | North America and Europe, accelerating in Asia-Pacific | Medium term (2-4 years) |
| Source: Mordor Intelligence | |||
Rising Demand for Locally Sourced Pesticide-Free Produce
Urban shoppers are increasingly demanding traceable vegetables harvested within 24 hours, and aquaponics eliminates the need for synthetic pesticides because fish cannot tolerate chemical residues in recirculating water. Superior Fresh LLC shuttered its hydroponic lettuce production in Indiana in 2024 to concentrate capital on its integrated Wisconsin complex, signaling that dual protein-and-produce models generate superior margins[1]Source: Jane Smith, “Superior Fresh Closes Indiana Facility,” Hatchery International, hatcheryinternational.com. Retail premiums of 20.0-30.0% encourage operators to bypass wholesale channels through farmers’ markets and subscription deliveries, stabilizing cash cycles during peak demand seasons.
Adoption of Circular-Economy Water-Conservation Practices
Aquaponics recycles approximately 90.0% of the system's water, aligning perfectly with European Union circular economy directives and drought mitigation strategies in the Middle East. Singapore’s Agri-Food and Veterinary Authority has earmarked SGD 309 million (USD 229.3 million) to support low-water agrifood research through 2025[2]Source: Singapore Food Agency, “Singapore Aquaculture Plan 2024,” sfa.gov.sg. The LIFE-LEMNERGY project in the European Union, currently running in the 2021-2027 phase, has achieved nitrogen removal above 85.0% by integrating duckweed nutrient recovery, cutting discharge, and generating biogas that offsets climate-control energy costs[3]Source: European Commission, “LIFE-LEMNERGY Project Results,” cordis.europa.eu.
Integration with Vertical Farming for Urban Food Security
Stacking aquaponic grow beds inside multistory buildings multiplies production per square meter, which is essential for land-constrained megacities. Singapore’s “30 by 30” blueprint seeks to meet 30.0% of nutritional demand locally by 2030, and the 2024 Singapore Aquaculture Plan reserved coastal and rooftop sites for dense fish-and-vegetable hubs. BIGH’s 4,000-square-meter rooftop farm in Brussels produces 35 metric tons of vegetables and 4 metric tons of fish annually, reaching retailers within two hours. Comparable pilots in Japan retrofit disused warehouses to improve access for aging rural populations that lack grocery options.
Commercialization of High-Value Medicinal Herbs
Herbs such as basil, mint, cilantro, and parsley already generate wholesale prices two to three times higher than lettuce, yet growers are pursuing ginseng, kratom, and cannabis for pharmaceutical and nutraceutical supply chains that demand contaminant-free inputs. These botanicals reach maturity in just three to six weeks, permitting rapid inventory turns and gross margins above 60.0%. Asia-Pacific’s traditional medicine sector is a critical off-take channel, while North American and European buyers emphasize traceability for regulated extracts.
Restraints Impact Analysis of Aquaponics Market*
| Restraint | (~) % Impact on CAGR Forecast | Geographic Relevance | Impact Timeline |
|---|---|---|---|
| High upfront capital and operational complexity | -2.1% | Global, most acute in emerging markets with limited project finance | Short term (≤2 years) |
| Zoonotic pathogen management risks | -1.3% | North America and Europe, where food-safety scrutiny is highest | Medium term (2-4 years) |
| Limited availability of skilled labor | -1.5% | Global, especially in rural zones and developing economies | Medium term (2-4 years) |
| Fragmented regulatory standards across markets | -1.4% | North America, Europe, Asia-Pacific, and Middle East with divergent rules | Long term (≥4 years) |
| Source: Mordor Intelligence | |||
High Upfront Capital and Operational Complexity
Commercial installations cost USD 500-1,000 per square meter, exceeding hydroponic equivalents by up to 50.0%, because integrated systems must harmonize fish tanks, biofilters, and climate management systems. Energy accounts for as much as 40.0% of operating budgets in temperate zones, and power outages can cause catastrophic fish mortality if backup generators fail. Payback often stretches beyond five years, a horizon that traditional agricultural lenders and venture capital find unattractive.
Zoonotic Pathogen Management Risks
Salmonella, Listeria, and Escherichia coli can migrate through shared water and contaminate produce if biosecurity measures are not followed. The United States Food and Drug Administration's Produce Safety Rule requirements, along with European Union microbial criteria, compel operators to adopt ultraviolet sterilization, ozone injection, and rigorous testing protocols, thereby inflating costs without generating additional revenue. Ambiguity in official guidance leaves smaller farms exposed to inconsistent audit interpretations.
*Our forecasts treat driver/restraint impacts as directional, not additive. The impact forecasts reflect baseline growth, mix effects, and variable interactions.
Aquaponics Market Segment Analysis
By Crop Type:
Herbs and Microgreens Expand Margins Faster Than Leafy GreensLeafy greens captured 46.3% of revenue in 2025, while herbs and microgreens are advancing at a 13.7% CAGR through 2031. Herbs mature in three to six weeks, versus eight to ten weeks for head lettuce, enabling faster cash rotation. Wholesale prices for basil, mint, and cilantro are two to three times higher than those for lettuce, reflecting the higher energy costs associated with climate-controlled environments. Tomatoes, cucumbers, and berries remain niche because they require precise calcium-to-magnesium balancing and pollination services, which increase labor inputs. Medicinal botanicals, including ginseng and kratom, require licensing and third-party potency assays, yet their margins can exceed 60.0% when supply contracts with pharmaceutical buyers are secured.
Additional expansion into strawberries, peppers, and Asian specialty vegetables is unfolding in the Asia-Pacific region, where rising disposable income underpins the willingness to pay for novelty and safety certifications. The International Organization for Standardization 22000 framework is increasingly stipulated in export contracts to Europe and Japan. Operators with diversified crop portfolios hedge against market volatility, but they must manage species-specific nutrient uptakes to avert deficiencies that can ripple through the integrated system.


By Fish Species:
Catfish Challenges Tilapia’s LeadTilapia held a 38.7% of the aquaponics market share in 2025, owing to robust tolerance for pH swings and variable temperatures.
Infinity Blue Barramundi LLC (MainStream Aquaculture Group) positions barramundi as a premium alternative, emphasizing its high omega-3 content and white, flaky flesh, which is ideal for upscale restaurants.
By Production Scale:
Modular Systems Democratize EntrySmall and medium-scale systems account for 61.5% of the aquaponics market size in 2025 and are projected to expand at a 13.3% CAGR through 2031, underscoring how modular kits lower barriers for urban entrepreneurs.
Large-scale systems above 50,000 square feet can require more than USD 5 million in capital but capture volume contracts with supermarket chains and institutional buyers. Superior Fresh LLC aggregates Atlantic salmon and leafy greens on its Wisconsin site, while Springworks Farm Maine, Inc.'s 500,000-square-foot complex targets hospitals and universities.
Geography Analysis
North America Aquaponics Market
North America led the aquaponics market in 2025, with a 34.2% revenue share, as consumers paid premiums for pesticide-free produce and state grants offset capital expenses for controlled-environment facilities. Activity concentrates in Wisconsin, California, and the Mid-Atlantic, where urban density keeps the distribution radius short. Canada’s Agricultural Clean Technology Program subsidizes retrofits in British Columbia and Ontario, regions that are particularly affected by high heating costs during the winter[4]Source: Government of Canada, “Agricultural Clean Technology Program,” canada.ca. Regulatory clarity is an advantage because the United States Department of Agriculture (USDA) allows organic labeling for aquaponic outputs, simplifying marketing and price positioning.
APAC Aquaponics Market
The Asia-Pacific region is the fastest-growing zone, with a 13.1% CAGR projected to 2031, as megacities face land scarcity and increasing food security mandates. China repurposes idle warehouses for integrated fish and plant hubs, while Japan funds community resilience pilots in rural prefectures. India’s clusters in Bangalore and Mumbai respond to food-safety concerns among middle-class consumers, and Australia promotes barramundi to differentiate from tilapia-heavy imports. South Korea is exploring rooftop systems in Seoul and Busan, although its urban agriculture policy is still in formation.
EMEA and South America Aquaponics Market
Europe’s investment trajectory aligns with the circular economy directives. Belgium’s BIGH rooftop farm proves that harvest-to-shelf times under two hours can be profitable. The United Kingdom’s Flo-Gro shrimp configuration widens species options, but inconsistent organic certification and elevated energy tariffs challenge Southern European operators. The Middle East and Africa utilize aquaponics to conserve scarce freshwater resources. The United Arab Emirates and Saudi Arabia blend desalination with solar power to reduce operating costs. South Africa pilots off-grid aquaponics in Cape Town and Johannesburg, while Brazil and Argentina nurture early-stage deployments in São Paulo and Buenos Aires, tempered by limited project finance and regulatory uncertainty.

Regulatory Landscape
Aquaponics operators often face split oversight across food safety, environmental discharge, and fish and wildlife rules, which keeps compliance jurisdiction-specific even within the same country. In the United States, leafy greens and herbs sold as raw agricultural commodities can fall under the FDA Produce Safety Rule (21 CFR 112), while broader Food Safety Modernization Act (FSMA) food-facility registration requirements apply when entities manufacture, process, pack, or hold food (with exemptions depending on activity and scale). This pushes commercial farms toward documented sanitation, traceability, and preventive controls that meet buyer and auditor expectations.
Environmental and aquatic-animal rules add another layer of permitting. The US EPA regulates discharges from qualifying aquaculture facilities through the Clean Water Act National Pollutant Discharge Elimination System (NPDES), linking some projects to discharge limits and monitoring even when they market themselves as recirculating and water-efficient. At the state level, rules such as Utah Administrative Rule R657-59c show how fish stocking and facility registration can be governed by wildlife authorities, reinforcing the need for site-by-site permitting roadmaps alongside third-party schemes such as USDA AMS Harmonized Produce GAP audits (including aquaponics-specific water sanitation expectations when water contacts edible portions).
Competitive Landscape
The aquaponics market remains highly fragmented in 2025, with key players including Superior Fresh LLC, ECF Farmsystems GmbH, Infinity Blue Barramundi LLC (MainStream Aquaculture Group), BIGH, and Springworks Farm Maine, Inc. This distribution renders the aquaponics market moderately concentrated because no single entity can dictate commodity pricing. Leaders pursue vertical integration that spans hatchery genetics, proprietary feeds, and direct distribution, thereby compressing supply-chain margins while securing volume commitments from grocery chains and institutional buyers.
Technology adoption differentiates players. Edge-connected sensor arrays and artificial intelligence analytics boost labor productivity by 20.0-30.0% and reduce fish mortality by flagging dissolved-oxygen drops in real-time. Springworks Farm Maine, Inc.'s predictive feeding software fine-tunes rations to ambient temperature fluctuations, resulting in lower feed conversion ratios and reduced waste. Intellectual property filings related to biofilter media and modular racking systems suggest an escalating competition to drive energy efficiency and simplify operating complexity.
Regions such as sub-Saharan Africa, Southeast Asia outside Singapore, and South America represent expansion corridors. However, scarce project finance and patchwork regulations limit rapid capacity additions. Smaller contenders chip away at incumbents by targeting hyperlocal delivery models and farmers’ markets that reward freshness and community branding. The absence of harmonized organic standards across jurisdictions fragments brand strategy and forces the development of tailored compliance roadmaps for each export market.
Aquaponics Industry Leaders
ECF Farmsystems GmbH
BIGH
Infinity Blue Barramundi LCC (MainStream Aquaculture Group)
Superior Fresh LLC
Springworks Farm Maine, Inc.
- *Disclaimer: Major Players sorted in no particular order
Aquaponics Market Companies Covered in this Report
- Superior Fresh LLC
- ECF Farmsystems GmbH
- Infinity Blue Barramundi LLC (MainStream Aquaculture Group)
- Traders Hill Farm
- Great Lakes Aquaponics
- Springworks Farm Maine, Inc.
- Bella Vita Farm LLC
- Waterfield Farms Inc.
- AquaSprout Farms, LLC
- Waterwheel Farms
- Victory Farms Ltd.
- Blue Acre Appalachian Aquaponics Center
- WaterFarmers Urban Agriculture (Sustainnovation Inc.)
- BIGH
- Deepwater Farms

Market Opportunities and Future Outlook
The core opportunity centers on cutting energy and labor risk while keeping food-safety assurance aligned with fish health, which raises demand for automation, water-treatment integration, and waste-to-energy designs in closed-loop facilities. A concrete research signal is the June 2026 Purdue University update on the When Blue is Green (BiG) project backed by a USD 10 million USDA grant, which tested grid-independent, zero-waste aquaponic configurations that combine components such as algal cultivation and anaerobic digesters. These approaches target two constraints flagged by operators, high operating costs in climate-controlled environments and the need for contingency performance during outages.
Policy and demonstration programs also shape adoption pathways beyond early urban pilots. In Europe, circular-economy and water-reuse themes are being operationalized through EU-backed projects such as AWARE (a CORDIS-listed initiative with a case study in Fasano, Italy, focused on aquaponics using reclaimed water), although practical scale-up can still hinge on regulatory clarity around reclaimed-water use. In Asia-Pacific, proposed frameworks such as the Philippines Senate Bill 1805 (Soilless Agricultural Production Act) that explicitly includes aquaponics suggest room for curriculum, extension support, and standardized adoption, which aligns with the segment shift toward premium herbs and microgreens and the report context showing broader use of audit-ready standards such as ISO 22000 in export contracts.
Recent Industry Developments in Aquaponics Market
- June 2026: Purdue University shared progress from the When Blue is Green (BiG) aquaponics initiative supported by a USD 10 million USDA grant, focusing on grid-independent, zero-waste system concepts that incorporate waste-to-energy elements. The work highlights how commercial projects are being engineered around energy resilience and tighter resource loops, constraints that often dominate operating budgets in controlled-environment production.
- October 2025: The Aquaponics Association partnered with Indoor Ag-Con to organize a specialized industry workshop scheduled for February 2026 in Las Vegas. The collaboration formalized a training and knowledge-transfer channel focused on commercial-scale practices and integration with controlled-environment agriculture supply chains, supporting more standardized operating playbooks for new entrants.
- June 2024: MainStream Aquaculture Group moved forward with binding transaction documents to acquire two aquaculture farm assets in Cardwell, Queensland, from Seafarms for AUD 13.5 million. Expanding barramundi production capacity strengthens the fish-side supply base that integrated aquaponics models rely on for consistent nutrient streams and premium protein positioning in foodservice channels.


Aquaponics Market Report Scope and Research Methodology
Market Definition and Coverage
For this study, the aquaponics market is defined as the value generated from integrated, recirculating systems that raise fish and grow plants together, where water is continuously filtered and reused to support plant growth.
Scope exclusions: We exclude conventional aquaculture, hydroponics-only farms, open ponds, and soil farms that only reuse fish tank water without a closed-loop recirculation setup.
Segments Covered in This Report
- By Crop Type
- Leafy Greens
- Herbs and Microgreens
- Tomatoes
- Cucumbers
- Berries
- Other Crops
- By Fish Species
- Tilapia
- Catfish
- Trout
- Other Fish
- By Production Scale
- Large-Scale
- Small and Medium-Scale
- By Geography
- North America
- United States
- Canada
- Rest of North America
- South America
- Brazil
- Argentina
- Rest of South America
- Europe
- Germany
- Netherlands
- France
- United Kingdom
- Italy
- Rest of Europe
- Asia-Pacific
- China
- Japan
- India
- Australia
- South Korea
- Rest of Asia-Pacific
- Middle East
- United Arab Emirates
- Saudi Arabia
- Rest of Middle East
- Africa
- South Africa
- Kenya
- Rest of Africa
- North America
Data Sources, Market Sizing, and Validation
Desk Research
Desk research was used to build the starting demand picture and keep unit assumptions realistic before we spoke with industry participants. We referenced public sources such as FAO fisheries and aquaculture statistics, USDA and related extension publications, Environment Protection Agency resources on water reuse and discharge rules, World Bank indicators for food and agriculture, and customs trade statistics where equipment flows can be directionally checked.
We also reviewed company websites and product brochures, public financial filings and investor presentations where available, peer reviewed articles on recirculating aquaculture systems and nitrification performance, and reputable press coverage of new farm builds and expansions. In addition, we used paid database subscriptions for company financials and intelligence, patent databases, and selective shipment-level trade checks to validate scale and timing. These examples are not exhaustive, and other public sources were used for cross-checking, data collection, and clarification.
Primary Interviews and Surveys
Primary conversations were completed with a mix of system manufacturers, farm operators, component suppliers, and technical consultants, followed by buyers such as commercial growers and community or education project leads. Respondent input was used to confirm what is counted as a true aquaponics installation, to validate typical system sizes, and to pressure-test pricing and utilization assumptions across regions.
Distribution of primary research fieldwork respondents
| Company type | Respondent position | Region |
|---|---|---|
| Top tier: 36% | CXOs: 18% | APAC: 46% |
| Mid tier: 45% | Functional/Unit leaders: 25% | EMEA: 34% |
| Smaller Players: 19% | Managers: 57% | Americas: 20% |
Market-Sizing & Forecasting
Sizing was built using a top-down approach where food production and controlled-environment adoption signals were reconstructed into an addressable pool for recirculating aquaponics, then filtered by practical installation rates by region. To keep results grounded, totals were corroborated with selective bottom-up approximations, such as sampled system counts by country, average build value by system size band, and channel checks on component bundles.
Key inputs included the pace of new facility additions, the split between commercial versus small-scale projects, typical CAPEX per installed system, recurring spend on inputs and maintenance, fish species and crop mix that influence density and throughput, and local constraints such as water scarcity and permitting. When direct counts were not available, gaps were handled with proxy indicators like greenhouse and indoor farming footprints, import patterns for core components, and expert-confirmed conversion ratios. For forecasting, we used scenario analysis supported by time-series smoothing of historical build activity, with assumptions reviewed and adjusted based on what interviewees expected for project pipelines, financing availability, and payback periods.
Data Validation & Update Cycle
Outputs were checked in multiple passes so the model stays consistent with independent signals such as facility announcements, equipment ordering cycles, and reported expansion timelines. When a country result looked too high or low, the drivers were re-opened, and follow-up questions were triggered to confirm pricing, utilization, and which revenue streams were actually realized.
Before sign-off, variance checks are run across regions and across the main demand variables, followed by an internal analyst review that challenges inputs that moved more than expected year over year. The report is refreshed annually, and interim updates are completed when material events occur, such as major policy changes, sharp cost shifts, or a visible change in project execution rates. Right before delivery, a final pass is done so the view reflects the latest publicly visible developments.
Mordor Intelligence's Aquaponics Market Sizing Compared With Other Published Estimates
Published market values for aquaponics do not always match because the counting rules behind them can be quite different, even when they use the same market name. The biggest reasons usually come from what revenue lines are included, which year is treated as the current point, and how fast new system additions are assumed to scale.
In aquaponics, the spread is often driven by whether estimates include only system equipment and components or also add ongoing farm output value, services, and smaller hobby installations, which can move the total quickly. Differences also show up when one model assumes aggressive price increases for sensors and controls, or when currency conversion timing is handled inconsistently during periods of inflation and supply chain volatility.
Benchmark comparison
| Source | Market Size | Gaps in Research Methodology |
|---|---|---|
| Mordor Intelligence | USD 1.20 B (2026) | |
| Global Consultancy A | USD 1.09 B (2024) | Uses an equipment-and-components framing and anchors the current market to a 2024 estimate, which can understate value when farm output, software, and input revenue streams are not consistently added. |
| Industry Publisher B | USD 1.84 B (2024) | Presents a broader 2024 total that appears to roll in services and ongoing operating spend across many system types, and the inclusion of non-commercial installations can lift the headline value versus strictly recirculating system revenue. |
The table shows that scope and year anchoring explain most of the gap, and the checks that mattered most were consistent system definitions and repeatable pricing and adoption assumptions. Counting only closed-loop installations and validating CAPEX plus recurring inputs separately keeps the estimate tied to what operators actually purchase and earn, a modeling choice applied by Mordor Intelligence.


Key Questions Answered in the Report
What is the 2026 valuation of the aquaponics market and its projected 2031 size?
The aquaponics market size stood at USD 1.2 billion in 2026 and is anticipated to reach USD 2.2 billion by 2031.
Which crop type is expanding fastest in commercial aquaponics facilities?
Herbs and microgreens are growing at a 13.7% CAGR to 2031 because their short cycles and premium prices boost margins.
Why is Asia-Pacific the fastest-growing region for aquaponics?
Land scarcity, food-security mandates, and sizable government grants drive Asia-Pacific’s 13.1% CAGR through 2031.
What limits rapid expansion of large-scale aquaponic farms?
Capital costs of USD 500-1,000 per square meter and the need for skilled labor delay payback periods beyond five years.
How do sensors and artificial intelligence improve aquaponic operations?
Real-time monitoring and predictive analytics cut labor needs by up to 30.0% and reduce fish mortality through early intervention.
Page last updated on:


 Your data is secure and never sold or shared.


