
Aprotic Solvents Market Size and Share
Market Overview
| Study Period | 2020 - 2031 |
|---|---|
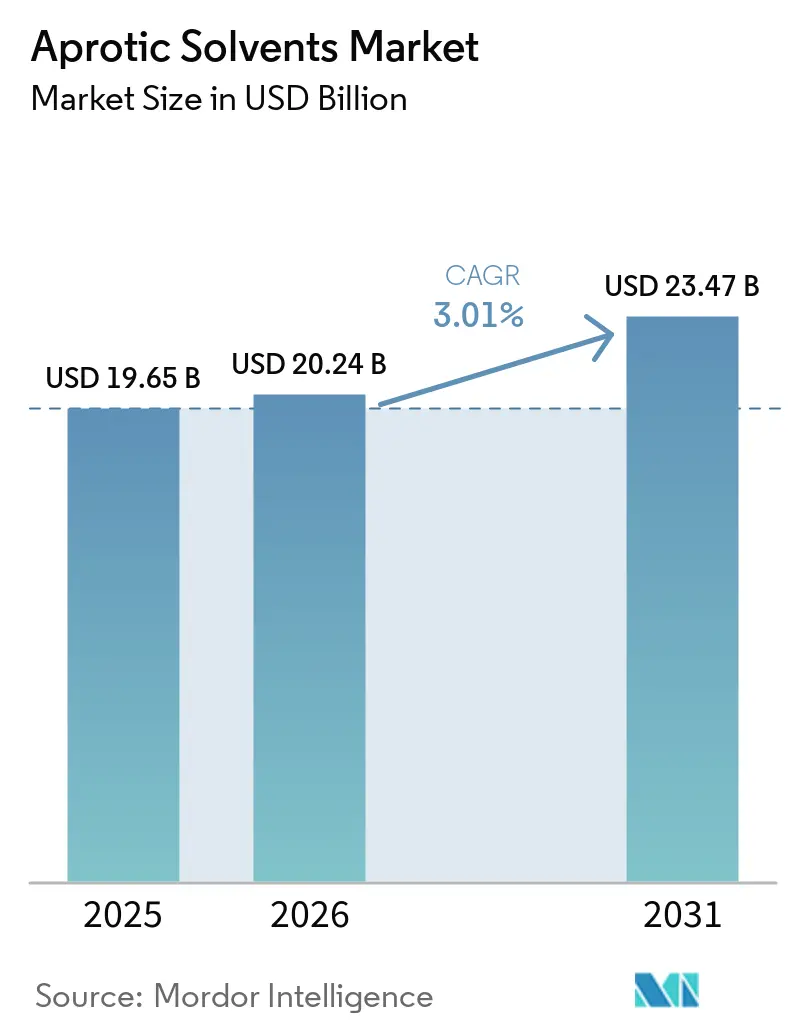
| Market Size (2026) | USD 20.24 Billion |
| Market Size (2031) | USD 23.47 Billion |
| Growth Rate (2026 - 2031) | 3.01 % |
| Fastest Growing Market | Asia Pacific |
| Largest Market | Asia Pacific |
| Market Concentration | Medium |
Major Players *Disclaimer: Major Players sorted in no particular order Image © Mordor Intelligence. Reuse requires attribution under CC BY 4.0. | |
Aprotic Solvents Market Analysis by Mordor Intelligence
The Aprotic Solvents Market size was valued at USD 19.65 billion in 2025 and estimated to grow from USD 20.24 billion in 2026 to reach USD 23.47 billion by 2031, at a CAGR of 3.01% during the forecast period (2026-2031). Capital expenditures in lithium-ion battery manufacturing, semiconductor fabs, and peptide-based active pharmaceutical ingredient (API) plants drive incremental volumes even as regulatory compliance costs put a ceiling on short-term growth. Integrated chemical producers are passing through higher energy and feedstock costs to end users, which is reshaping procurement strategies toward long-term supply agreements that guarantee purity and availability. The emergence of biomass-derived dipolar solvents such as Cyrene and gamma-valerolactone (GVL) is redefining competitive boundaries by adding sustainability performance as a formal evaluation criterion. Across applications, price elasticity remains low because most end uses depend on specific polarity and boiling-point requirements that are difficult to replicate with substitute chemistries, leading to continued reliance on legacy molecules despite tightening regulatory scrutiny.
Key Report Takeaways
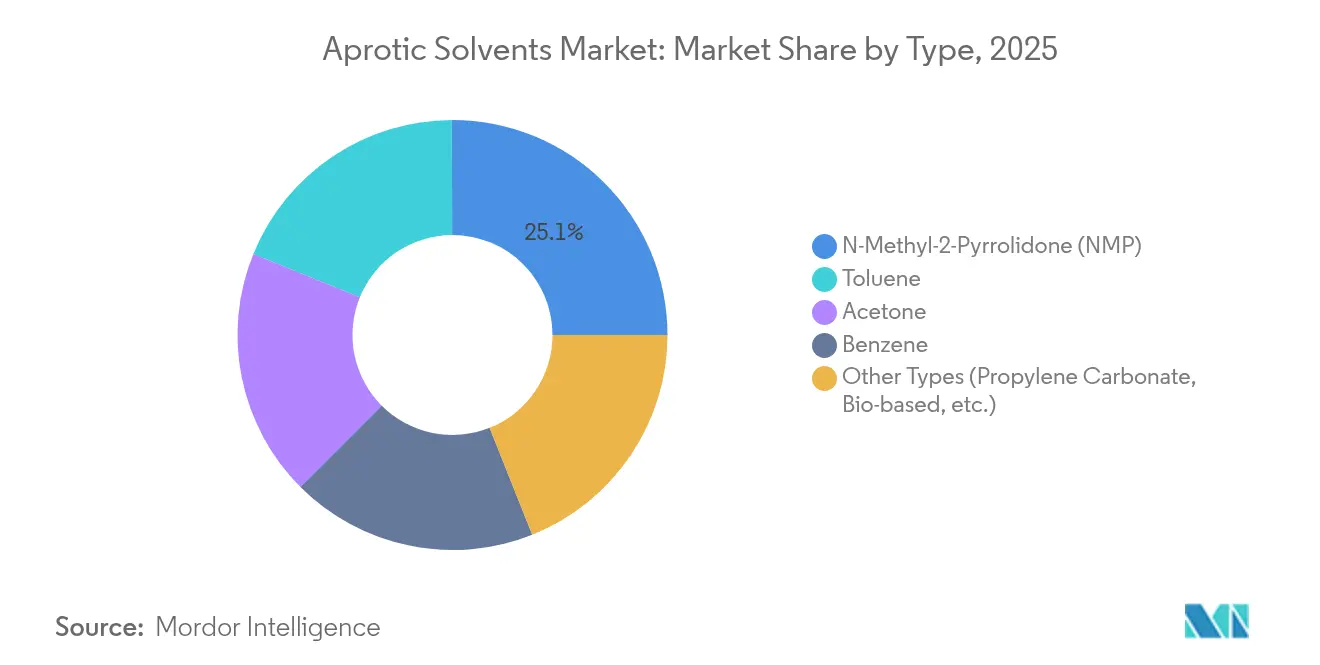
- By Type, N-Methyl-2-Pyrrolidone retained a 25.05% share of the aprotic solvents market in 2025, while the “Other Types” category led growth at a 3.70% CAGR through 2031.
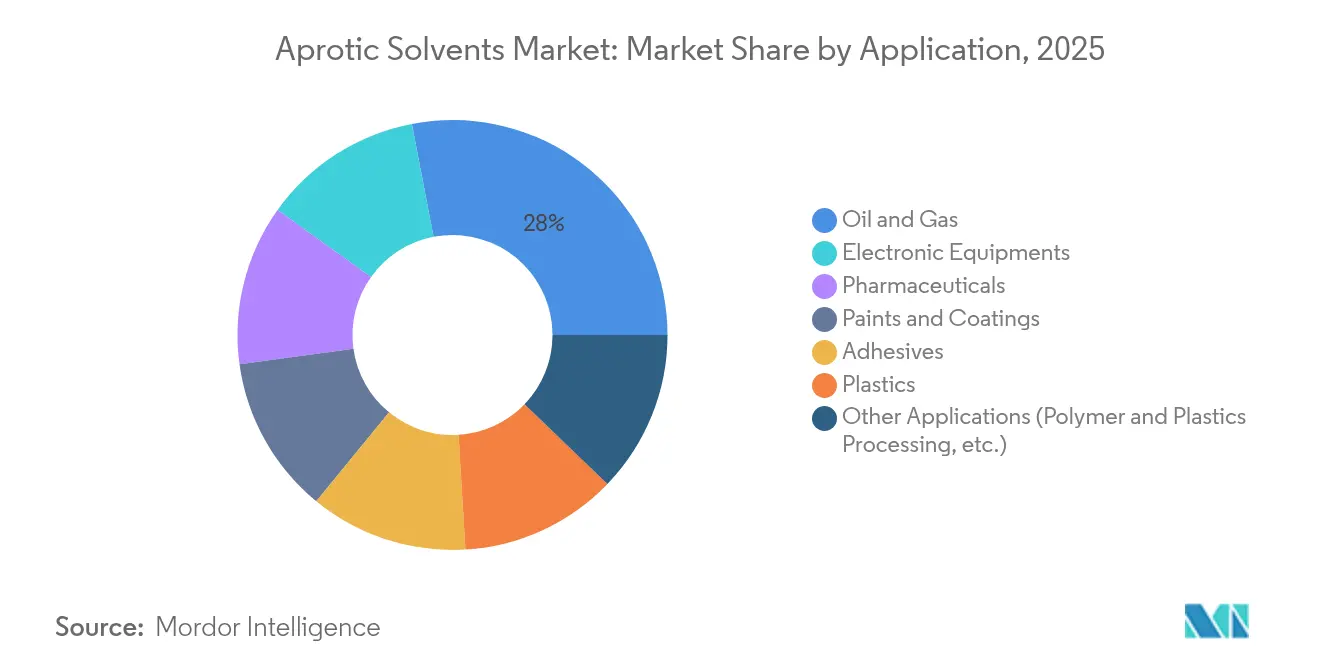
- By Application, Oil and Gas captured 28.03% of the aprotic solvents market size in 2025, and Electronic Equipment posted the highest 3.78% CAGR forecast to 2031.
- By Geography, Asia-Pacific commanded 53.15% of the aprotic solvents market share in 2025 and is advancing at a 3.55% CAGR to 2031.
Note: Market size and forecast figures in this report are generated using Mordor Intelligence’s proprietary estimation framework, updated with the latest available data and insights as of 2026.
Global Aprotic Solvents Market Trends and Insights
Drivers Impact Analysis*
| Drivers | (~) % Impact on CAGR Forecast | Geographic Relevance | Impact Timeline |
|---|---|---|---|
| Rapid capacity additions in Asian lithium-ion battery production | +0.8% | Asia-Pacific core, spill-over to North America | Medium term (2-4 years) |
| Persistent demand spike from deep-well oil and gas extraction fluids | +0.6% | Global, concentrated in North America and Middle East | Short term (≤ 2 years) |
| Pharmaceutical greenfield API capacity expansions (2025-2029) | +0.5% | Global, early gains in Europe and North America | Long term (≥ 4 years) |
| Regulatory relaxation for high-purity electronic-grade solvents in China | +0.3% | Asia-Pacific, primarily China | Medium term (2-4 years) |
| Emergence of biomass-derived dipolar aprotics (e.g., Cyrene®, GVL) | +0.4% | Europe and North America core, expanding globally | Long term (≥ 4 years) |
| AI-accelerated solvent selection platforms cutting formulation times | +0.2% | Global | Medium term (2-4 years) |
| Source: Mordor Intelligence | |||
Rapid Capacity Additions in Asian Lithium-Ion Battery Production
China’s battery gigafactory pipeline is on track to surpass 1,300 GWh per year of installed output by 2030, which raises annual N-Methyl-2-Pyrrolidone demand by 260,000–390,000 tons since each gigawatt-hour typically consumes 200–300 tons of solvent[1]. Regional producers negotiate multiyear supply agreements that lock in pricing formulas tied to petrochemical feedstock indices, a practice that mitigates volatility but strengthens buyer bargaining power. As cell makers push cathode energy densities higher, viscosity control requirements favor dipolar aprotics with narrow impurity specifications, further entrenching NMP. Complementary investments in electrolyte co-solvents, such as dimethyl carbonate (DMC) and ethyl methyl carbonate (EMC), reinforce cross-solvent demand correlation, benefiting vertically integrated firms. Nevertheless, cost-competitive water-based electrode processing that cuts material costs by 96% threatens late-decade volumes. Dry-film techniques under development add a parallel route that could remove solvent use entirely in some cathode lines
Persistent Demand Spike from Deep-Well Oil and Gas Extraction Fluids
Horizontal and ultra-deep reservoirs require completion fluids that remain stable at temperatures exceeding 200 °C and pressures above 20,000 psi. Dipolar aprotic solvents enable high-salt solubility and thermal stability that water-based fluids cannot match. North American shale projects and Middle Eastern carbonate formations together underpin most incremental uptake. Adoption of natural deep eutectic solvents (NADES) for less severe conditions provides an environmentally favorable pathway, yet still relies on aprotic backbones for extreme conditions. Continued innovation in calcium nitrate-based completion systems highlights ongoing chemistry diversification that nonetheless reinforces demand for compatible aprotic carriers. Short-term growth is secure because equipment retrofits required for alternative fluid chemistries carry capital costs that operators defer during current high-rig utilization cycles.
Pharmaceutical Greenfield API Capacity Expansions (2025–2029)
The peptide therapeutics boom, exemplified by CordenPharma’s EUR 900 million construction program, is boosting dimethylformamide and dimethylacetamide volumes in solid-phase synthesis steps. Each metric ton of GLP-1 agonist active requires roughly 5 tons of aprotic solvent across coupling, cleavage, and crystallization. Modular, single-use reactor trains installed in new facilities support higher solvent recovery rates yet maintain demand for virgin material because regulatory filings limit reuse to defined cycles. Continuous manufacturing pilots offer a 40% solvent intensity reduction but remain limited to low-volume specialty APIs. As regulatory agencies fast-track obesity drug approvals, production timelines shorten, and solvent demand scales in tandem, extending the driver into the long-term horizon.
Regulatory Relaxation for High-Purity Electronic-Grade Solvents in China
China’s State Administration for Market Regulation revised import licensing rules in 2024, easing access to ultra-low metal contaminant variants of NMP and dimethyl sulfoxide for semiconductor fabs. The policy accelerates domestic procurement cycles for new 300 mm wafer facilities and multi-layer chip packaging plants. Fabricators now source directly from foreign producers while local compounding blenders co-produce photoresist strippers customized to equipment specifications. This measure boosts aprotic solvents market volumes for cleaning and etching where parts-per-trillion impurity levels are mandatory. Medium-term impact is moderate, yet the driver solidifies Asia-Pacific’s command of specialty solvent flows.
Restraints Impact Analysis*
| Restraints | (~) % Impact on CAGR Forecast | Geographic Relevance | Impact Timeline |
|---|---|---|---|
| EU REACH re-classification of NMP, DMF and NEP as reproductive toxics | -0.7% | Europe core, global regulatory spillover | Short term (≤ 2 years) |
| Rapid scale-up of super-critical CO₂ and ionic-liquid extraction tech | -0.4% | Global, early adoption in pharmaceuticals | Medium term (2-4 years) |
| Volatility of crude-based feedstocks widening cost swings | -0.3% | Global, pronounced in Asia-Pacific and North America | Short term (≤ 2 years) |
| Accelerated OEM bans on residual aprotics in semiconductor fabs | -0.2% | Asia-Pacific core, spill-over to North America | Medium term (2-4 years) |
| Source: Mordor Intelligence | |||
EU REACH Re-classification of NMP, DMF and NEP as Reproductive Toxics
The European Commission’s addition of NMP, DMF, and NEP to Annex XVII introduces a 0.3% concentration limit in mixtures effective December 2026 and imposes employee exposure caps. Multinational manufacturers often adopt the strictest jurisdiction as their global default, extending compliance costs to plants beyond Europe[2]. Immediate capital outlays include closed-loop handling systems, personal exposure monitoring, and enhanced ventilation. Membrane module producers for water treatment face qualification delays because alternative dipolars change polymer morphology. While exemption dossiers are possible, the administrative burden pushes users to accelerate substitution projects.
Rapid Scale-up of Supercritical CO₂ and Ionic-Liquid Extraction Technologies
Commercial-scale supercritical CO₂ columns now handle up to 5,000 L per hour in hop extraction, pharmaceutical purification, and fine-chemical dewaxing. ]. Process economics improve as compression energy declines with advanced heat-exchange loops. Ionic liquids and deep eutectic solvents (DES) deliver dual functionality, acting as solvents and polymerizable feedstocks in bioplastic synthesis. As these routes move beyond pilot scale, they can obviate large volumes of traditional aprotic solvents, particularly in natural-product extraction and catalyst recycling. Although adoption is unlikely to eclipse incumbent applications entirely by 2030, progressive displacement is expected in greener value chains.
*Our forecasts treat driver/restraint impacts as directional, not additive. The impact forecasts reflect baseline growth, mix effects, and variable interactions.
Segment Analysis
By Type: NMP Dominance Faces Bio-Based Disruption
N-Methyl-2-Pyrrolidone accounted for 25.05% of the aprotic solvents market in 2025, underscoring its critical role in lithium-ion battery electrodes and high-performance polymer production. Despite EU classification pressure, cathode slurry rheology and polyimide precursor compatibility still favor NMP, sustaining premium pricing. Producers are installing additional purification trains that achieve 5 ppb metal specifications, catering to 3 nm node semiconductor fabs.
Parallel innovation in the “Other Types” category is reshaping competitive contours. Cyrene, GVL, and dimethyl isosorbide collectively lifted the group to the fastest 3.70% CAGR trajectory. Research published in 2024 confirmed GVL’s ability to maintain polyimide membrane tensile strength within 2% of NMP benchmarks while lowering toxicity classifications. This technical validation demonstrates diminishing performance barriers and suggests that new capacity additions, particularly in Europe, will be skewed toward bio-based molecules. Toluene and benzene segments continue to contract in advanced economies due to workplace exposure limits, while C2 chlorinated solvents face similar regulatory and substitution pressures. Acetone benefits from cross-sector versatility, shielding it from steep declines.

By Application: Electronic Equipment Emerges as Growth Engine
Oil and Gas remained the single largest end-use, capturing 28.03% of the aprotic solvents market size in 2025 as unconventional drilling spread into deeper reservoirs. These downhole environments demand thermal-stable dipolars that deliver viscosity control where water-based systems fail. Investment in steam-assisted gravity drainage and high-density completion fluids supports ongoing consumption, but cumulative volume growth is modest because process optimization curbs per-well solvent usage. Pharmaceuticals are leveraging peptide drug demand and the proliferation of continuous-flow reactors that improve yield yet still require large solvent make-up volumes.
Electronic Equipment outpaced all other segments with a 3.78% CAGR outlook to 2031. Each advanced logic chip involves over 500 distinct process chemicals, and ultra-clean aprotic solvents are integral to immersion lithography, residue stripping, and wafer edge cleaning. The CHIPS Act incentives bring fresh capacity online in the United States, triggering supplier qualification programs that favor long-term contracts. Emerging chiplet architectures and high-bandwidth memory stacks require narrower impurity windows, increasing solvent value-added content. Plastics, Paints and Coatings, and Adhesives maintain baseline demand yet experience margin pressure because industry clients substitute lower-hazard alternatives where feasible.
Geography Analysis
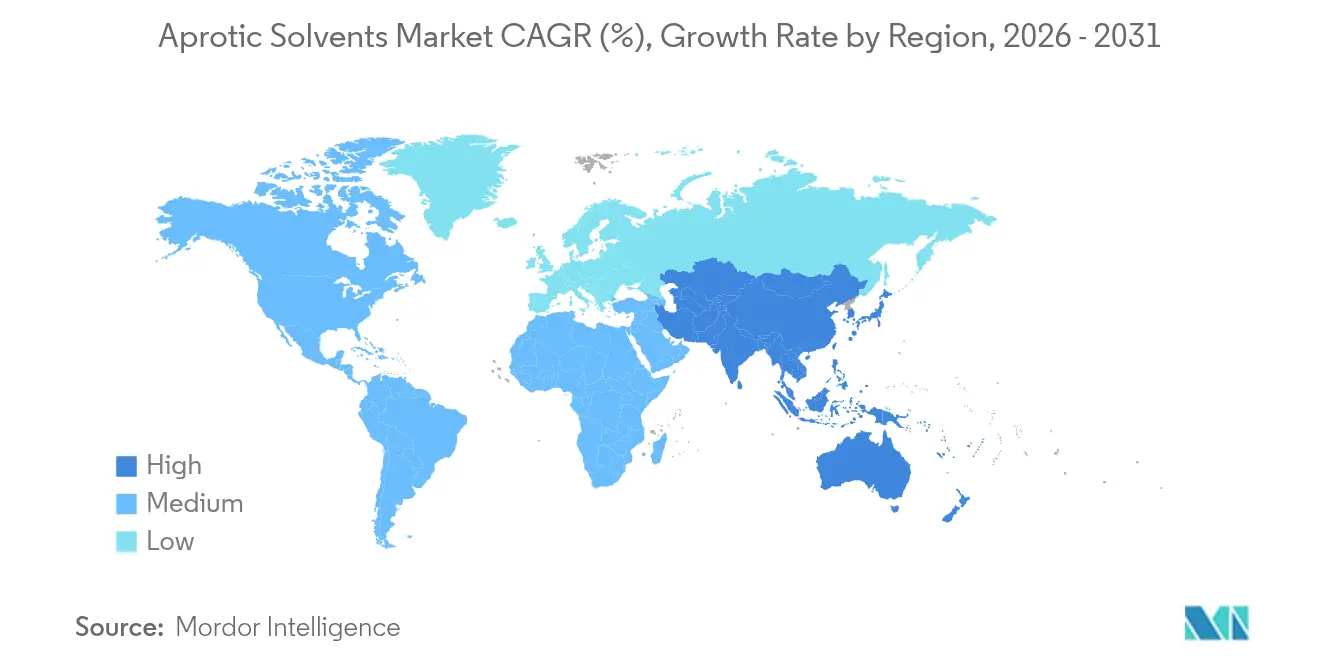
Asia-Pacific held 53.15% of global revenue in 2025 and is projected to record a 3.55% CAGR through 2031, anchored by China’s rapidly expanding battery value chain and Japan’s targeted investments in electrolyte production. Gigafactory clusters around Sichuan, Guangdong, and Jiangsu provinces secure upstream DMC and EMC supply, which drives intra-regional solvent trade flows. Policy support for domestic semiconductor capacity further broadens the user base for high-purity variants. Nevertheless, process innovation, such as kosmotropic aqueous cathode slurry processing that cuts solvent intensity by 96% could erode long-term volume dependence.
North America is driven by CHIPS Act-driven fab construction and sustained shale output that relies on aprotic drill fluids. The buildout of a 160 kiloton per year propylene oxide plant in Texas improves backward integration for acetone co-product streams. Pharmaceutical greenfield projects in Colorado and Massachusetts, specializing in GLP-1 APIs, add another solvent offtake node while regional distributors consolidate to streamline logistics.
Europe experiences the sharpest regulatory overhang as REACH restrictions tighten reproductive toxicity thresholds. Producers respond by installing closed-loop recovery equipment that reaches 95% capture and 99% purity, as showcased by turnkey systems achieving payback in under three years. Large integrated firms still invest, evidenced by BASF’s alkyl ethanolamine plant in Antwerp delivering 140,000 tons per year capacity. Europe’s influence as a regulatory trendsetter accelerates global harmonization around safer solvents, reshaping future product portfolios.
Regulatory Landscape
The European Union remains the most influential regulatory setter for dipolar aprotic solvents used in batteries, electronics, and pharmaceuticals. Under REACH, the European Commission advanced restrictions that place worker-protection requirements and mixture limits at the center of compliance planning, notably the 0.3% concentration limit in mixtures effective from 23 December 2026 for substances covered by Annex XVII updates (including DMAc and NEP), alongside DNEL-based workplace controls. ECHA reinforced enforcement readiness by publishing updated compliance guidance in March 2026 covering NMP (Entry 71), DMF (Entry 76), DMAc (Entry 80), and NEP (Entry 81), pushing users toward closed-loop handling, exposure monitoring, and faster substitution qualification in sensitive applications.
In the United States, NMP remains under TSCA Section 6(a) rulemaking activity following the June 2024 proposed rule, with a final rule still pending as of April 2026. Together, EU restriction timelines and US TSCA risk-management uncertainty are shifting procurement toward documented exposure controls, higher-purity grades for controlled processes, and more frequent evaluation of lower-hazard alternatives such as biomass-derived dipolar solvents when performance specifications allow.
Value Chain Analysis
Aprotic solvent value chains start from petrochemical feedstocks and co-product streams (including acrylonitrile-linked chains for acetonitrile, propylene oxidation routes influencing acetone availability, and intermediates tied to maleic anhydride hydrogenation for selected dipolar solvents). Production then moves through synthesis and purification, often including metal-ion reduction steps for electronic-grade material, followed by storage and distribution into end-user segments such as lithium-ion battery electrode processing, semiconductor cleaning and stripping, pharmaceutical synthesis, and oilfield completion fluids. Integrated producers with large petrochemical complexes tend to hold structural advantages in feedstock access and utilities, while specialty-grade suppliers compete on purification know-how, contamination control, and consistent lot traceability.
Distribution typically splits between direct supply to large battery makers and semiconductor fabs under long-term qualification and supply agreements, and channel partners serving more fragmented pharma and industrial customers. REACH-driven controls on solvents such as DMF and NMP are increasing the role of compliant packaging, dedicated tanks, and documented worker-safety practices across European supply chains, while electronics and battery customers are leaning toward regionalized sourcing and higher local inventory buffers to support purity assurance and logistics risk management. Supply chain strategies also include transitioning to alternative solvents or blends where regulatory exposure is highest, alongside incremental investment in recovery and recycling systems aimed at reducing net solvent consumption without compromising specification compliance.
Competitive Landscape
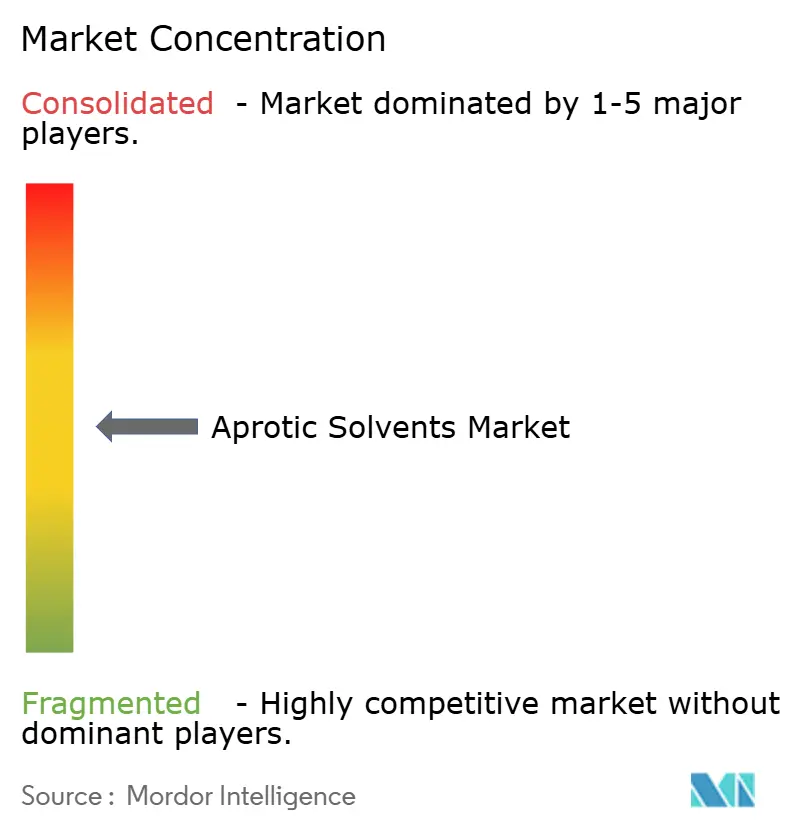
Global supply is moderately fragmented. Vertical integration into petrochemical feedstocks grants BASF, Dow, and INEOS scale advantages and refinery-grade naphtha access critical for cost leadership. Competitive success hinges on secure feedstock access, proprietary purification technology, and the agility to meet emerging sustainability criteria. Supply-chain resilience measures, including regional storage hubs and redundant production nodes, gain prominence as geopolitical uncertainties rise. Corporate climate pledges push firms toward green-power procurement and Scope 3 emission accounting, making end-to-end transparency a procurement prerequisite.
Aprotic Solvents Industry Leaders
-
Dow
-
Eastman Chemical Company
-
BASF
-
INEOS
-
LyondellBasell Industries Holdings B.V.
- *Disclaimer: Major Players sorted in no particular order
Market Opportunities and Future Outlook
One near-term whitespace is compliant, high-purity solvent systems for semiconductor manufacturing and other precision cleaning uses as regulatory thresholds tighten. In June 2026, the European Commission opened a six-week consultation on a proposed REACH Annex XVII amendment to reduce the NMP concentration limit in integrated circuit cleaning solvents from 8% to 0.1%, which increases demand for reformulated chemistries, validated replacements, and application engineering support for fabs and chemical formulators. Suppliers that can combine ultra-low metal contaminant specifications with documented exposure controls and traceability are positioned to capture qualification-driven share in electronic equipment processes that already operate with narrow impurity windows.
A second opportunity area is the scale-up and qualification of bio-based dipolar aprotics as drop-in or near-drop-in replacements where reprotox classifications restrict traditional molecules. The European Commission-funded ReSolute project targets industrial-scale Cyrene production at the Carling Saint-Avold platform in France, anchored by a 1,000 metric tonnes per year flagship plant, which provides a reference point for downstream users during substitution programs. Separately, US policy signals such as the July 2026 presidential proclamation granting targeted exemptions from certain 2024 HON Rule testing and monitoring requirements for some chemical facilities illustrate how producers are balancing emissions compliance with investment in lower-carbon portfolios, creating space for suppliers that can offer reduced-carbon-footprint variants alongside regulatory-ready product stewardship.
Recent Industry Developments
- July 2026: The European Commission opened a six-week consultation on a proposed REACH Annex XVII amendment targeting integrated circuit cleaning solvents, including a move to reduce the allowable NMP concentration from 8% to 0.1%. The consultation sharpened substitution timelines for electronics-grade cleaning formulations and increased the importance of pre-qualified alternative solvent systems and validated process windows for fabs and formulators.
- March 2026: BASF launched reduced product carbon footprint (rPCF) variants of N-methyl-2-pyrrolidone (NMP) and related intermediates (BDO, THF, PolyTHF) produced at its Ludwigshafen Verbund site. The rollout gives downstream customers in electronics, automotive, and chemicals a route to lower Scope 3 footprints without changing solvent chemistry, strengthening premium-grade differentiation beyond purity alone.
- July 2025: Dow confirmed permanent closures of selected upstream assets in Europe, including an ethylene steam cracker in Bohlen and chlor-alkali and vinyl assets in Schkopau, with wind-down beginning mid-2026 into 2027. The decision tightened attention on regional feedstock availability and prompted solvent buyers and producers to reassess European sourcing resilience, inventory positioning, and alternative supply routes.
Research Methodology Framework and Report Scope
Market Definition and Coverage
For this study, the aprotic solvents market is defined as revenues generated from commercially sold aprotic solvents used as process, reaction, or formulation media across major industrial and specialty applications, measured at the point of sale and reported in USD.
Scope exclusions: We exclude captive internal solvent transfers that are not priced as external sales, and we also exclude water and protic solvents even when they are used in the same end applications.
Segmentation Overview
- By Type
- N-Methyl-2-Pyrrolidone (NMP)
- Toluene
- Benzene
- Acetone
- Other Types (Propylene Carbonate, Bio-based, etc.)
- By Application
- Oil and Gas
- Pharmaceuticals
- Plastics
- Electronic Equipments
- Paints and Coatings
- Adhesives
- Other Applications (Polymer and Plastics Processing, etc.)
- By Geography
- Asia-Pacific
- China
- Japan
- India
- South Korea
- ASEAN Countries
- Rest of Asia-Pacific
- North America
- United States
- Canada
- Mexico
- Europe
- Germany
- United Kingdom
- France
- Italy
- Spain
- Russia
- NORDIC Countries
- Rest of Europe
- South America
- Brazil
- Argentina
- Rest of South America
- Middle-East and Africa
- Saudi Arabia
- South Africa
- Rest of Middle-East and Africa
- Asia-Pacific
Data Sources, Market Sizing, and Validation
Desk Research
Desk research is used to build the base structure of the market and to anchor assumptions that later get tested in interviews. We rely on public sources such as the US Energy Information Administration (energy and feedstock signals), USGS and similar national statistics portals (industrial production context), UN Comtrade (trade flows that help sanity-check supply and demand), and EPA and ECHA communications (restrictions that shift demand between solvent chemistries).
We also review peer reviewed chemistry and process journals to understand substitution trends, and we use company annual reports, investor decks, and press releases to capture capacity changes and application mix. For price and company financial context, we selectively reference paid subscriptions focused on company financials and intelligence, patent databases, and shipment-level import export tracking where it fits the market. These examples are illustrative, and many other sources are consulted for data collection, validation, and clarification during the work.
Primary Interviews and Surveys
Primary work is used to pressure-test what we built from public information, especially around regional price spreads, adoption changes, and where substitution is actually happening in practice. We speak with a balanced mix of producers, distributors, and downstream users across APAC, EMEA, and the Americas so our assumptions on volumes, pricing logic, and trade impacts can be confirmed and adjusted before final sign-off.
Distribution of primary research fieldwork respondents
| Company type | Respondent position | Region |
|---|---|---|
| Top tier: 37% | CXOs: 15% | APAC: 50% |
| Mid tier: 48% | Functional/Unit leaders: 25% | EMEA: 31% |
| Smaller Players: 15% | Managers: 60% | Americas: 19% |
Market-Sizing & Forecasting
Our sizing starts with a top-down build where production, trade, and downstream activity indicators are used to reconstruct the demand pool for aprotic solvents by region, then the totals are allocated using application level usage patterns. Once that shape is formed, the numbers are corroborated through selective bottom-up approximations, such as sampled price per kilogram assumptions applied to estimated volumes and channel checks on import intensity, which are then used to adjust any over or understatement.
Key inputs used in the model include crude oil and key petrochemical feedstock movements, regional operating rates and capacity additions for relevant solvent chains, import export balances for major producing and consuming hubs, and end use activity signals from paints and coatings, electronics manufacturing, pharmaceuticals, and oil and gas processing. Because pricing is a major swing factor, we apply an ASP progression that reflects contract versus spot behavior, regional energy pass-through, and product purity differences, and then we normalize everything into a single USD basis for the year.
Forecasts are generated using scenario analysis, where the demand path is linked to end use growth expectations and the likely pace of regulatory and substitution shifts, and then validated through expert consensus from interviews. When bottom-up checks are incomplete for smaller countries or niche applications, gaps are handled using proxy indicators like trade dependence, industrial output direction, and observed application mix in similar markets, before the final totals are locked.
Data Validation & Update Cycle
Validation is done through multiple checks so the story and the math match. We compare the model outputs against independent signals like net trade direction, capacity change announcements, and end-use activity, and then we review large variances at the country and application level before finalizing.
If a major assumption moves, such as a sharp price reset, a regulation that restricts a solvent family, or a sizable capacity event, we trigger re-contacts to confirm what changed and whether the impact is temporary or structural. Reports are refreshed annually, and interim updates are made when material events occur, followed by a final pre-delivery review so the latest inputs are reflected in the published view.
Mordor Intelligence's Aprotic Solvents Market Sizing Compared With Other Published Estimates
Published market sizes for aprotic solvents often differ, even when the topic name is the same, because the year basis, currency timing, and price build-up choices can move totals by a noticeable amount. The update cycle also matters since new capacity starts, restrictions, and short-term price resets are not captured at the same time by all sources.
In this market, the main gap drivers usually come from whether older price points are carried forward, whether the scope treats broad aromatics as part of aprotic solvents, and how regional mix is converted into a single USD value for the stated year. By tightening the refresh cadence for price and volume inputs and re-checking unusual trade and pricing swings before publication, Mordor Intelligence reduces drift that can occur when an estimate relies on older currency conversion timing or a flat ASP curve.
Benchmark comparison
| Source | Market Size | Gaps in Research Methodology |
|---|---|---|
| Mordor Intelligence | USD 20.24 B (2026) | |
| Industry Publisher A | USD 21.29 B (2025) | Uses a different base year and can reflect a broader product basket, with less transparency on how ASPs are updated across regions and how currency timing is applied to the stated year. |
| Global Publisher B | USD 14.03 B (2025) | Appears to apply a narrower demand pool and may exclude parts of the aromatics and ketones landscape, and differences in regional coverage and price normalization can compress the USD total. |
The spread across the three numbers is largely explained by timing and scope boundaries, followed by how prices are progressed and converted into USD for the reference year. When buyers align on the same year, included solvent families, and the ASP update approach, the remaining variance becomes much smaller and easier to interpret for planning.
Key Questions Answered in the Report
What is the current size of the aprotic solvents market?
The aprotic solvents market size reached USD 20.24 billion in 2026 and is projected to climb to USD 23.47 billion by 2031.
Which region holds the largest share of aprotic solvent demand?
Asia-Pacific accounts for 53.15% of global volume, led by China’s battery gigafactories and Japan’s electrolyte investments.
Why does N-Methyl-2-Pyrrolidone (NMP) remain dominant despite regulations?
NMP delivers unmatched cathode-slurry rheology and polymer compatibility, making immediate substitution in lithium-ion batteries technically difficult.
Which application segment is growing the fastest?
Electronic equipment, driven by semiconductor fabs and CHIPS Act incentives, is expanding at a 3.78% CAGR through 2031.
How are bio-based solvents impacting the market?
Commercial launches of Cyrene and gamma-valerolactone offer lower-toxicity drop-in alternatives, driving the “Other Types” segment at a 3.70% CAGR.