
Application Release Automation Market Size and Share
Market Overview
| Study Period | 2020 - 2031 |
|---|---|
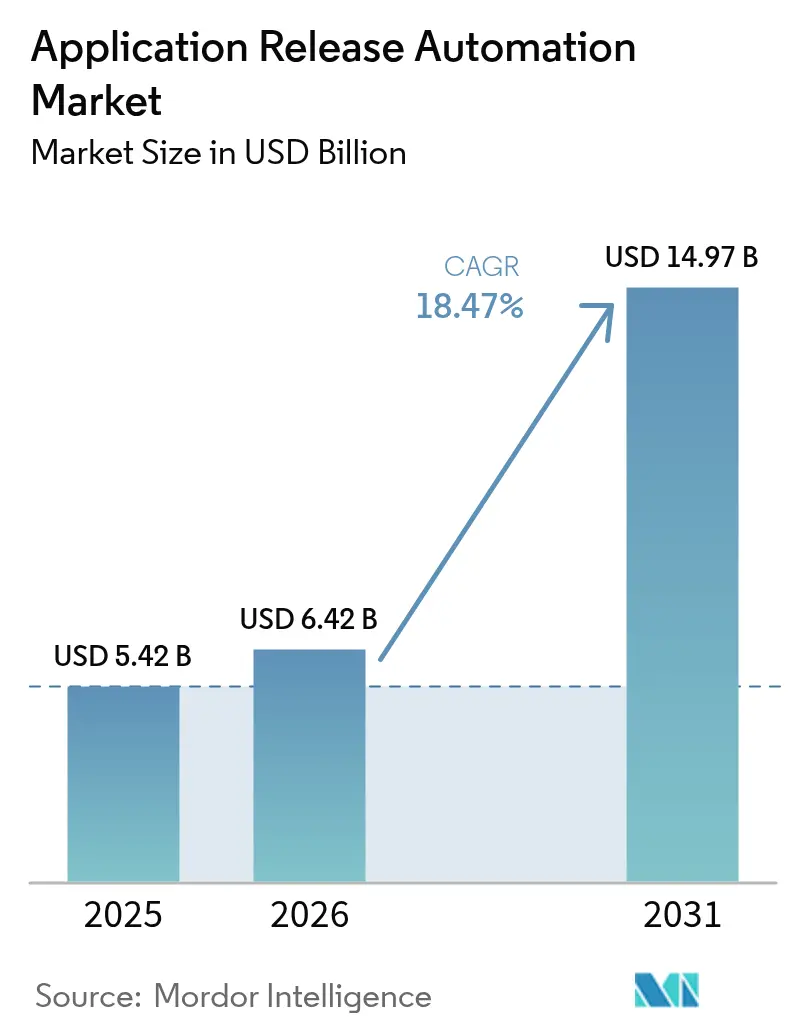
| Market Size (2026) | USD 6.42 Billion |
| Market Size (2031) | USD 14.97 Billion |
| Growth Rate (2026 - 2031) | 18.47 % |
| Fastest Growing Market | Asia Pacific |
| Largest Market | North America |
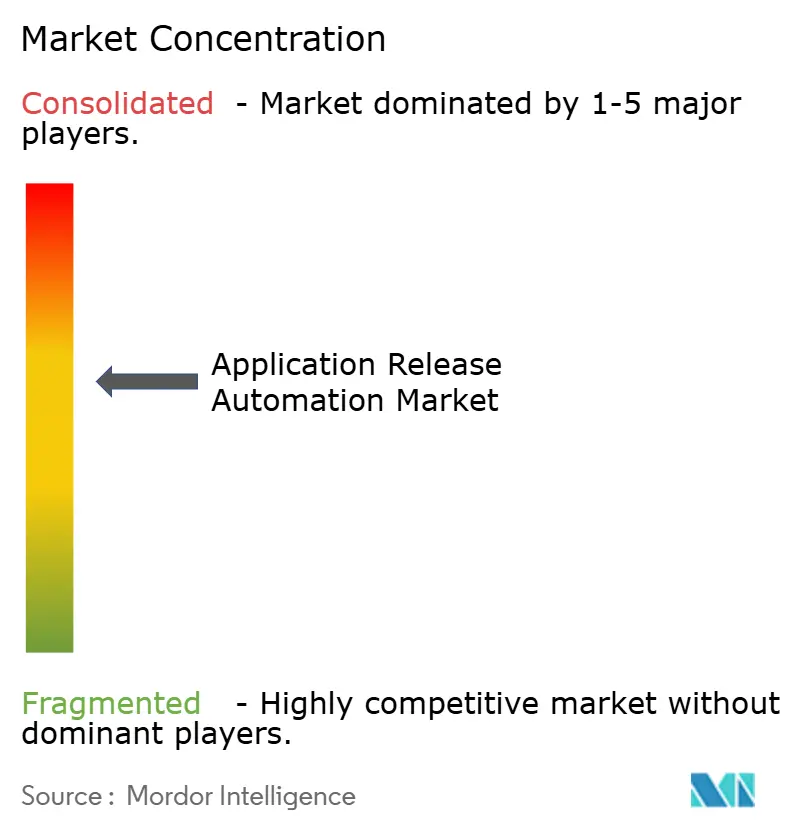
| Market Concentration | Medium |
Major Players *Disclaimer: Major Players sorted in no particular order Image © Mordor Intelligence. Reuse requires attribution under CC BY 4.0. | |
Application Release Automation Market Analysis by Mordor Intelligence
Application Release Automation market size in 2026 is estimated at USD 6.42 billion, growing from 2025 value of USD 5.42 billion with 2031 projections showing USD 14.97 billion, growing at 18.47% CAGR over 2026-2031. The surge is propelled by CIO-level mandates to institutionalize pipeline-as-code practices, GenAI-enabled orchestration that cuts deployment windows, and mounting software bill of materials (SBOM) compliance requirements. Enterprise buyers shift from manual runbooks to AI-driven, policy-as-code platforms able to support tens of thousands of releases per year, while multi-cloud microservice adoption drives demand for coordinated releases that span public, private, and on-premises estates. Simultaneously, a platform-as-a-product culture recasts central IT from ticket-based support into internal product teams that deliver reusable self-service components, unlocking developer productivity and compressing mean-time-to-resolution across the application release automation market. [1]
Key Report Takeaways
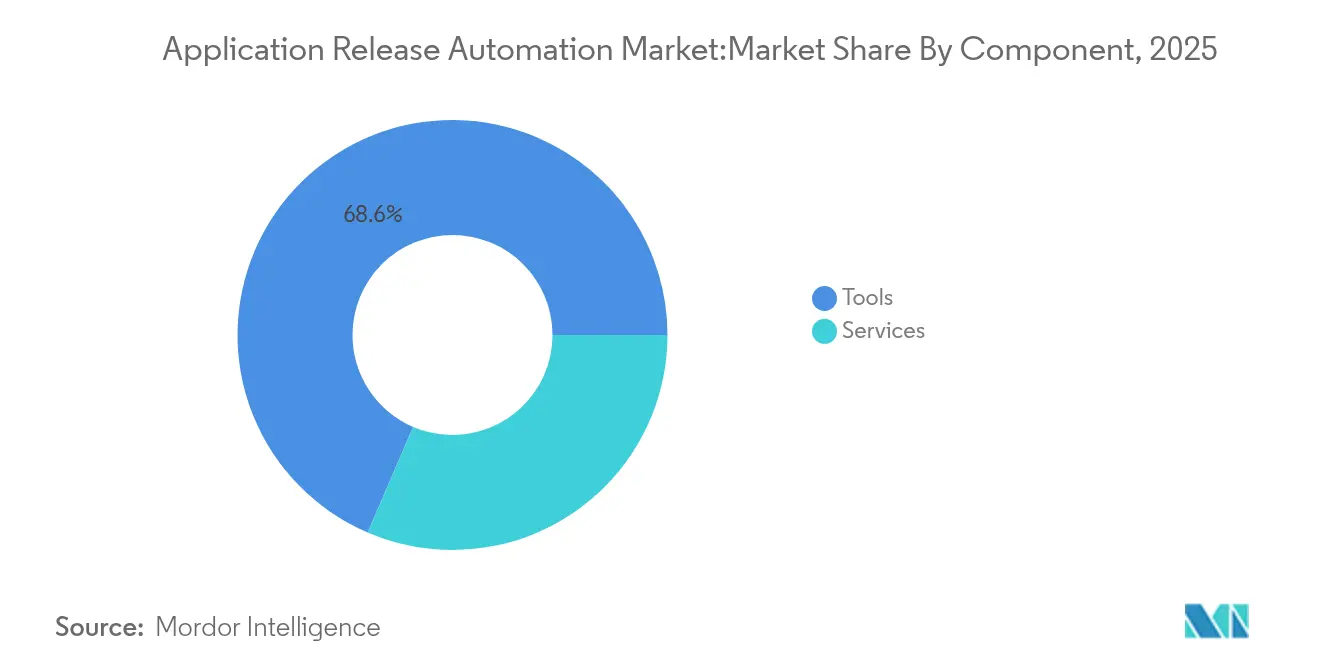
- By component, tools commanded 68.55% of the application release automation market share in 2025, while services are projected to expand at a 21.12% CAGR through 2031.
- By deployment mode, cloud deployments held 58.65% share of the application release automation market size in 2025; hybrid configurations are projected to grow at 20.37% CAGR.
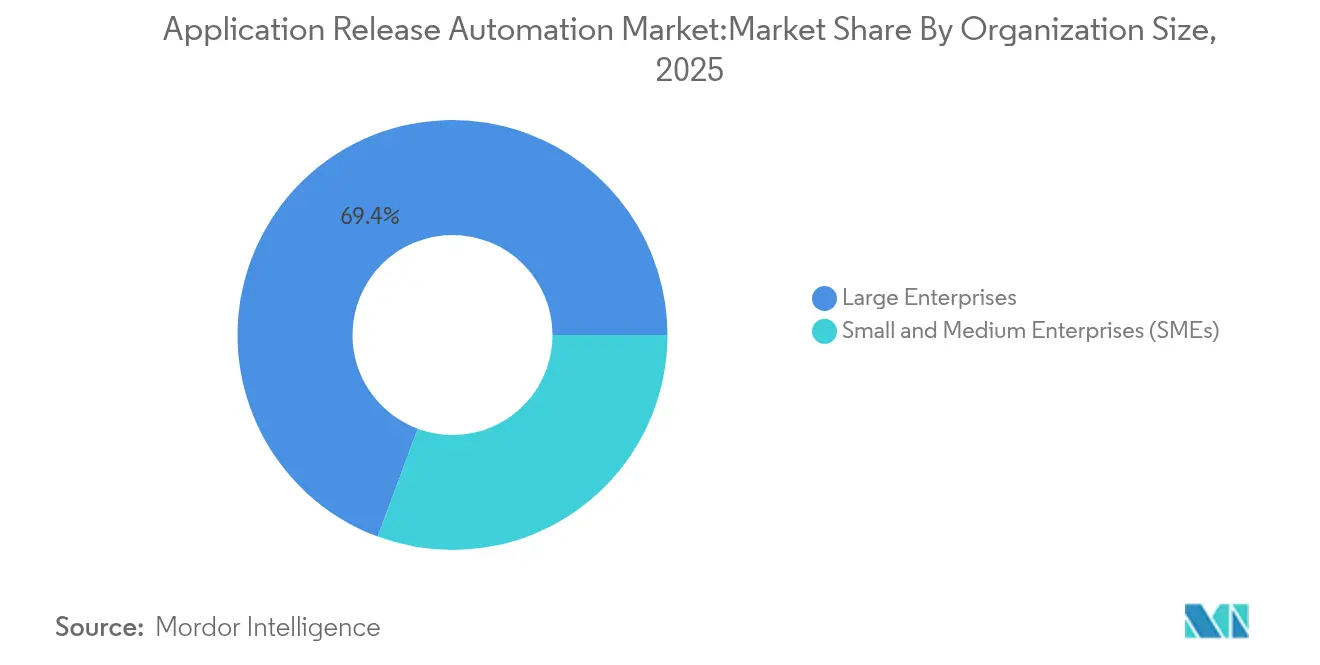
- By organization size, large enterprises represented 69.35% revenue share in 2025, whereas SMEs post the fastest 21.34% CAGR to 2031.
- By end-user industry, IT and telecommunications contributed 27.95% of 2025 revenue; BFSI is set to outpace all verticals at 20.08% CAGR through 2031.
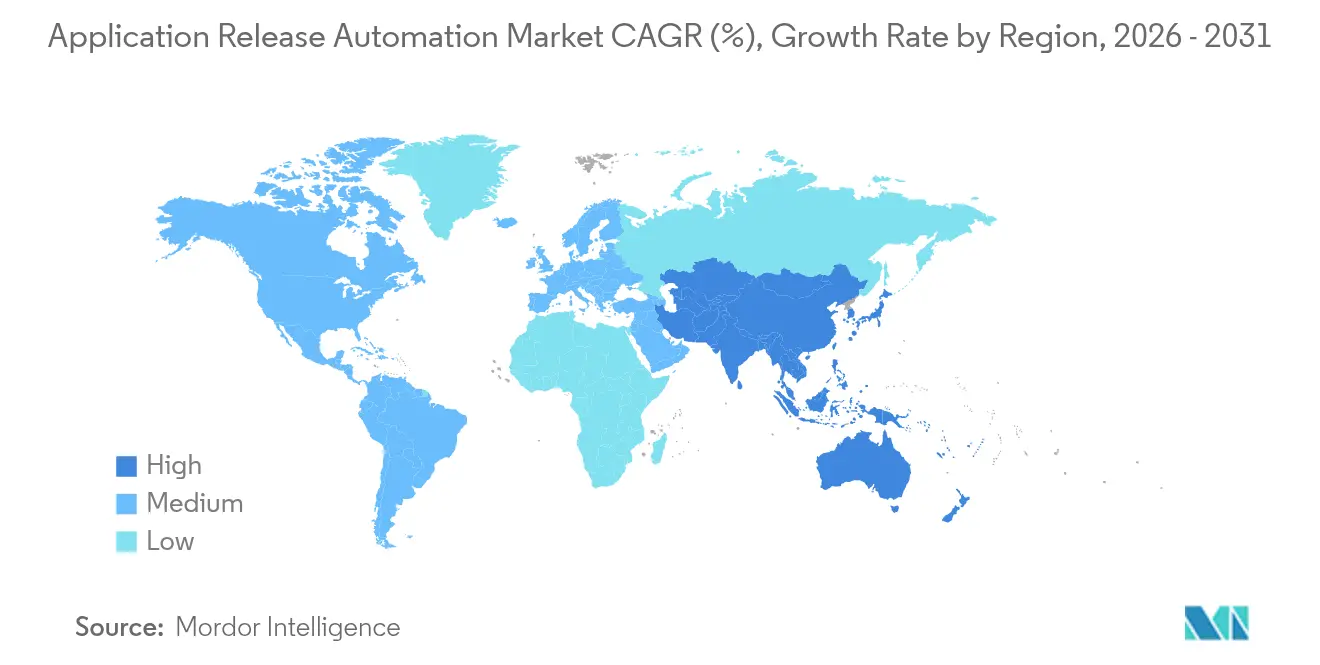
- By geography, North America accounted for 38.15% of 2025 revenue, although Asia-Pacific leads growth at 20.86% CAGR.
Note: Market size and forecast figures in this report are generated using Mordor Intelligence’s proprietary estimation framework, updated with the latest available data and insights as of 2026.
Market Trends and Insights
Drivers Impact Analysis of Application Release Automation Market*
| Driver | (~) % Impact on CAGR Forecast | Geographic Relevance | Impact Timeline |
|---|---|---|---|
| CIO shift to pipeline-as-code and platform engineering | +4.2% | Global; early adoption in North America and Europe | Medium term (2-4 years) |
| Surge in multi-cloud microservices driving release frequency | +5.1% | Global; spill-over to APAC core markets | Short term (≤ 2 years) |
| GenAI-powered release orchestration slashing failure rates | +3.8% | North America and EU; expanding to APAC | Medium term (2-4 years) |
| Software bill of materials compliance mandates | +2.7% | North America, EU regulatory zones | Short term (≤ 2 years) |
| Rise of “platform-as-a-product” culture | +3.4% | Global enterprise markets | Long term (≥ 4 years) |
| Source: Mordor Intelligence | |||
CIO Shift to Pipeline-as-Code and Platform Engineering
Three in four global corporations have instituted platform teams that standardize golden-path deployment templates and self-service infrastructure portals. BSH Home Appliances rebuilt its delivery stack around an internal developer platform and recorded substantial incident reduction because teams no longer hand-crafted infrastructure. The strategic shift removes toil, embeds governance in reusable modules, and boosts developer onboarding speed, reinforcing sustained growth in the application release automation market.
Surge in Multi-Cloud Microservices Driving Release Frequency
A microservices architecture often multiplies release events by 10–20× compared with monoliths, creating an operational imperative for automated gating, service mesh routing, and unified observability across disparate clouds. Airbnb’s Kubernetes fleet processes more than 125,000 releases annually through multicluster pipelines, underscoring why enterprises invest in sophisticated release orchestration.
GenAI-Powered Release Orchestration Slashing Failure Rates
Platforms now embed conversational agents that auto-generate pipelines, predict roll-back triggers, and summarize alerts. Harness’ AI engine automatically maps dependencies and proposes remediation, enabling United Airlines to accelerate deployments by 75%. Similar advances from Cutover’s AI runbooks allow real-time risk scoring, cutting post-release incident investigation hours.
Software Bill of Materials Compliance Mandates
SBOM regulations accelerate automation budgets because continuous disclosure requirements cannot be met manually at scale. The US Army requires vendors to provide machine-readable SBOMs as of February 2025, pushing suppliers to integrate automated inventory generation directly into CI/CD workflows. Sonatype reports that 92% of large enterprises have already adopted or plan to adopt SBOM processes.
Restraints Impact Analysis of Application Release Automation Market*
| Restraint | (~) % Impact on CAGR Forecast | Geographic Relevance | Impact Timeline |
|---|---|---|---|
| Legacy monolith dependencies in regulated sectors | -2.8% | Global; concentrated in BFSI and healthcare | Long term (≥ 4 years) |
| Tool-chain sprawl inflating DevSecOps complexity | -3.2% | North America and EU enterprises | Medium term (2-4 years) |
| Shortage of platform-engineering talent | -2.1% | Global; acute in APAC | Medium term (2-4 years) |
| Security gaps in secrets management | -1.9% | Global; critical in regulated industries | Short term (≤ 2 years) |
| Source: Mordor Intelligence | |||
Legacy Monolith Dependencies in Regulated Sectors
Mainframes and tightly coupled transactional systems hinder automated pipelines because change windows remain restricted and interface adapters are scarce. GitLab and IBM now let CI/CD stages run natively on z/OS to alleviate this constraint, yet full modernization remains a decade-long journey for many banks.
Tool-Chain Sprawl Inflating DevSecOps Complexity
North American CISOs report juggling upward of 50 security and release tools, driving license costs, and integration overhead. Infoblox cut its tooling footprint by two-thirds after adopting a unified DevOps platform from Opsera, achieving a 40% quality uptick and freeing eight developers for higher-value work.
*Our forecasts treat driver/restraint impacts as directional, not additive. The impact forecasts reflect baseline growth, mix effects, and variable interactions.
Application Release Automation Market Segment Analysis
By Component:
Services Acceleration Drives Platform TransformationTools accounted for 68.55% of 2025 revenue, illustrating that enterprises still rely on proven commercial platforms to automate deployment workflows. However, the services segment is forecast to grow at 21.12% CAGR, the highest across all components, as organizations realize that operating models, governance, and cultural change determine project success. The application release automation market size for services is projected to surge, especially within regulated industries that require specialized compliance expertise.Adoption trends show platform-as-a-service offerings that bundle managed services with orchestration software. Platform.sh’s USD 140 million Series D provides capital to scale fully managed environments that abstract infrastructure complexities. As enterprises pursue end-to-end transformation, consulting, integration, and managed runbook services increasingly dominate new spending, reinforcing services’ expanding share of the application release automation market.

By Deployment Mode:
Hybrid Configurations Surge Amid Multi-Cloud ComplexityCloud deployments dominated with a 58.65% application release automation market share in 2025, but hybrid models are accelerating at 20.37% CAGR because enterprises need to safeguard sensitive workloads while exploiting public-cloud elasticity. The application release automation market size attached to hybrid deployments is predicted to double by 2031 as orchestration tools mature to provide consistent policy enforcement across environments.VMware Tanzu and similar platforms supply consistent Kubernetes runtimes across on-premises and public clouds, while Rundeck automates operational hand-offs for more than 400 critical applications at Standard Chartered Bank, cutting mean-time-to-repair by 25 minutes per incident. Demand for hybrid orchestration demonstrates that large enterprises prioritize risk mitigation and locality constraints but refuse to compromise on release velocity.
By Organization Size:
SME Momentum Challenges Enterprise DominanceWhile large enterprises control 69.35% of revenue, SMEs post a 21.34% CAGR due to SaaS delivery models. The application release automation market size for SMEs remains small today, yet GenAI-assisted pipelines and no-code interfaces broaden access, allowing firms with limited DevOps staffing to achieve near-enterprise deployment frequency.GoSpotCheck used Harness SaaS to stand up microservices pipelines that pushed code multiple times a day without hiring in-house release specialists. As pricing tiers decline and onboarding becomes wizard-driven, growth momentum in the SME segment will continue eroding the traditional dominance of Fortune 500 buyers within the application release automation market.
By End-user Industry:
BFSI Growth Outpaces IT Sector LeadershipIT and telecommunications held 27.95% of the application release automation market share in 2025, reflecting technology-native capabilities. Yet BFSI grows faster at 20.08% CAGR because compliance obligations and digital banking initiatives force automation. IDFC FIRST Bank saved USD 5 million annually by migrating 800 applications via a DevSecOps framework, validating ROI at scale.Banks modernize monoliths by overlaying microservice gateways and automated quality gates, while insurers deploy feature-flag platforms to run controlled experiments in production. These trends attract specialized vendors offering policy engines and audit trails, contributing to enduring BFSI momentum inside the application release automation market.
Geography Analysis
North America, APAC and Europe Application Release Automation Market
North America led with 38.15% revenue in 2025, owing to mature cloud adoption and an ecosystem of venture-backed DevOps platforms. Citi slashed release cycles from several days to seven minutes using AI-driven continuous deployment, illustrating best-in-class implementation maturity.Asia-Pacific posts the fastest 20.86% CAGR because governments invest aggressively in AI and data-center expansion. MetLife Asia integrated Azure DevOps to cut build times from eight hours to under one hour while raising code quality. DBS Bank used Puppet to shrink provisioning from days to minutes, proving that regional skill sets now match Western counterparts. Europe advances steadily as GDPR and SBOM mandates force modernization. Siemens achieved 90% touchless document processing with AI-powered automation, confirming industrial players’ appetite for software-defined operations. Cross-border financial entities spearhead microservice adoption to remain regulatory-compliant yet agile, sustaining demand across the application release automation market.
Regulatory Landscape
Application release automation increasingly intersects with software-supply-chain and AI governance requirements, which is pushing buyers toward policy-as-code controls, auditable pipelines, and more secure update mechanisms. In the United States, NIST updated the Secure Software Development Framework with SP 800-218 Rev. 1 (SSDF v1.2) in December 2025, and in March 2026 NIST NCCoE published draft DevSecOps practices documentation that outlines how to standardize and automate security controls inside CI/CD workflows.
Federal signals also shifted in 2026. OMB issued Memorandum M-26-05 (February 2026) rescinding prior government-wide secure software development attestation memoranda, moving assurance toward agency-specific requirements, while the White House issued NSPM-12 (June 2026) directing National Security Systems to meet cybersecurity standards and prompting updated cloud security directives via CNSS. In Europe, the EU AI Act (Regulation (EU) 2024/1689) advances obligations for high-risk AI systems, reinforcing demand for release platforms that can maintain technical documentation, record-keeping, and risk controls when AI is used across development and deployment workflows.
Value Chain Analysis
The value chain begins with cloud infrastructure, container platforms, and developer toolchains (source control, CI, artifact repositories, and testing frameworks), then moves into release orchestration, environment and configuration management, and production operations such as incident response and rollback. Platform engineering teams and SIs connect these layers into internal developer platforms, while managed services providers operate pipelines and runbooks for regulated and hybrid estates. Vendors increasingly distribute through SaaS marketplaces and partner ecosystems, with packaged workflows, connectors, and reusable automation components.
Upstream, hyperscalers and platform vendors are inserting agentic capabilities closer to the control plane, which changes how ARA products are built and consumed. AWS made the AWS DevOps Agent generally available in March 2026 and expanded release-management capabilities in July 2026, while Harness launched Autonomous Worker Agents in June 2026 and GitLab introduced governed agentic automation in GitLab 19.2 in July 2026, including audit reporting features. Downstream, governance, identity, and policy enforcement are becoming core purchase criteria, making auditability, job-scoped credentials, and controlled agent execution key differentiators alongside deployment speed and reliability.
Competitive Landscape
Market dynamics reveal moderate consolidation as vendors race to embed AI and security into unified platforms. IBM’s USD 6.4 billion HashiCorp acquisition grants Terraform and Vault to its hybrid-cloud suite, while Perforce’s Puppet deal strengthens infrastructure-as-code depth. Harness broadened its stack with Armory and Split Software buys and now exceeds USD 100 million in annual recurring revenue. [4]
Competitive differentiation tilts toward AI co-pilots, SBOM automation, and secrets lifecycle management instead of traditional CI/CD checklists. GitLab integrated mainframe pipelines for IBM Z, extending DevOps reach to regulated back-ends. Opsera and OpsMx emphasize tool-chain consolidation, helping customers trim duplicate spend while boosting compliance.
White-space remains in industry-specific compliance tooling—health-care GxP pipelines or automotive functional-safety workflows—and in GenAI-enabled remediation that autonomously fixes failed releases. Start-ups addressing secrets sprawl, such as Infisical, gain traction as enterprises recognize that leaked credentials remain the top cloud breach vector, ensuring an active innovation funnel within the application release automation market.
Application Release Automation Industry Leaders
-
Broadcom Inc. (CA Automic)
-
IBM Corporation
-
Microsoft Corporation
-
BMC Software Inc.
-
Micro Focus International Plc
- *Disclaimer: Major Players sorted in no particular order
Application Release Automation Market Companies Covered in this Report
- Broadcom Inc. (CA Automic)
- IBM Corporation
- Microsoft Corporation
- BMC Software Inc.
- Micro Focus International Plc
- Digital.ai Software Inc.
- GitLab Inc.
- CloudBees Inc.
- Red Hat Inc. (Ansible)
- Atlassian Corporation Plc
- Perforce Software Inc. (Puppet & Chef)
- Octopus Deploy Pty Ltd
- Harness Inc.
- JFrog Ltd.
- CircleCI Inc.
- JetBrains s.r.o.
- Amazon Web Services Inc. (CodeDeploy)
- Google LLC (Cloud Deploy)
- Oracle Corporation
- ServiceNow Inc.
- Flexagon LLC
- DeployHub Inc.
- Armory Inc. (Spinnaker)
- AutoRabit Holdings Inc.
- Copado Solutions S.L.
Market Opportunities and Future Outlook
A primary opportunity is the move from deterministic pipelines to governed agentic automation that covers release testing, validation, remediation, and operational hand-offs with built-in controls. In 2026, multiple major platforms productized this shift: AWS announced general availability of AWS DevOps Agent in March 2026 and added Release Readiness Review and Autonomous Release Testing capabilities in July 2026, Harness launched Autonomous Worker Agents in June 2026, and GitLab 19.2 added agentic automation plus AI audit event reporting in July 2026. This supports whitespace for enterprise-wide standardization of agent behaviors, including policy constraints, approvals, and audit trails, across hybrid environments and regulated industries.
Another opportunity lies in software delivery governance and consolidation, where enterprises reduce tool-chain sprawl by embedding security and compliance checks into the delivery platform rather than layering point solutions. M&A and partnerships in 2026 support this direction, including Harness acquiring Codecov (June 2026) to integrate coverage intelligence into delivery governance and Infosys partnering with Harness (April 2026) to industrialize agentic software delivery within modernization programs. Buyers with mainframes and tightly controlled change windows also present a modernization lane, as vendors extend DevSecOps and orchestration patterns into legacy platforms and controlled environments, increasing demand for services that combine workflow automation, audit requirements, and hybrid connectivity.
Recent Industry Developments in Application Release Automation Market
- July 2026: BMC announced new capabilities for governed AI agents and assistants to interact securely with Control-M workflows across mainframe, cloud, and hybrid environments. The update ties AI assistance to enterprise workflow automation with controls aimed at safe operation in production release and batch contexts, supporting modernization programs that depend on predictable scheduling and auditable change.
- June 2026: Harness acquired Codecov from Sentry to bring coverage intelligence into the Harness Software Delivery Platform. The deal strengthens delivery governance by connecting test coverage signals more directly to deployment decisions and risk controls, tightening feedback loops for teams running frequent releases at scale.
- May 2024: Broadcom launched Automic SaaS to deliver workload automation and orchestration as a cloud service. The move expanded consumption options for enterprises standardizing automation across distributed environments, complementing on-premises deployments with a SaaS operating model that can simplify upgrades and central administration.
Application Release Automation Market Report Scope and Research Methodology
Market Definition and Coverage
For this methodology, the market covers commercial tools and related services used to plan, orchestrate, and automate application releases, from build and packaging through deployment into production across on-premises, cloud, and hybrid environments.
Scope exclusions: Custom in-house scripts built only for a single enterprise and not sold as a product or service are not counted.
Segments Covered in This Report
- By Component
- Tools
- Services
- By Deployment Mode
- Cloud
- On-Premises
- Hybrid
- By Organization Size
- Large Enterprises
- Small and Medium Enterprises (SMEs)
- By End-user Industry
- BFSI
- IT and Telecommunications
- Retail and E-commerce
- Media and Entertainment
- Healthcare and Life Sciences
- Manufacturing
- Government and Public Sector
- Other End-user Industries
- By Geography
- North America
- United States
- Canada
- Mexico
- South America
- Brazil
- Argentina
- Chile
- Rest of South America
- Europe
- Germany
- United Kingdom
- France
- Italy
- Spain
- Russia
- Rest of Europe
- Asia-Pacific
- China
- India
- Japan
- South Korea
- Singapore
- Malaysia
- Australia
- Rest of Asia-Pacific
- Middle East and Africa
- Middle East
- United Arab Emirates
- Saudi Arabia
- Turkey
- Rest of Middle East
- Africa
- South Africa
- Nigeria
- Egypt
- Rest of Africa
- Middle East
- North America
Data Sources, Market Sizing, and Validation
Desk Research
Desk research began by mapping what is counted as release automation revenue and what sits outside it, then aligning that boundary to commonly available public indicators. For tech employment context, we used the US Bureau of Labor Statistics, for software revenue disclosures and segment commentary we used US SEC filings, and for DevSecOps process requirements and tooling priorities we referenced NIST publications.
We also referred to sources such as the World Bank and OECD for macro indicators that influence enterprise IT spending cycles, plus peer reviewed articles and conference proceedings describing CI/CD and deployment automation practices at scale. General secondary inputs, including earnings call transcripts, investor presentations, and association websites, helped confirm buyer-facing definitions of packaging, deployment, and release governance.
In a limited way, we also used paid subscriptions for company financials and intelligence, news and financials, and patent databases to speed up cross-checks. These sources are illustrative, and many other references were used for data collection, validation, and clarification.
Primary Interviews and Surveys
Primary inputs were collected through interviews and surveys with software engineering leaders, DevOps release owners, IT operations managers, and solution architects, plus commercial owners who track pricing and renewal patterns. Because this is a global market, fieldwork was balanced across APAC, EMEA, and the Americas so adoption pace, cloud migration timing, and procurement models could be checked before finalizing totals.
Distribution of primary research fieldwork respondents
| Company type | Respondent position | Region |
|---|---|---|
| Top tier: 30% | CXOs: 12% | APAC: 47% |
| Mid tier: 49% | Functional/Unit leaders: 41% | EMEA: 30% |
| Smaller Players: 21% | Managers: 47% | Americas: 23% |
Market-Sizing & Forecasting
Sizing was built using a top-down approach, where enterprise software spend was translated into a release automation demand pool through adoption rates of CI/CD, the share of teams using standardized release orchestration, and typical spend levels by organization maturity. After forming the demand pool, we ran selective bottom-up checks, including sampled vendor revenue disclosures, partner channel feedback, and ASP times deployment volumes for commonly licensed modules, then adjusted totals when gaps appeared.
Practical model inputs included DevOps penetration by region, the cloud versus on-premises mix for deployment targets, and the average number of application releases per month in large teams. We also accounted for the share of regulated workloads that require approval workflows, and subscription price progression for enterprise plans. Where a company did not publish a clear release automation line item, revenue was estimated from product mix notes, pricing pages, and interview-based allocation ranges, then kept conservative until validated by at least two independent signals.
For forecasting, scenario analysis was used so the outlook reflects different cloud migration speeds, security policy adoption in pipelines, and changes in IT budget growth. Scenario weights were refined based on what primary respondents said about buying timelines, renewal cycles, and the practical limits of automation adoption in legacy environments.
Data Validation & Update Cycle
Outputs were checked against independent signals, including enterprise software budget direction, hiring indicators for DevOps and platform engineering roles, and the pace of cloud adoption that affects release frequency. When a regional trend or a price assumption produced an outlier, the driver was traced back to the input sheet, then rechecked through desk sources and follow-up calls before sign-off.
A multi-step analyst review is used to keep definitions, calculations, and assumptions consistent across geographies and time periods. The report is refreshed annually, with interim updates made when a material change affects pricing, packaging, or demand expectations. Before delivery, a final review pass is completed so clients receive the most current view available.
Mordor Intelligence's Application Release Automation Market Size Measured Against Other Published Estimates
Published market values for application release automation often do not match because researchers count different product boundaries, treat services differently, and use different base years or currency timing. We handle this by tying the model to observable enterprise delivery activity, then checking whether the implied spend aligns with what buyers and suppliers describe.
Release frequency signals, DevOps and platform engineering hiring trends, and vendor revenue split disclosures are used to keep Mordor Intelligence's estimate focused on commercial tools and services used specifically for release orchestration and deployment automation, instead of blending in adjacent CI tooling or broader application lifecycle platforms.
Benchmark comparison
| Source | Market Size | Gaps in Research Methodology |
|---|---|---|
| Mordor Intelligence | USD 6.42 B (2026) | |
| Trade Journal A | USD 4.56 B (2023) | Uses an earlier base year and often reports a narrower software-only view, which can undercount managed services and enterprise scale expansions that show up later in adoption cycles. |
| Industry Publisher B | USD 2.86 B (2025) | Typically applies a tighter definition focused on release automation tools, with conservative adoption assumptions and limited normalization of subscription pricing and multi-year contract timing. |
The spread in the table mainly comes from time alignment and what is included around services and enterprise deployment scope. By keeping the scope anchored to release orchestration and deployment automation revenue, and by validating assumptions using simple, repeatable market signals, the final number stays transparent and easier to reconcile across years.
Key Questions Answered in the Report
What is driving the rapid growth of the application release automation market?
C-suite mandates for pipeline-as-code, multi-cloud microservice architectures, and GenAI-based failure prediction collectively push the market to an 18.47% CAGR through 2031.
How large will the application release automation market be by 2031?
Forecasts place the application release automation market size at around USD 14.97 billion by 2031, more than double its 2026 level.
Which deployment mode is growing fastest?
Hybrid deployments are expanding at 20.37% CAGR because enterprises want cloud scale while retaining on-premises control for sensitive workloads.
Why are services outpacing tools in growth?
Organizations recognize that cultural change, governance, and compliance expertise are prerequisites for success, boosting services demand at 21.12% CAGR.
Which region offers the most attractive growth opportunity?
Asia-Pacific leads with 20.86% CAGR due to aggressive AI spending and rapid cloud-infrastructure build-out.
What is the main competitive differentiator among leading vendors?
Integrated AI capabilities that auto-generate pipelines, predict failures, and manage software-supply-chain security now set the pace in the application release automation industry.