
Application Performance Management Market Size and Share
Market Overview
| Study Period | 2020 - 2031 |
|---|---|
| Market Size (2026) | USD 15.87 Billion |
| Market Size (2031) | USD 57.53 Billion |
| Growth Rate (2026 - 2031) | 29.40 % |
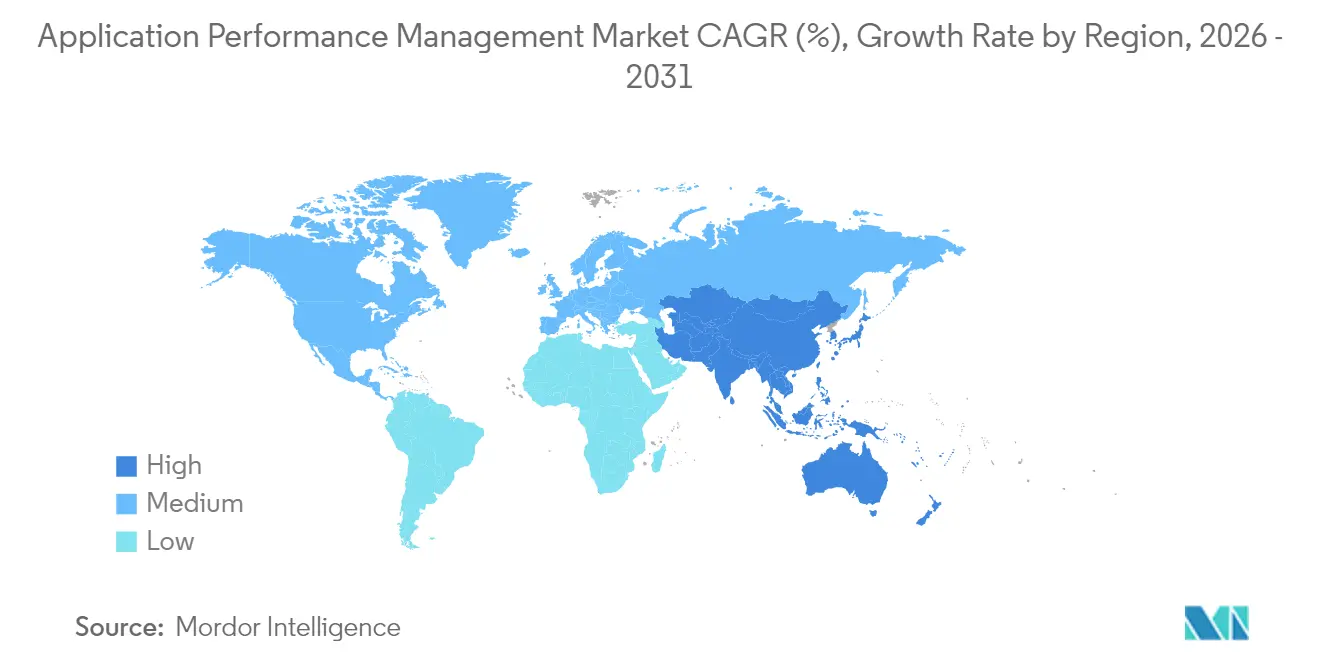
| Fastest Growing Market | Asia Pacific |
| Largest Market | North America |
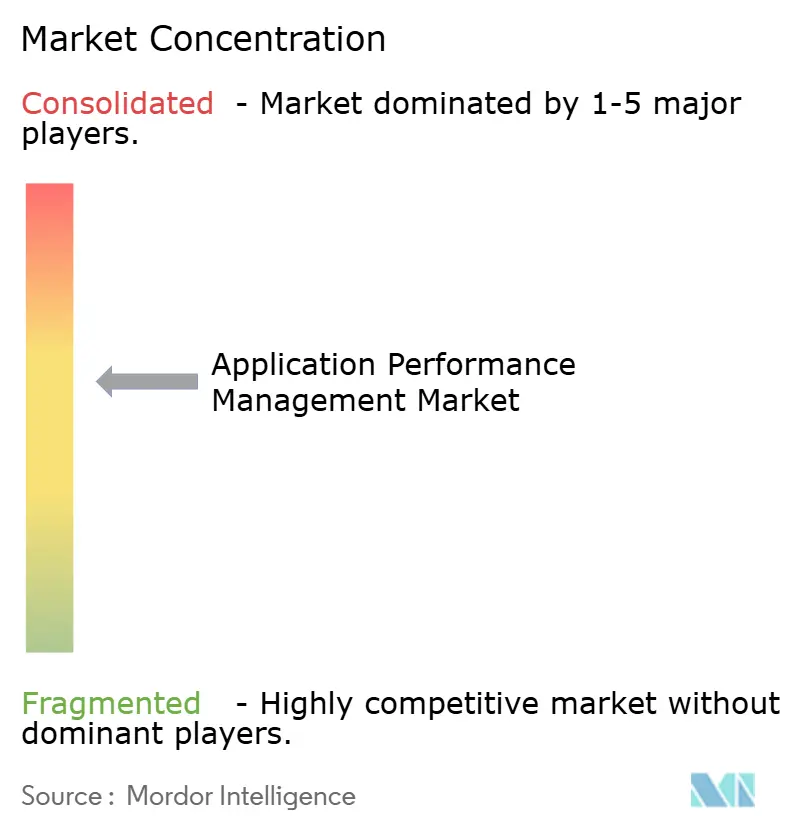
| Market Concentration | Medium |
Major Players *Disclaimer: Major Players sorted in no particular order Image © Mordor Intelligence. Reuse requires attribution under CC BY 4.0. | |
Application Performance Management Market Analysis by Mordor Intelligence
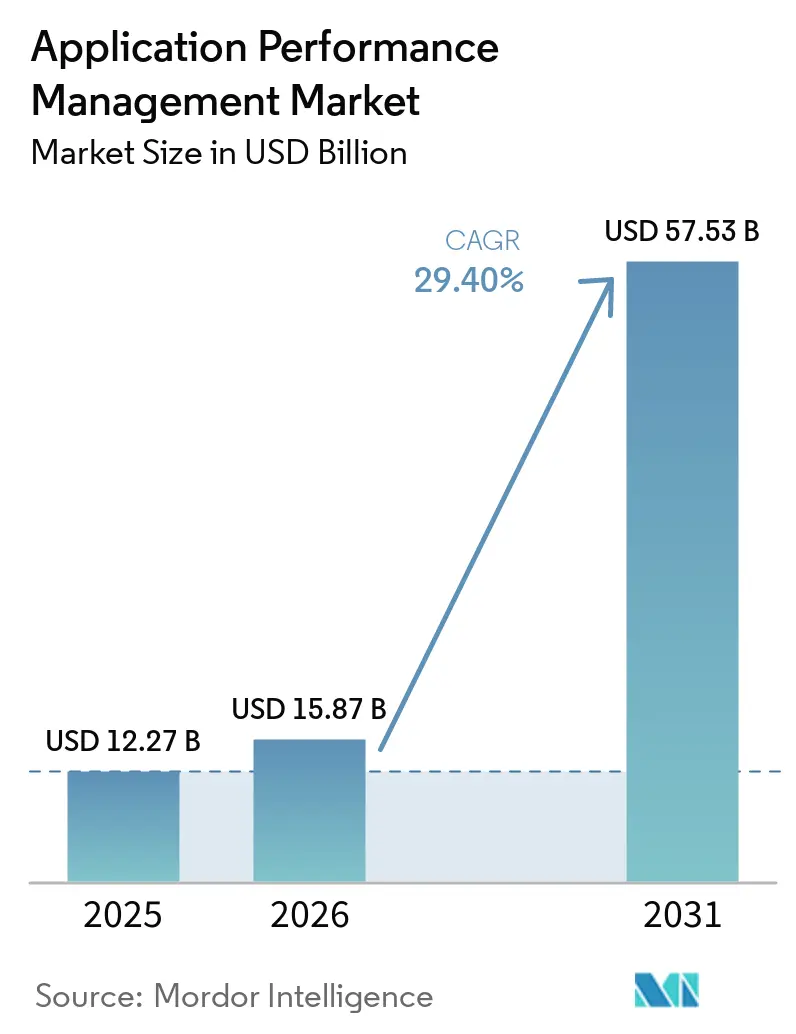
The Application Performance Management Market size was valued at USD 12.27 billion in 2025 and estimated to grow from USD 15.87 billion in 2026 to reach USD 57.53 billion by 2031, at a CAGR of 29.40% during the forecast period (2026-2031).
This acceleration reflects enterprises’ push to sustain seamless digital experiences, an objective that turns application performance from reactive troubleshooting into proactive business enablement. Cloud-first adoption, unified observability, and AI-driven auto-remediation now form the core growth engines as downtime costs in Asia-Pacific alone can surpass USD 2.3 million per hour.[1] Competitive intensity centers on platform convergence, with Cisco’s USD 28 billion Splunk buyout and BMC’s Netreo acquisition foreshadowing an industry tilt toward end-to-end visibility. Across regions, the Application Performance Management market sees North America holding the lion’s share while Asia-Pacific posts the quickest gains on the back of hyperscale cloud investments.
Key Report Takeaways
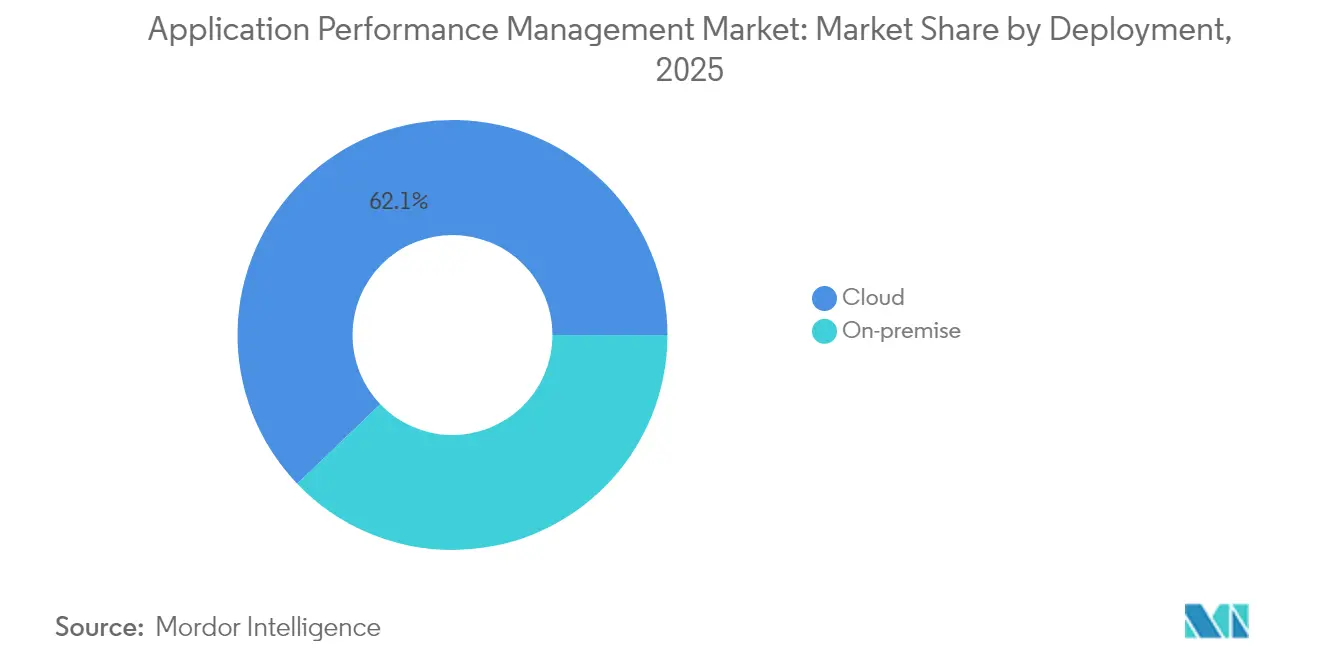
- By deployment, cloud solutions held 62.15% of the Application Performance Management market share in 2025 while expanding at a 32.55% CAGR through 2031.
- By enterprise size, large enterprises led with 57.05% share of the Application Performance Management market size in 2025; SMEs are projected to grow at 33.55% CAGR to 2031.
- By component, solutions captured a 70.15% share of the Application Performance Management market size in 2025, whereas services recorded the highest anticipated CAGR at 33.78% to 2031.
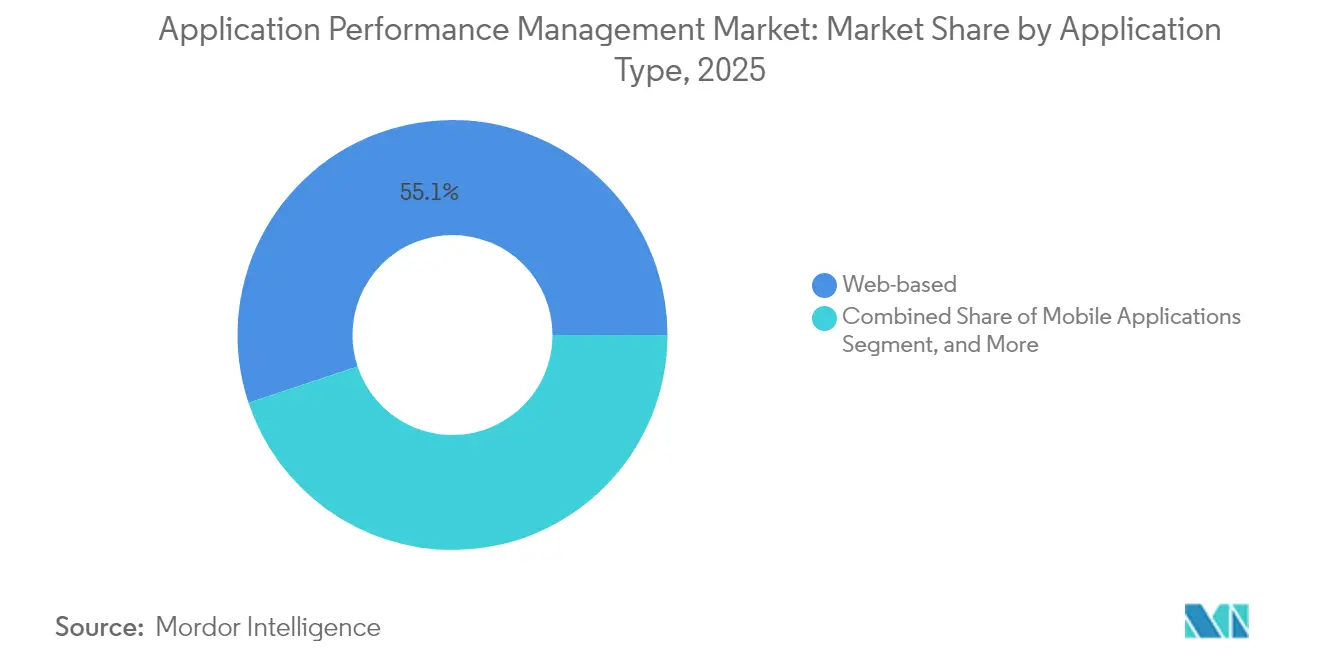
- By application type, web-based workloads accounted for a 55.10% share of the Application Performance Management market size in 2025; microservices and containerized workloads are forecast to surge at a 34.35% CAGR.
- By end-user industry, BFSI dominated with 23.65% share of the Application Performance Management market size in 2025; the healthcare and life sciences segment is advancing at 32.95% CAGR through 2031.
- By geography, North America controlled 37.75% of the Application Performance Management market in 2025, while Asia-Pacific is set to progress at 31.25% CAGR.
Note: Market size and forecast figures in this report are generated using Mordor Intelligence’s proprietary estimation framework, updated with the latest available data and insights as of 2026.
Market Trends and Insights
Drivers Impact Analysis of Application Performance Management Market*
| Driver | (~) % Impact on CAGR Forecast | Geographic Relevance | Impact Timeline |
|---|---|---|---|
| Rapid shift to cloud-native and micro-services architectures | +8.2% | Global, with APAC and North America leading | Medium term (2-4 years) |
| Rising demand for unified observability across DevOps tool-chains | +6.8% | Global, concentrated in mature IT markets | Short term (≤ 2 years) |
| Proliferation of mobile and IoT transactions requiring real-time insight | +5.4% | APAC core, spill-over to MEA and Latin America | Medium term (2-4 years) |
| Growth in digital-first customer experience programs | +4.9% | North America and EU, expanding to APAC | Short term (≤ 2 years) |
| AI-driven auto-remediation reducing MTTR | +3.1% | North America and Western Europe early adopters | Long term (≥ 4 years) |
| Edge-to-core performance data monetisation by telecom operators | +2.2% | Global, with 5G-advanced markets leading | Long term (≥ 4 years) |
| Source: Mordor Intelligence | |||
Rapid Shift to Cloud-Native and Micro-Services Architectures
Enterprises replacing monolithic stacks with distributed microservices now orchestrate roughly 35 interconnected components per transaction, a complexity surge that legacy agents cannot trace efficiently. Kubernetes has become the default control plane, and New Relic’s eBPF-powered offering auto-discovers every pod and service without code changes.[2] Faster development cycles, up to 40% shorter, intensify the need for continuity between build and run phases. Consequently, demand spikes for distributed tracing, service-mesh visibility, and topology-aware analytics that adjust to ephemeral workloads. Vendors differentiate by correlating metrics, logs, and traces in near real time to keep release velocity from outpacing reliability targets, shaping APM industry trends.
Rising Demand for Unified Observability Across DevOps Tool-Chains
Large enterprises routinely juggle five or more monitoring tools, forcing engineers to swivel between dashboards, prolonging incident resolution. OpenTelemetry’s rise catalyzes consolidation, letting teams decouple data collection from analysis engines. Firms that collapse tool sprawl into single-pane platforms report 30% quicker resolution times and 25% lower operations overhead. Central governance bodies now vet purchases against cross-domain telemetry requirements, cementing unified observability as a budgetary mandate. The Application Performance Management market, therefore, rewards vendors offering integrated metric, log, trace, and event workflows that accelerate decision loops.
Proliferation of Mobile and IoT Transactions Requiring Real-Time Insight
Mobile incidents captured automatically across iOS, Android, and hybrid frameworks surged after New Relic embedded device-native log ingestion into its digital experience suite.[3] IoT sensors stream massive telemetry volumes, compelling edge nodes to pre-process data and slash backhaul latency. Telecom carriers now sell anonymized edge-to-core performance analytics to enterprises, unlocking fresh revenue. Business models converge around sub-second data pipelines that fuel immediate anomaly detection, which, in turn, cements the Application Performance Management market as critical infrastructure for mobile banking, telehealth, and connected retail experiences. Modern platforms thus embed adaptive sampling to filter low-value events while preserving contextual breadth.
Growth in Digital-First Customer Experience Programs
Digital banking, telemedicine, and e-commerce measure success in bounce rates and conversion funnels, not CPU spikes. Session replay, real user monitoring, and synthetic journeys have graduated from optional to mandatory modules. Banks like the Bank of New Zealand track customer journeys end-to-end to stop drop-offs that undermine brand equity. Healthcare providers tie page-load speed to patient engagement in virtual visits. Retailers fine-tune checkout flows, correlating performance gains with revenue lifts. These outcome metrics amplify the Application Performance Management market’s role in board-level discussions as platforms connect technical health to business KPIs.
Restraints Impact Analysis of Application Performance Management Market*
| Restraint | (~) % Impact on CAGR Forecast | Geographic Relevance | Impact Timeline |
|---|---|---|---|
| Budget squeeze from FinOps optimisation of tool stacks | -4.70% | Global, particularly in cost-conscious enterprises | Short term (≤ 2 years) |
| Complex, expensive licensing models limiting wider adoption | -3.90% | Global, affecting SME adoption rates | Medium term (2-4 years) |
| Skill-set gap in distributed-tracing and open telemetry | -2.80% | Global, with acute shortages in emerging markets | Long term (≥ 4 years) |
| Data-sovereignty hurdles for cross-border APM data lakes | -1.60% | EU, APAC regions with strict data localization | Medium term (2-4 years) |
| Source: Mordor Intelligence | |||
Budget Squeeze from FinOps Optimization of Tool Stacks
FinOps audits expose monitoring spend as a disproportionate slice of cloud bills; one enterprise topped USD 65 million yearly on a single platform.[4] Consumption pricing tied to cardinality drives unpredictable charges, spurring tooling rationalization. Cost-governance startups parse observability invoices, flagging unused licenses and high-water-mark billing that spikes during seasonal peaks. SMEs feel the pinch first, often postponing full-stack monitoring rollouts. Vendors now counter with adaptive data retention, on-demand licensing tiers, and anomaly-based sampling that aligns cost visibility with business value, influencing APM market trends.
Complex, Expensive Licensing Models Limiting Wider Adoption
Traditional per-host pricing breaks in container worlds where pod counts swing hourly, and serverless invocations defy static sizing. High-water-mark clauses penalize scaling events, muting adoption among unpredictable traffic profiles. Negotiating enterprise agreements demands specialist procurement skills that SMEs lack, increasing friction. The skills gap compounds the hesitation, as teams debate the ROI of complex tracing versus basic metrics. Vendors responding with usage-based, entity-agnostic licenses gain traction, but transparency remains sporadic. Buyers increasingly insist on OpenTelemetry support to sidestep lock-in and preserve optionality in data pipelines.
*Our forecasts treat driver/restraint impacts as directional, not additive. The impact forecasts reflect baseline growth, mix effects, and variable interactions.
Application Performance Management Market Segment Analysis
By Deployment:
Cloud Dominance Accelerates Hybrid StrategiesCloud offerings commanded 62.15% of the Application Performance Management market share in 2025 and are projected to advance at a 32.55% CAGR, confirming SaaS as the default consumption model. Enterprises offload infrastructure management to vendors, unlocking instant global reach and continuous feature delivery. Hybrid models rise where data protection rules keep subsets of telemetry on-site; here, edge agents forward redacted insights to cloud-based AI layers for correlation. Consumption billing aligns cost to load, though it requires vigilance to avoid overruns. Vendors add traffic-aware throttling and adaptive retention so that the Application Performance Management market continues to broaden across verticals with contrasting compliance footprints.
A parallel trend sees observability embedded into multi-cloud blueprints, with single dashboards spanning AWS, Azure, Google Cloud, and private stacks. Users adopt cloud-native APIs over traditional SNMP traps, speeding onboarding. Edge computing pushes monitoring closer to devices, granting sub-second anomaly detection for IoT and low-latency retail. These developments cement cloud deployment as the bellwether of platform innovation, setting the cadence for AI, auto-remediation, and predictive capacity modules.

By Enterprise Size:
SME Adoption Democratizes Advanced MonitoringLarge enterprises held a 57.05% share of the Application Performance Management market size in 2025, reflecting entrenched global estates that rely on Tier-1 solutions. These firms prioritize full-stack correlation, often consolidating from five tools to two to streamline workflows. SMEs, however, clock the fastest 33.55% CAGR as SaaS onboarding slashes time-to-value and pay-as-you-go billing lowers entry barriers. Automated instrumentation reduces dependence on scarce observability talent, while AI-translated queries help non-experts extract insights with natural language capabilities boosted by Honeycomb’s Grit acquisition.
SMEs gravitate toward modular bundles that grow with workload scale, favoring OpenTelemetry so they can switch analytics back ends without reinstrumenting code. FinOps hygiene is stronger among small teams that track every dollar, encouraging high-visibility usage dashboards. This democratization widens the Application Performance Management market addressable base, compelling vendors to ship “lite” tiers that preserve enterprise-grade security yet simplify onboarding.
By Component:
Solutions Lead, Services SurgeSolutions cornered 70.15% of 2025 revenue, covering APM, end-user experience, and infrastructure visibility modules that anchor modern toolchains. Within solutions, AI-driven root-cause analysis and topology discovery differentiate offers. Services, however, post a 33.78% CAGR, signaling buyers’ appetite for consultative hand-holding amid observability complexity. Integration engagements map telemetry flows into ITSM platforms, while managed service contracts offload run-time tuning, alert hygiene, and capacity management.
Asia-Pacific fuels services demand as enterprises confronting skills gaps outsource day-to-day observability. North American buyers increasingly sign co-managed deals where provider teams fine-tune alert thresholds while in-house SREs own incident response. As AIOps engines mature, services shift from rule creation to outcome assurance, where consultants align performance SLOs to revenue KPIs. The dual momentum sustains balanced revenue streams, keeping the Application Performance Management market resilient to licensing headwinds.
By Application Type:
Web Workloads Remain the MainstayWeb applications contributed 55.10% to the Application Performance Management market size in 2025, mirroring ubiquitous browser-based services. Digital natives instrument every page, tracking Core Web Vitals and funnel progression to curb abandonment. Synthetic scripts emulate user journeys, catching issues before peak traffic. Yet traffic dynamism, flash sales, and viral content demand auto-scaling visibility so teams spot bottlenecks during sudden surges.
Parallel upgrades push HTTP/3, server-push, and edge caching, each creating new blind spots that holistic observability must illuminate. Browsers supply granular waterfall timings, but correlating them with backend traces still challenges many stacks. Platforms that stitch front and back telemetry into a single trace increasingly win mindshare, reinforcing web observability as the foundational use case that new buyers adopt first within the broader Application Performance Management market.
By End-User Industry:
BFSI Strengthens Compliance-Led AdoptionBFSI controlled 23.65% of 2025 market revenue, motivated by zero-tolerance service-level agreements and stringent audit trails. Regulators demand forensic proof for transaction latency and outage reports, driving banks toward always-on tracing. Investment firms benchmark trade-execution latency against competitors, converting APM insights into trading strategy adjustments. Insurers integrate APM with policy quote engines to preempt performance bottlenecks during seasonal peaks.
Many financial institutions operate hybrid mainframe-to-cloud architectures, layering modern tracing atop legacy CICS calls. Observability solutions map these flows end-to-end, helping risk teams quantify exposure from downtime. As open-banking APIs proliferate, third-party integrations widen failure domains, making real-time monitoring the linchpin of trust. These compliance and competitive imperatives secure BFSI’s lasting influence over vendor roadmaps within the Application Performance Management market.
Geography Analysis
North America Application Performance Management Market
North America retained 37.75% of the Application Performance Management market in 2025, supported by mature cloud ecosystems and a dense vendor landscape led by New Relic, Datadog, and Dynatrace. U.S. banks and hospitals allocate bigger slices of IT spend to observability as compliance regimes tighten, while Canada’s telecommunications and energy verticals adopt APM to secure high-availability targets. Mexico sees expanding digital commerce that heightens interest in real-user monitoring.
APAC Application Performance Management Market
Asia-Pacific is growing at a 31.25% CAGR, fueled by hyperscaler data-center rollouts across China, India, and Southeast Asia. Government digital agendas and 5G network launches raise expectations for app responsiveness. Japanese and South Korean manufacturers integrate APM into Industry 4.0 lines, focusing on predictive downtime avoidance. Indian IT service providers embed observability into outsourcing contracts to guarantee client SLAs.
EMEA Application Performance Management Market
Europe shows steady uptake, shaped by GDPR and emerging sovereignty rules that keep data within borders. The U.K. and Germany lead spending, emphasizing OpenTelemetry compliance to minimize lock-in. France grows telehealth adoption, Italy modernizes e-government portals, and the Nordics invest in edge monitoring for green-energy microgrids. Middle East and Africa remain nascent but accelerate as fintech and e-commerce gain prominence.
Regulatory Landscape
Regulation affecting Application Performance Management (APM) increasingly ties operational telemetry to formal digital-resilience and cybersecurity compliance. In the United States, the Office of Management and Budget issued Memorandum M-26-14 (May 2026), rescinding M-21-31 and shifting federal agencies to a risk-based, five-level logging maturity model. This raises expectations for standardized, actionable logging and visibility across hybrid environments.
In Europe, the Digital Operational Resilience Act (DORA) is reinforced through Commission Delegated Regulations (EU) 2024/1773 and 2024/1774 (March 2024) and Delegated Regulation (EU) 2025/532 (March 2025), which set out ICT risk management expectations, including performance monitoring procedures and third-party contractual requirements for financial entities. Separately, the EU AI Act adds post-market monitoring obligations for high-risk AI systems, requiring ongoing performance evaluation and logging. That expands compliance-driven demand for traceable performance metrics and test logs across AI-enabled applications and the tooling used to monitor them.
Value Chain Analysis
The APM value chain starts with instrumentation and telemetry capture (agents, SDKs, and increasingly eBPF and OpenTelemetry collectors) across web, mobile, microservices, containers, and cloud infrastructure. Data then moves through collection and transport layers into storage and analytics engines that correlate metrics, logs, and traces, before feeding visualization, alerting, incident response, and automation capabilities integrated with DevOps and ITSM toolchains. Deployment is primarily SaaS-led for faster onboarding and feature delivery, though regulated customers also buy self-hosted or hybrid architectures to keep sensitive telemetry within defined residency boundaries.
Services and ecosystem partners support deployment design, integration, and ongoing optimization, particularly as enterprises consolidate multiple monitoring tools into unified observability stacks. In regulated sectors such as BFSI and healthcare, the chain increasingly includes audit-evidence generation (retention, immutability, and reportability of operational signals) and third-party risk workflows aligned with frameworks such as DORA and regional ICT-security rules. Open-source components (Prometheus, Grafana, OpenTelemetry, Fluent Bit) and infrastructure-as-code and GitOps practices (Terraform, Helm) also shape rollout by standardizing collection, while buyers use OpenTelemetry compatibility to reduce lock-in and switch analytics backends without re-instrumenting applications.
Competitive Landscape
The Application Performance Management market features moderate fragmentation, with leading platforms Dynatrace, New Relic, and Datadog holding meaningful yet non-dominant shares. Cisco’s USD 28 billion Splunk acquisition and BMC’s purchase of Netreo signal consolidation that aims to bundle infrastructure, logs, security, and network observability under unified licenses. Incumbents pivot to AI-assisted remediation, promising 50% lower MTTR by blending causal graphs with predictive analytics.
Emerging challengers, such as Honeycomb and Lightstep, harness eBPF and streaming column stores to process high-cardinality data efficiently. Edge-native startups build nano-agents that run on 5G base stations, complementing cloud dashboards. OpenTelemetry’s march reduces proprietary network effects, giving buyers freedom to decouple data from analysis. Vendors now compete on query ergonomics, with Honeycomb’s Grit letting engineers interrogate traces via natural language.
Strategic partnerships also shape rivalry. LogicMonitor’s AWS pact simplifies VMware-to-cloud migrations while bundling cost optimization, strengthening the platform’s partner-led reach Silicon.co.uk. SolarWinds doubled down on channel enablement to rebuild trust post-security incidents. Regional players design compliance-centric offerings especially in Europe to exploit data-residency sensitivities. Overall, sustained MandA and open-standard momentum keep competitive dynamics fluid, rewarding platforms that couple breadth with cost transparency.
Application Performance Management Industry Leaders
-
AppDynamics (Cisco Systems Inc.)
-
New Relic Inc.
-
Dynatrace LLC
-
IBM Corp.
-
Broadcom Inc.
- *Disclaimer: Major Players sorted in no particular order
Application Performance Management Market Companies Covered in this Report
- Cisco Systems, Inc. (AppDynamics)
- New Relic, Inc.
- Dynatrace, Inc.
- International Business Machines Corporation
- Broadcom Inc. (Including CA Technologies)
- Microsoft Corporation
- Micro Focus International plc
- Datadog, Inc.
- Splunk Inc. (incl. SignalFx)
- Akamai Technologies, Inc.
- SolarWinds Corporation
- Riverbed Technology, Inc.
- Oracle Corporation
- BMC Software, Inc.
- Elastic N.V.
- Instana LLC (IBM)
- ManageEngine - Zoho Corporation Pvt. Ltd.
- LogicMonitor, Inc.
- AppOptics (SolarWinds)
- Correlsense Ltd.
Read Analysis of Application Performance Management Companies
Market Opportunities and Future Outlook
Standardization of instrumentation and telemetry transport creates whitespace for platforms that differentiate on correlation, governance, and automation rather than proprietary agents. OpenTelemetry has become a common framework for collection, and the OpenTelemetry Protocol (OTLP) is used as a default transport in many modern observability pipelines. That raises buyer expectations for backend portability and makes data-pipeline control a procurement priority. One opportunity is deeper support for microservices monitoring requirements defined by standards bodies, including ITU-T Recommendation Y.3556 (published August 2025), which lays out functional requirements for microservice monitoring such as data acquisition and instance discovery, aligning with the need to observe fast-changing distributed workloads.
A second opportunity is monitoring for AI-enabled and agentic application architectures, where teams require coverage that spans both performance and operational risk. CNCF work on agentic observability standards (March 2026) highlights the need for standardized metrics and traces for end-to-end visibility across microservices and agents, and it reinforces demand for explainable operational telemetry that can be audited and operationalized across DevOps workflows. Vendors that connect these standards-driven data foundations to automated remediation, policy-based data controls, and cross-domain correlation (applications, infrastructure, and security signals) can expand as enterprises consolidate toolchains under FinOps and compliance pressure.
Recent Industry Developments in Application Performance Management Market
- June 2026: New Relic launched New Relic Autopilot and New Relic Ground Truth, adding automated SRE agents and tooling to integrate custom AI agents with the New Relic data platform. The release broadens APM from detection and diagnosis into agentic operations, increasing vendor differentiation around closed-loop remediation and AI-era workflow integration.
- May 2025: Dynatrace announced a cross-cloud observability platform upgrade that integrates AI-assisted incident response and unified tracing across Kubernetes and cloud environments. The update enhances enterprise capabilities for rapid root-cause analysis and cross-domain correlation between application, infrastructure, and security signals.
- July 2024: New Relic launched an AI-driven Digital Experience Monitoring solution that integrates end-user experience visibility with APM workflows. This expansion links session-level behavior to application performance signals, supporting customer-experience programs that measure outcomes such as conversion and journey completion rather than only infrastructure metrics.
Application Performance Management Market Report Scope and Research Methodology
Market Definition and Coverage
This market covers revenues earned from application performance management tools and related services that monitor, troubleshoot, and improve the speed, availability, and reliability of software applications across on-premise and cloud environments.
Scope exclusions: This sizing does not count general IT outsourcing or broad infrastructure monitoring that is not used for application-level performance management.
Segments Covered in This Report
- By Deployment
- On-premise
- Cloud
- By Enterprise Size
- Small and Medium-Sized Enterprises (SMEs)
- Large Enterprises
- By Component
- Solutions
- Application Performance Monitoring and Analytics
- End-User Experience Monitoring
- Infrastructure and Network Monitoring
- Services
- Professional Services
- Managed Services
- Solutions
- By Application Type
- Web-based Applications
- Mobile Applications
- Micro-services and Containerised Workloads
- By End-user Industry
- Banking, Financial Services and Insurance (BFSI)
- Information Technology and Telecommunications
- Retail and E-commerce
- Healthcare and Life Sciences
- Manufacturing
- Government and Public Sector
- Others
- By Geography
- North America
- United States
- Canada
- Mexico
- South America
- Brazil
- Argentina
- Rest of South America
- Europe
- United Kingdom
- Germany
- France
- Italy
- Spain
- Russia
- Rest of Europe
- Asia-Pacific
- China
- Japan
- India
- South Korea
- ASEAN
- Australia and New Zealand
- Rest of Asia-Pacific
- Middle East and Africa
- Middle East
- Saudi Arabia
- United Arab Emirates
- Turkey
- Rest of Middle East
- Africa
- South Africa
- Nigeria
- Rest of Africa
- Middle East
- North America
Data Sources, Market Sizing, and Validation
Desk Research
Desk research was used to set the market boundary and collect demand and supply signals that can be checked over time. We leaned on public indicators such as US Bureau of Labor Statistics data for IT employment trends, US SEC filings and investor presentations for product revenue direction, and US NIST and ISO publications to understand observability and performance terminology used in procurement.
To keep assumptions grounded, we also reviewed sources such as the OECD and World Bank for digital economy indicators, IT spend context, and cloud adoption direction, along with reputable press releases and association websites that describe performance monitoring use cases across industries. In a few places, we used paid subscriptions for company financials and intelligence, patent databases, and news and financials, mainly to confirm timelines and avoid double counting across overlapping monitoring categories. The sources listed here are illustrative, and many other public and paid references were also used for data collection, cross-checking, and clarification.
Primary Interviews and Surveys
Primary work focused on validating what buyers actually purchase under APM, how pricing is packaged, and how deployments shift between on-premise and cloud. We spoke with solution leaders, sales and channel roles, and IT operations stakeholders across major regions, so adoption patterns, renewal behavior, and service attach rates could be compared directly against desk research before finalizing assumptions.
Distribution of primary research fieldwork respondents
| Company type | Respondent position | Region |
|---|---|---|
| Top tier: 37% | CXOs: 19% | APAC: 41% |
| Mid tier: 43% | Functional/Unit leaders: 33% | EMEA: 34% |
| Smaller Players: 20% | Managers: 48% | Americas: 25% |
Market-Sizing & Forecasting
Sizing starts from a top-down build that reconstructs the addressable spend pool using digital application growth signals and the observed penetration of APM tooling in production environments, then it is refined through checks against supply-side revenue patterns. When the market is broken into practical buying units, the model uses inputs such as enterprise cloud migration intensity, microservices adoption, DevOps and SRE staffing trends, application downtime sensitivity by industry, and the typical shift toward subscription pricing.
To corroborate totals, we ran selective bottom-up approximations using sampled price ranges and seat- or host-based scaling logic, plus channel checks on renewal cycles and service attach behavior. Where vendor disclosures were not cleanly split between APM and adjacent observability products, allocation factors were applied based on interview feedback and product module mapping, then adjusted to avoid double counting.
For forecasting, scenario analysis is used so the base case reflects expected cloud-native application growth, the pace of consolidation into platforms, and changes in unit pricing as buyers move from perpetual licenses to subscriptions. Assumptions were further filtered through expert views on budget cycles and procurement constraints, and the final curve was kept consistent with observable IT spending direction.
Data Validation & Update Cycle
Outputs were checked in several passes so totals stayed consistent with independent signals such as public revenue disclosures, hiring and skills demand, and cloud adoption indicators. If a region or segment showed an unusual jump, we revisited assumptions behind penetration, pricing, or service share and then placed follow-up calls with relevant respondents.
Before sign-off, a separate analyst review tests for arithmetic issues, overlap across categories, and year-to-year continuity. Reports are refreshed annually, and interim updates are made when material events occur, such as major pricing model changes or shifts in cloud spending. Right before delivery, we complete a final scan so the numbers reflect the most recent available information.
Mordor Intelligence's Application Performance Management Apm Market Size Compared Against Other Published Estimates
Published APM market estimates often differ, even when they appear to describe the same space, because firms draw the line around APM in different places and then apply different pricing and adoption assumptions. The year chosen as the starting point, the currency conversion timing, and how fast subscriptions are assumed to replace licenses also influence the final value.
Key gap drivers in APM usually come from scope choices, such as whether adjacent observability, digital experience monitoring, or broader infrastructure monitoring is bundled into the same total, and from how mixed vendor revenues are allocated when product suites overlap. Some studies also publish conservative cases that assume slower cloud-native uptake, or they use older renewal and discount patterns that do not match current subscription packaging.
Benchmark comparison
| Source | Market Size | Gaps in Research Methodology |
|---|---|---|
| Mordor Intelligence | USD 15.87 B (2026) | |
| Global Consultancy A | USD 7.63 B (2025) | Uses a different base year and growth window, and it typically treats web and mobile access splits as a core boundary, which can keep platform-style APM suite revenues from being fully captured in the same bucket. |
| Regional Consultancy B | USD 7.02 B (2024) | Anchors the model in an earlier year with a lower growth trajectory, and its scope commonly underweights cloud subscription expansion and the re-bundling of APM functions into broader software platforms. |
Publicly observable subscription mix shifts, cloud migration intensity, and product suite revenue disclosures are the checks that keep Mordor Intelligence tied to a tighter APM-only boundary and a current packaging view, which explains most of the spread versus the two external figures. With the scope made explicit and the allocation rules kept consistent, the estimate remains traceable to repeatable inputs rather than to one-off headline assumptions.
Key Questions Answered in the Report
How big is the Application Performance Management market in 2026?
The market is valued at USD 15.87 billion in 2026 and is projected to grow to USD 57.53 billion by 2031.
What is the expected CAGR for Application Performance Management through 2031?
The compound annual growth rate is forecast at 29.40% for the 2026-2031 period.
Which deployment model leads current adoption?
Cloud-based deployments command 62.15% share and remain the fastest-growing segment at 32.55% CAGR.
Which region is expanding the fastest in adopting performance monitoring platforms?
Asia-Pacific shows the highest momentum, advancing at a 31.25% CAGR through 2031.