
Application Gateway Market Size and Share
Market Overview
| Study Period | 2020 - 2031 |
|---|---|
| Market Size (2026) | USD 3.31 Billion |
| Market Size (2031) | USD 5.18 Billion |
| Growth Rate (2026 - 2031) | 9.35% CAGR |
| Fastest Growing Market | Asia Pacific |
| Largest Market | North America |
| Market Concentration | Medium |
Major Players *Disclaimer: Major Players sorted in no particular order Image © Mordor Intelligence. Reuse requires attribution under CC BY 4.0. | |
Application Gateway Market Analysis by Mordor Intelligence
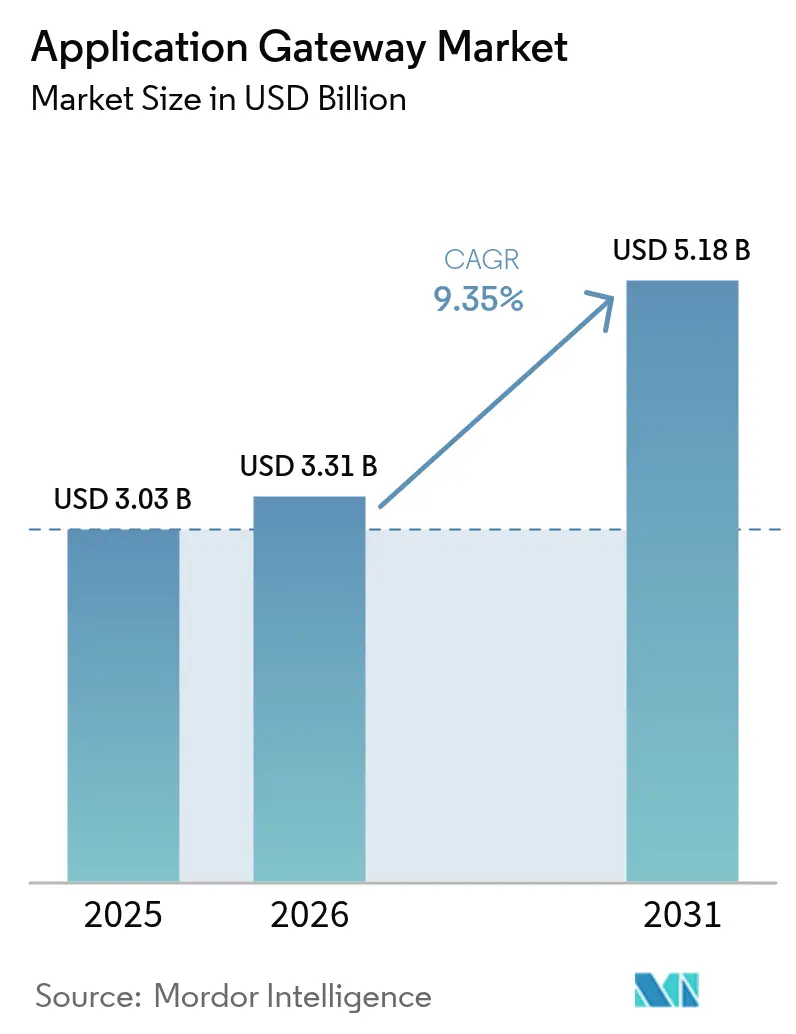
Application Gateway Market size market size in 2026 is estimated at USD 3.31 billion, growing from 2025 value of USD 3.03 billion with 2031 projections showing USD 5.18 billion, growing at 9.35% CAGR over 2026-2031. The upward trajectory is propelled by a sharp rise in automated Layer-7 DDoS attacks, wider deployment of Zero-Trust and SASE architectures, and accelerated cloud-native application rollouts. Enterprises seek low-latency, policy-driven traffic management for hybrid multicloud environments, placing application gateways at the center of security and performance strategies. Growing investment in edge computing and quantum-resistant encryption further enlarges the addressable opportunity, while managed service models help enterprises overcome skills shortages.
Key Report Takeaways
- By offering, solutions retained 69.74% revenue share of the application gateway market in 2025, whereas services are on course for the fastest 12.11% CAGR through 2031.
- By deployment mode, cloud implementations held 58.10% of the application gateway market share in 2025; hybrid deployments are projected to register an 10.84% CAGR by 2031.
- By organization size, large enterprises commanded 64.62% of the application gateway market size in 2025, while the SME segment is expanding at a 12.29% CAGR.
- By end-user industry, IT and telecommunications generated 27.85% revenue in 2025; retail and e-commerce is forecast to accelerate at an 11.12% CAGR to 2031.
- By geography, North America contributed 37.74% of 2025 revenue, whereas Asia-Pacific is predicted to advance at a 11.93% CAGR through 2031.
- F5, Cloudflare, and Akamai collectively accounted for slightly above 40% of 2024 revenue, indicating a moderately consolidated environment.
Note: Market size and forecast figures in this report are generated using Mordor Intelligence’s proprietary estimation framework, updated with the latest available data and insights as of 2026.
Global Application Gateway Market Trends and Insights
Drivers Impact Analysis*
| Driver | (~) % Impact on CAGR Forecast | Geographic Relevance | Impact Timeline |
|---|---|---|---|
| Surge in automated Layer-7 DDoS and bot attacks | +2.1% | Global, peak in North America and Europe | Short term (≤ 2 years) |
| API-centric digital transformation | +1.8% | Global, led by North America and APAC | Medium term (2-4 years) |
| Shift toward Zero-Trust and SASE | +1.5% | North America and Europe, expanding to APAC | Medium term (2-4 years) |
| Cloud-native application explosion | +1.4% | Global, highest adoption in APAC | Long term (≥ 4 years) |
| Edge computing demand | +1.2% | APAC core, spill-over to North America and Europe | Long term (≥ 4 years) |
| Quantum-resistant encryption R&D | +0.8% | North America and Europe, selective APAC uptake | Long term (≥ 4 years) |
| Source: Mordor Intelligence | |||
Surge in automated Layer-7 DDoS and bot attacks
Daily Layer-7 DDoS volumes reached 4,500 attempts in 2024, according to Microsoft threat intelligence. Attackers now mimic legitimate traffic, rendering traditional WAF signatures ineffective. Vendors respond with machine-learning-driven mitigation such as Akamai’s Behavioral DDoS Engine, which distinguishes abnormal patterns in real time. Financial services and e-commerce platforms feel the sharpest revenue impact, prompting urgent procurement of integrated application gateway platforms that combine behavioral analytics, rate-limiting, and API threat detection.[1]Microsoft Corp., “Understanding the Evolving Threat of DDoS Attacks in 2024,” techcommunity.microsoft.com
API-centric digital transformation among enterprises
By 2026, 40% of financial transactions are projected to flow through non-bank channels, underscoring the centrality of API-first development. Multicloud API gateways, illustrated by Kong’s deployment at First Abu Dhabi Bank, unify microservices and security policies across AWS and GCP, cutting operational complexity. As API endpoints multiply, demand consolidates around Web Application and API Protection (WAAP), where a single gateway enforces traffic inspection, authentication, and observability.[2]Kong Inc., “Deploying a Multi-Cloud API Gateway on AWS and GCP,” konghq.com
Rapid shift toward Zero-Trust and SASE architectures
Enterprises move away from perimeter defense, folding networking and security into cloud-delivered SASE stacks. Palo Alto Networks now supports RFC 9242 and RFC 9370 for quantum-safe VPNs, future-proofing encrypted tunnels. Case studies such as Westfield demonstrate 60% network cost savings via Prisma SASE, elevating application gateways to identity-aware enforcement points that authenticate users, devices, and context on every request.[3]Palo Alto Networks, “The Quantum Countdown: How Hybrid Encryption Is Quietly Fortifying Your Web Browsing and Applications,” live.paloaltonetworks.com
Cloud-native application explosion
Kubernetes and serverless adoption intensify the need for gateways capable of automatic service discovery, policy-as-code, and scale-out capacity. F5 Distributed Cloud App Stack integrates SaaS-delivered load balancing and WAAP with GitOps workflows, enabling consistent configuration across multicloud clusters. Ephemeral workloads drive interest in API-driven gateways that spin up and retire alongside containers without manual intervention.[4]F5 Inc., “Distributed Cloud App Stack,” docs.cloud.f5.com
Restraints Impact Analysis*
| Restraint | (~) % Impact on CAGR Forecast | Geographic Relevance | Impact Timeline |
|---|---|---|---|
| Skills gap in full-stack security operations | -1.3% | Global, most acute in North America and Europe | Short term (≤ 2 years) |
| Interoperability issues in multicloud setups | -0.9% | Global, high impact on large enterprises | Medium term (2-4 years) |
| Budget compression in SMBs | -0.7% | Global, varies by economic cycles | Short term (≤ 2 years) |
| Emerging privacy regulations | -0.5% | Europe and APAC, selective in North America | Medium term (2-4 years) |
| Source: Mordor Intelligence | |||
Skills gap in full-stack application security operations
The UK recorded a 3,500-person annual deficit of qualified cyber professionals in 2024. Talent with combined networking, API security, and Zero-Trust expertise remains scarce, delaying complex gateway deployments. Vendors increasingly bundle managed services and low-code policy builders, but recruitment challenges persist.
Interoperability issues across multicloud and hybrid environments
Nine in ten enterprises cite difficulties orchestrating disparate vendor-specific gateway services. Divergent APIs complicate uniform policy enforcement and raise the specter of vendor lock-in. Platform-agnostic management layers from providers such as F5 address part of the problem, yet comprehensive standardization remains elusive.
*Our forecasts treat driver/restraint impacts as directional, not additive. The impact forecasts reflect baseline growth, mix effects, and variable interactions.
Segment Analysis
By Offering: Services Surge Despite Solutions Dominance
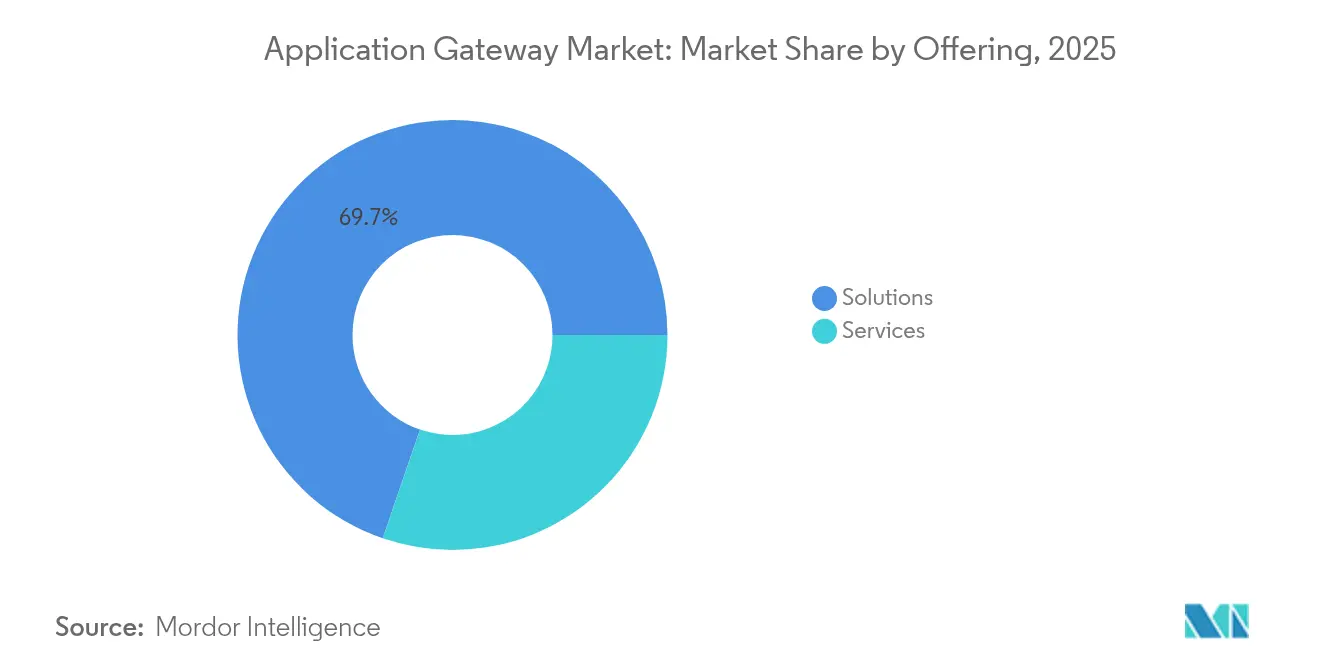
Solutions generated 69.74% of 2025 revenue as enterprises implemented Web Application Firewalls, API gateways, and load balancers to counter escalating Layer-7 threats. The application gateway market size tied to services is projected to climb at a 12.11% CAGR, outpacing product growth as organizations outsource complex multicloud configurations. Managed services covering threat analytics and policy tuning attract firms grappling with lean internal teams. Cardinal Health leveraged professional services around F5 Advanced WAF to cut malicious traffic by 40% while enhancing visibility.
Enterprises increasingly buy outcomes such as risk reduction and SLA uptime rather than discrete features, prompting vendors to wrap consulting, deployment, and ongoing SOC support within subscription plans. Consumption-based billing aligns spend with usage, lowering barriers for SME entry and unlocking cross-sell opportunities into Zero-Trust and SASE bundles.


By Deployment Mode: Hybrid Gains Momentum Amid Cloud Leadership
Cloud deployment held 58.10% of 2025 revenue, favored for its elastic scale and native integration. Microsoft Azure Application Gateway achieved a 99.95% SLA, making platform services attractive for greenfield applications. The hybrid segment, however, is forecast for the highest 10.84% CAGR as enterprises retain sensitive workloads on-premises. The application gateway market share for hybrid models climbs as firms seek uniform policy orchestration from edge to core while avoiding wholesale re-platforming.
Partnerships such as F5–NetApp–Red Hat simplify overlay networks that span data centers and multiple clouds. Enterprises rely on policy-driven traffic steering to balance latency, compliance, and cost, cementing gateways as the connective tissue in distributed architectures.
By Organization Size: SME Acceleration Challenges Enterprise Dominance
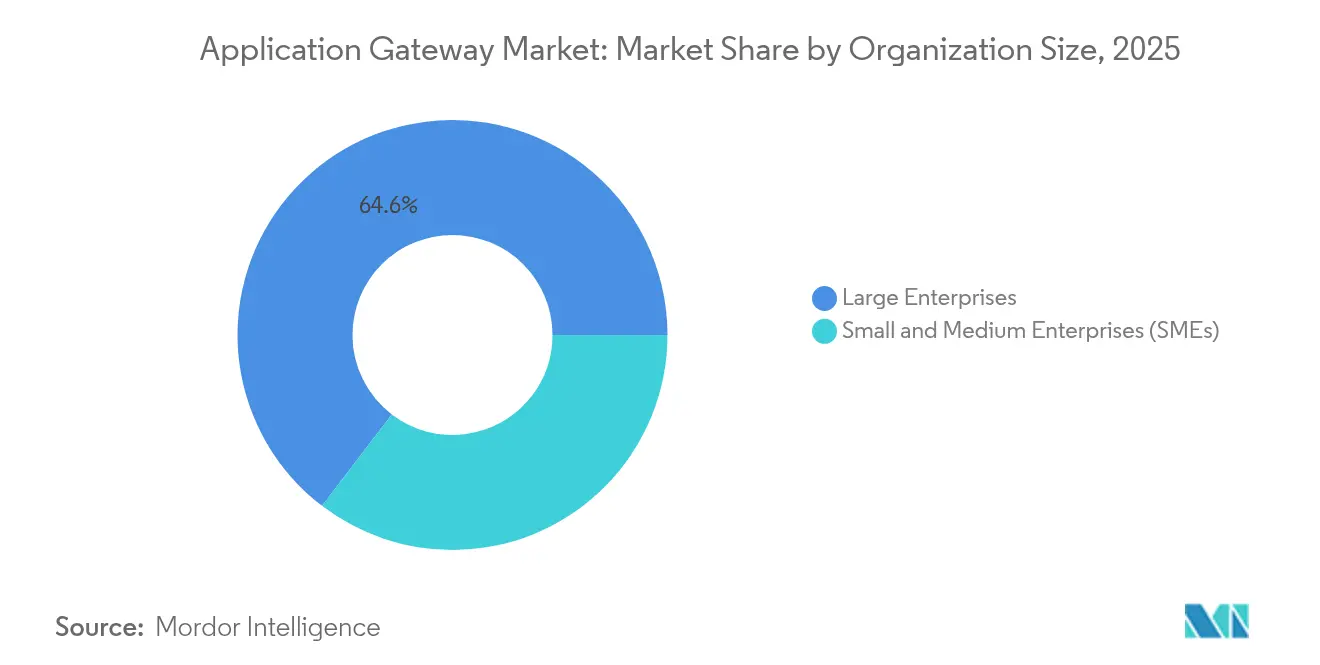
Large enterprises represented 64.62% of the application gateway market in 2025, thanks to complex portfolio needs and regulatory mandates. The application gateway market size attributable to SMEs, though smaller, is poised for a 12.29% CAGR as affordable SaaS gateways remove hefty capital outlays. VMware’s SD-WAN-as-a-service illustrates tailored bundles delivering bandwidth optimization and built-in security for resource-constrained firms.
SMEs nevertheless face budget headwinds and limited staff; 71% already host workloads in public clouds yet lack comprehensive gateway governance, underscoring a growing managed-service opportunity.
By End-user Industry: Retail E-commerce Drives Digital Commerce Security
IT and telecommunications drove 27.85% of 2025 spend, benefiting from inherent demand for carrier-grade application delivery. Retail and e-commerce is projected for the fastest 11.12% CAGR as omnichannel platforms expose extensive APIs that require granular security. BFSI maintains robust adoption because transaction integrity is critical and regulatory audits are stringent. Healthcare providers accelerate investment in response to FDA guidance on medical device cybersecurity; Medcrypt’s Guardian integrates with RTI Connext to protect authentication and data integrity across hospital networks.
Industrial verticals—manufacturing and energy—expand uptake to safeguard OT networks merging with IT systems under Industry 4.0 initiatives. Government agencies invoke Zero-Trust mandates, making gateways essential for user-centric access to citizen services.
Geography Analysis
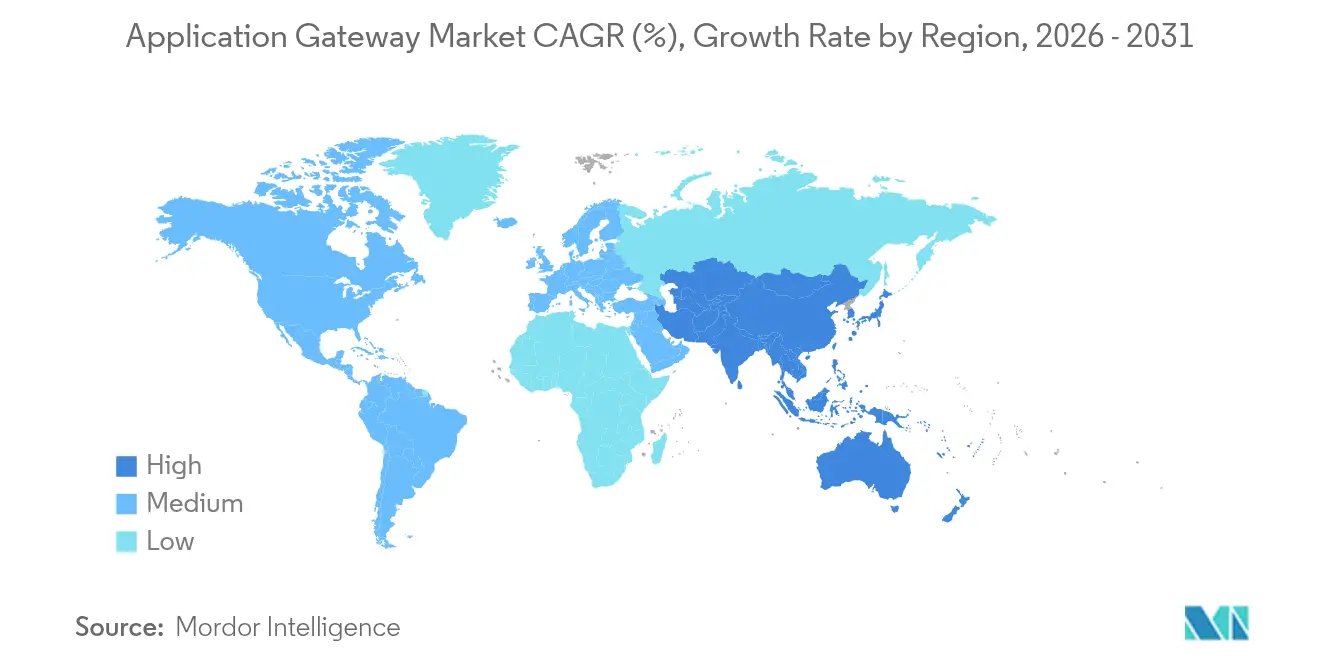
North America sustained 37.74% revenue leadership in 2025, underpinned by expansive enterprise IT footprints and regulatory frameworks that favor rapid security refresh cycles. Federal directives on Zero-Trust and quantum-ready encryption accelerate purchase orders, while high breach costs sharpen C-suite focus on Layer-7 protections. The region contends with the deepest cyber-talent shortage, nudging buyers toward managed service models to close operational gaps.
Asia-Pacific represents the fastest expanding block with a 11.93% CAGR to 2031. Nations such as India, China, and Japan launch substantial public–private cloud and data-center investments that spur adoption of advanced traffic-management and security stacks. An AI language-model uptake of 60% across enterprises intensifies bandwidth demand, increasing reliance on gateways that optimize east-west and north-south traffic while enforcing API governance. Fragmented regulatory landscapes across APAC necessitate flexible policy engines that segment data residency and privacy requirements on a per-country basis, favoring vendors capable of granular, rule-based routing.
Europe follows with steady growth tied to GDPR compliance and data-sovereignty mandates. Application gateways that offer built-in geo-fencing and granular cross-border controls gain preference among enterprises coping with divergent interpretations of privacy law after Brexit. Industrial economies in Germany and France integrate gateways into OT networks to protect connected machinery, while Nordic countries add quantum-safe encryption to critical-infrastructure rollouts. Edge data centers proliferate, prompting demand for distributed policy enforcement to keep latency below 20 ms for real-time analytics.
Latin America and the Middle East & Africa remain nascent but strategic. Digital-first banks in Brazil and Saudi Arabia adopt cloud-native gateways to secure open-banking APIs, while 5G build-outs create fertile ground for telecom-centric gateway services. Limited cyber-talent pools and economic volatility suppress immediate scale, yet managed-security models lower upfront spending hurdles. As local compliance regimes mature, vendors that bundle advisory and implementation services position themselves for accelerated uptake beyond 2027.

Regulatory Landscape
In the United States, application gateway security requirements are increasingly anchored to NIST guidance and federal hardening checklists. In March 2026, NIST finalized updates to SP 800-228 (Guidelines for API Protection for Cloud-Native Systems), tightening expectations for gateway-enforced API controls such as authentication, authorization, and runtime protections. In May 2026, it followed with an initial public draft companion (SP 800-228A) focused on RESTful web APIs. In parallel, DISA updated the Application Layer Gateway (ALG) Security Requirements Guide (STIG) to version 2R3 in September 2025, reinforcing implementation baselines for environments that align to US defense procurement and compliance practices.
Outside the US, government boundary-security standards and supply-chain controls add compliance layers that affect gateway selection, deployment patterns, and certification roadmaps. Australia released its 2025 Gateway Security Standard under the Protective Security Policy Framework in July 2025, shaping how gateway capabilities are specified for government network boundaries. On the cloud-provider side, security baselines such as Microsofts Azure Application Gateway security baseline provide prescriptive configurations that enterprises use as audit evidence, shaping default policy templates and accelerating standardized deployments in regulated industries.
Competitive Landscape
Established vendors pursue platform consolidation to integrate load balancing, WAAP, and observability in a single control plane. F5 posted USD 731 million revenue in Q2 2025, with systems revenue up 27%, reflecting success in hybrid multicloud orchestration. Cloudflare pairs its global network with Kyndryl’s managed-services expertise to win transformation deals that embed Zero-Trust policies across multi-cloud estates.
Akamai deepens cloud-infrastructure capabilities after acquiring Linode and select Edgio assets, adding 4,200 points of presence to support AI inference workloads at 3× throughput with 60% lower latency. Concurrently, the firm exited China CDN operations, opening whitespace for regional providers to capture local-compliance-focused clients. Strategic moves highlight how regional regulation shapes go-to-market tactics.
Disruptive entrants bet on API-first and edge-native architectures. Start-ups emphasize developer-friendly policy-as-code and AI-driven anomaly detection. Patent filings reveal innovation in low-latency path failover and offloaded AI/ML traffic steering, aiming to differentiate on performance and resilience. Competitive intensity intensifies as hyperscale clouds expand proprietary gateway services with bundled economics, pressuring independent suppliers to focus on open standards, deep observability, and value-added managed offerings.
Application Gateway Industry Leaders
Akamai Technologies Inc.
Amazon Web Services Inc.
A10 Networks Inc.
Barracuda Networks LLC
Check Point Software Technologies Ltd.
- *Disclaimer: Major Players sorted in no particular order


Market Opportunities and Future Outlook
A near-term whitespace sits at the intersection of API security governance and cloud-native delivery, where buyers are mapping gateway controls to formal guidance rather than ad hoc best practices. NISTs March 2026 update to SP 800-228 for API protection in cloud-native systems provides a concrete control framework for API gateways, creating demand for products and services that translate guidance into deployable policy-as-code, testable configurations, and continuous compliance reporting across multicloud. This aligns with services growth, as enterprises with skills gaps require managed tuning, incident response workflows, and recurring audit support around gateway policies.
Platform consolidation also creates opportunities in hybrid and edge estates where security and traffic management are fragmented across tools. In 2026, industry discussion around Zero Trust architectures points to gateways that combine WAF and API security with centralized logging and integrated controls, reducing configuration gaps that often appear in multicloud interoperability. In addition, increased AI-driven application usage and machine-to-machine interactions raise the value of gateways that centrally enforce identity-aware policies and observability for non-human traffic patterns, complementing the broader shift toward WAAP and SASE-aligned gateway functions.
Recent Industry Developments
- March 2026: Barracuda Networks released Barracuda Web Application Firewall Version 11.0, adding capabilities such as JWT validation, HTTP/2 for WAF-to-server communication, and expanded bot protection. The update tightens application gateway alignment with API-heavy traffic patterns and modern client behaviors, as Layer-7 attacks increasingly emulate legitimate sessions. It also supports tighter policy enforcement without forcing customers to redesign upstream application authentication flows.
- February 2025: A10 Networks acquired assets of ThreatX Protect to expand its web application and API protection (WAAP) portfolio. The acquisition broadens A10s application security coverage toward integrated gateway stacks that blend traffic management with API threat defense. It also signals continued consolidation as vendors assemble end-to-end controls for hybrid multicloud deployments.
- December 2024: Akamai acquired select Edgio customer contracts and patents. The deal expanded Akamais reach in edge-facing application delivery and security relationships, supporting larger-scale deployment footprints for gateway-adjacent services. It also added intellectual property that can be used to strengthen performance and security capabilities across distributed edge environments.


Research Methodology Framework and Report Scope
Market Definition and Coverage
For this study, the application gateway market covers revenue generated from software, virtual, and cloud delivered gateways that manage, route, and protect application-layer traffic (mainly HTTP/S and API calls) for enterprises and service providers.
Scope exclusions: We exclude pure content delivery networks, basic layer-4 load balancing, and standalone VPN or routing products that do not provide application-layer gateway functions.
Segmentation Overview
- By Offering
- Solutions
- Web Application Firewall (WAF)
- API Gateway / WAAP
- Load Balancer / ADC
- Secure Access Service Edge (SASE) Gateway
- Services
- Solutions
- By Deployment Mode
- On-Premise
- Cloud
- Hybrid
- By Organization Size
- Small and Medium Enterprises
- Large Enterprises
- By End-user Industry
- BFSI
- IT and Telecommunications
- Retail and E-commerce
- Healthcare and Life Sciences
- Government and Public Sector
- Manufacturing
- Energy and Utilities
- Education
- Other End-user Industries
- By Geography
- North America
- United States
- Canada
- Mexico
- South America
- Brazil
- Argentina
- Rest of South America
- Europe
- Germany
- United Kingdom
- France
- Italy
- Spain
- Russia
- Rest of Europe
- Asia-Pacific
- China
- India
- Japan
- South Korea
- Singapore
- Malaysia
- Australia
- Rest of Asia-Pacific
- Middle East
- United Arab Emirates
- Saudi Arabia
- Turkey
- Israel
- Rest of Middle East
- Africa
- South Africa
- Nigeria
- Egypt
- Rest of Africa
- North America
Data Sources, Market Sizing, and Validation
Desk Research
Desk research was used to set the market boundaries, build the country and regional demand framework, and sanity check adoption signals tied to web and API security. We referenced public sources such as NIST guidance on application security controls, CISA advisories on exploited vulnerabilities, FCC and OECD connectivity indicators, and ITU internet usage statistics, which help explain where application traffic and risk exposure are rising.
We also reviewed vendor annual reports and earnings notes, security standards documentation, investor presentations, and credible press coverage to map product positioning and deployment trends across cloud and on-premise environments. Where needed, analyst access to paid subscriptions for company financials and intelligence, patent databases, and news and financials supported revenue splits, technology direction, and event timelines without relying on any single source. These desk research inputs are illustrative, since many other public and paid references were also used for data collection, validation, and clarification.
Primary Interviews and Surveys
Primary inputs were gathered from product, security, and cloud infrastructure stakeholders across vendors, channel partners, and enterprise users, so assumptions could be cross-checked against real buying and deployment patterns. For a global market, we ensured coverage across APAC, EMEA, and the Americas to reflect differences in cloud migration speed, regulatory pressure, and security spend priorities.
Distribution of primary research fieldwork respondents
| Company type | Respondent position | Region |
|---|---|---|
| Top tier: 37% | CXOs: 15% | APAC: 44% |
| Mid tier: 48% | Functional/Unit leaders: 25% | EMEA: 30% |
| Smaller Players: 15% | Managers: 60% | Americas: 26% |
Market-Sizing & Forecasting
The market was sized using a top-down approach where enterprise security and application infrastructure spending pools are reconstructed by region, then filtered through adoption rates of application-layer gateways across cloud and on-premise deployments. To keep totals realistic, selective bottom-up checks were added, including sampling vendor revenue disclosures, triangulating implied installed base additions, and applying ASP by deployment type with shipment and subscription mix checks.
Key model inputs included cloud workload migration intensity, growth in API traffic exposure, frequency of web application attack reporting, enterprise shift to zero trust patterns, and observable changes in security budgets tied to compliance activity. Where a data gap existed in smaller countries or for new use cases, proxy indicators such as internet usage growth and cloud adoption momentum were used, then adjusted after expert feedback. Forecasts were built using scenario analysis, since macro IT spend cycles and security incident spikes can shift adoption faster or slower than a straight-line trend, and then the scenarios were narrowed using primary feedback on pricing pressure and replacement cycles.
Data Validation & Update Cycle
Model outputs are validated through multiple checks, including cross-referencing regional totals against independent signals such as cloud infrastructure growth patterns and the direction of security software spending, before any final number is locked. When an outlier appears at the country or region level, the drivers are revisited, assumptions are stress tested, and interview follow-ups are triggered to confirm whether the variance is real or model-driven.
A multi-step review is followed, where one analyst builds the model, another reviews assumptions and math logic, and a senior reviewer checks whether the story aligns with observable market behavior. Reports are refreshed annually, and interim updates are made when major events materially change demand signals. Before delivery, a final pass is completed so clients receive the latest updated view available at the time of publication.
Mordor Intelligence's Application Gateway Market Sizing Compared With Other Published Estimates
Published market values for application gateways can vary quite a lot, even when the labels look similar, because firms count different product families and they also use different time windows for pricing and deployment mix. Differences also come from how cloud consumption pricing is treated, and whether security add-ons are recorded inside the same bucket or separated.
Some estimates fold adjacent categories like broader application delivery, web application firewall, or API security platforms into one combined total, then project faster growth using aggressive cloud migration assumptions. In the Mordor Intelligence approach, the total is limited to application gateway functionality tied to application-layer traffic management and protection, and pure CDN services, basic L4 load balancing, and standalone VPN functions are not counted.
Benchmark comparison
| Source | Market Size | Gaps in Research Methodology |
|---|---|---|
| Mordor Intelligence | USD 3.31 B (2026) | |
| Industry Research House A | USD 3.91 B (2025) | Uses an earlier base year and applies a higher growth arc, and the scope appears to include a wider bundle of gateway related security and delivery functions beyond core application gateway revenue. |
| Press Summary B | USD 2.35 B (2023) | Anchored to a different starting year and may rely more on vendor-led category labels, which can undercount usage-based cloud revenue or exclude hybrid deployments that still consume gateway services. |
The spread across sources is mainly explained by timing and what gets bundled into the category, not by a disagreement that demand is rising. By keeping the scope tied to observable application-layer gateway use and then checking it with vendor disclosures and interview-tested adoption assumptions, the final number stays traceable to clear inputs and repeatable steps.


Key Questions Answered in the Report
What is the current application gateway market size?
The application gateway market size stands at USD 3.31 billion in 2026, with a projected rise to USD 5.18 billion by 2031.
Which segment is growing fastest in the application gateway market?
Services, encompassing professional and managed offerings, exhibit the highest 12.11% CAGR through 2031.
Why are hybrid deployments gaining traction?
Enterprises balance cloud scalability with on-premises compliance, driving an 10.84% CAGR for hybrid models that maintain uniform security controls across environments.
What is the main driver behind increased application gateway adoption?
Surging automated Layer-7 DDoS and bot attacks require advanced gateways that combine behavioral analytics and API security at scale.
Which region leads growth in the application gateway market?
Asia-Pacific is forecast for the fastest 11.93% CAGR, propelled by large-scale digital-infrastructure investments and rising AI traffic demands.
How consolidated is the competitive landscape?
The top five vendors control a bit more than 60% of global revenue, reflecting moderate consolidation and ample space for niche innovators.
Page last updated on:






