
Application Delivery Controllers (ADC) Market Size and Share
Market Overview
| Study Period | 2020 - 2031 |
|---|---|
| Market Size (2026) | USD 3.72 Billion |
| Market Size (2031) | USD 5.69 Billion |
| Growth Rate (2026 - 2031) | 8.87 % |
| Fastest Growing Market | Asia Pacific |
| Largest Market | North America |
| Market Concentration | Medium |
Major Players_Market_Major_Players.webp) *Disclaimer: Major Players sorted in no particular order Image © Mordor Intelligence. Reuse requires attribution under CC BY 4.0. | |
Application Delivery Controllers (ADC) Market Analysis by Mordor Intelligence
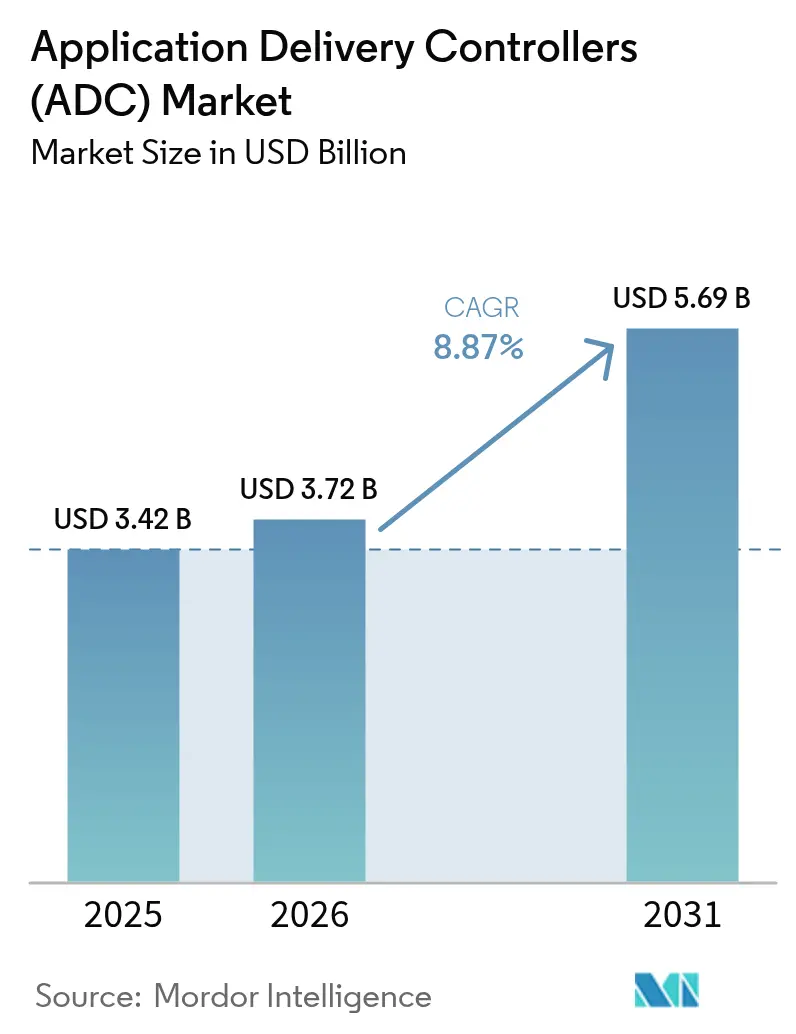
application delivery controllers market size in 2026 is estimated at USD 3.72 billion, growing from 2025 value of USD 3.42 billion with 2031 projections showing USD 5.69 billion, growing at 8.87% CAGR over 2026-2031. Rapid migration to cloud-native architectures, rising east-west data-center traffic, and persistent multi-cloud strategies keep demand high for intelligent, security-aware traffic‐management platforms. Vendors now bundle advanced Layer-7 security, API protection, and AI-assisted analytics into single offerings, allowing enterprises to improve user experience while containing risk. Hardware appliances still dominate performance-critical workloads, yet virtual and cloud-managed form factors are scaling faster as organizations prioritize agility and consumption-based economics. Regionally, North America leverages mature IT estates and regulatory tailwinds to hold leadership, while Asia-Pacific’s 5G build-outs and digital initiatives create the steepest growth curve.
Key Report Takeaways
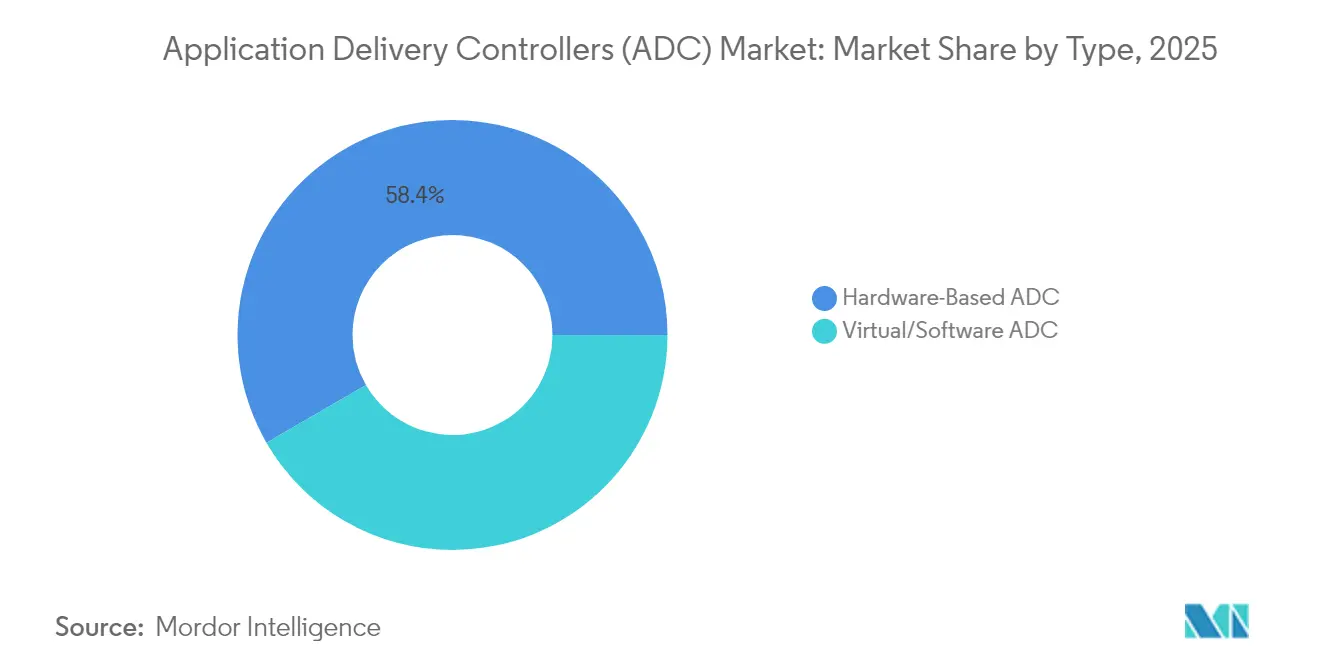
- By type, hardware appliances led with 58.35% of the application delivery controllers market share in 2025; software ADCs are advancing at a 14.12% CAGR to 2031.
- By deployment, on-premise solutions accounted for 63.25% of the application delivery controllers market size in 2025, while cloud-managed/hosted models post the highest 14.68% CAGR through 2031.
- By component, solutions captured 69.40% revenue in 2025; services are forecast to expand at 11.54% CAGR.
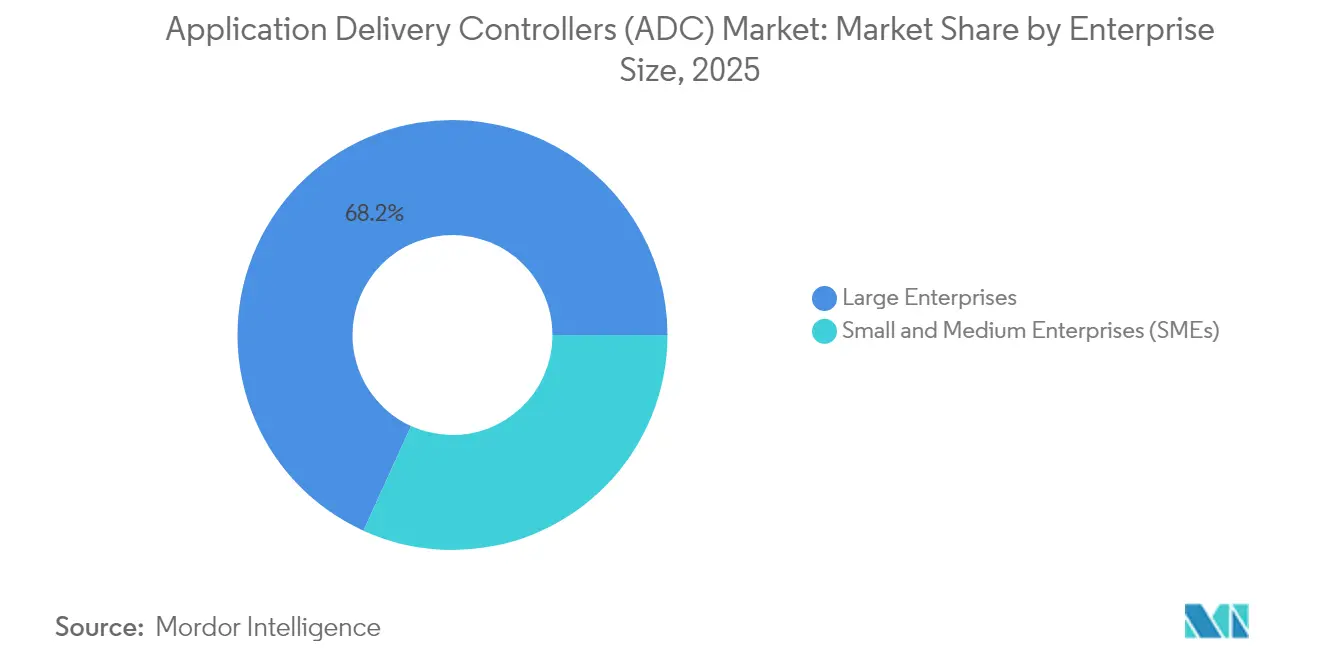
- By enterprise size, large enterprises dominated with a 68.20% share in 2025, whereas SMEs grew fastest at 10.08% CAGR.
- By vertical, IT & Telecom held 29.60% of the application delivery controllers market size in 2025; Healthcare & Life Sciences accelerated at 11.86% CAGR.
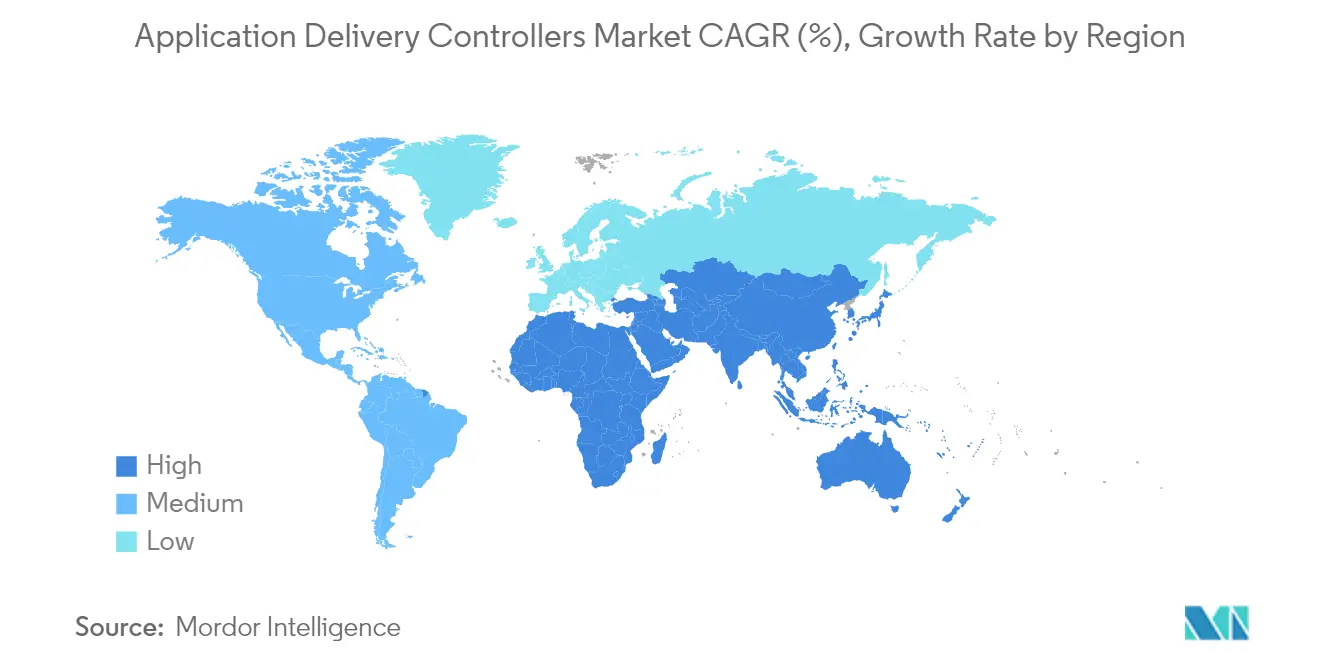
- By region, North America retained a 33.70% share in 2025; Asia-Pacific is set to climb at a 12.35% CAGR.
Note: Market size and forecast figures in this report are generated using Mordor Intelligence’s proprietary estimation framework, updated with the latest available data and insights as of 2026.
Market Trends and Insights
Drivers Impact Analysis of Application Delivery Controllers (ADC) Market*
| Driver | (~) % Impact on CAGR Forecast | Geographic Relevance | Impact Timeline |
|---|---|---|---|
| Shift Toward Cloud-Native and Microservices Architecture | +2.8% | Global, with early adoption in North America and Europe | Medium term (2-4 years) |
| Exponential East-West Data-Center Traffic Growth | +1.9% | North America, Europe, Advanced APAC | Medium term (2-4 years) |
| Regulatory Mandates for Secure Digital Banking in North America and EU | +1.2% | North America, Europe, with spillover to advanced APAC | Short term (≤ 2 years) |
| Growing 5G Roll-outs Driving Edge ADC Adoption in Asia | +1.7% | APAC, with secondary impact in North America and Europe | Medium term (2-4 years) |
| Rising Multi-Cloud and Hybrid IT Strategies among Global 2000 | +2.1% | Global, led by North America and Europe | Long term (≥ 4 years) |
| Source: Mordor Intelligence | |||
Shift Toward Cloud-Native And Microservices Architecture
More than half of enterprise workloads already run as containerized or serverless components, forcing the application delivery controllers market to pivot toward lightweight, API-centric form factors that sit inside Kubernetes clusters and service meshes. These micro-gateways inject granular traffic steering, mutual-TLS termination, and automated scaling hooks that match the ephemeral nature of modern applications [1]. Vendors are embedding schema-aware API firewalls and distributed rate-limiters to close security gaps opened by east-west service calls. As CIOs push for platform engineering, declarative “ADC-as-code” integrates seamlessly with GitOps pipelines, reducing hand-offs between Dev and NetOps.
Exponential East-West Data-Center Traffic Growth
Virtual server density has multiplied internal flows, outpacing traditional north-south patterns and elevating latency-sensitive micro-transactions. Distributed ADC instances now sit closer to workload pods, providing pervasive telemetry and inline decryption without introducing bottlenecks [2]. Financial exchanges, telcos, and gaming providers deploy thousands of lightweight proxies that collectively enforce Layer-7 policies yet adapt to bursty resource pools.
Regulatory Mandates for Secure Digital Banking
Rules such as the EU’s Digital Operational Resilience Act compel banks to prove application-layer defense in depth by January 2025. Institutions are hardening API gateways, bot management, and encrypted-traffic inspection within ADC stacks to satisfy auditors without compromising single-millisecond response-time targets. Similar statutes in the United States and Asia-Pacific replicate the compliance-driven spend trajectory.
Growing 5G Roll-outs Driving Edge ADC Adoption
Ultra-low-latency 5G services push compute toward radio access sites, elevating demand for ruggedized, power-efficient ADC micro-instances that can autonomously orchestrate QoS, content caching, and security at the edge [3]. MEC deployments for autonomous vehicles, AR/VR, and industrial IoT rely on per-packet telemetry and AI-based anomaly detection embedded inside these edge ADC footprints.
Restraints Impact Analysis of Application Delivery Controllers (ADC) Market*
| Restraint | (~) % Impact on CAGR Forecast | Geographic Relevance | Impact Timeline |
|---|---|---|---|
| Complex Layer-7 Policy Configuration Burdens IT Ops | -1.4% | Global, more pronounced in emerging markets | Medium term (2-4 years) |
| Cost Inflation of Advanced ADC Licensing Models | -1.1% | Global, with higher impact in price-sensitive regions | Short term (≤ 2 years) |
| Commoditization of Basic Load-Balancing Features | -0.8% | Global | Medium term (2-4 years) |
| Shortage of Skilled NetOps and DevSecOps Talent | -1.2% | Global, more severe in emerging markets | Long term (≥ 4 years) |
| Source: Mordor Intelligence | |||
Complex Layer-7 Policy Configuration Burdens IT Ops
Enterprise teams confront hundreds of heterogeneous applications, each demanding bespoke routing, rewrite, or WAF logic. Maintaining accuracy across multi-cloud estates strains scarce DevSecOps talent and can stall broader ADC roll-outs. Vendors answer with intent-based templates, AI-assisted rule creation, and visual dependency maps, yet skill gaps persist.
Cost Inflation of Advanced ADC Licensing Models
Subscription-tiering and add-on security modules have raised overall spend, especially for organizations migrating from perpetual hardware to SaaS-delivered ADCs. Budget-bound SMEs often delay upgrades or seek open-source substitutes, slowing penetration in price-sensitive regions until flexible, usage-metered models normalize expenditure.
*Our forecasts treat driver/restraint impacts as directional, not additive. The impact forecasts reflect baseline growth, mix effects, and variable interactions.
Application Delivery Controllers (ADC) Market Segment Analysis
By Type:
Software ADCs Disrupt Hardware DominanceHardware appliances represented 58.35% of the application delivery controllers market in 2025, supported by specialized SSL offload chips and deterministic throughput. Yet the virtual segment is scaling at 14.12% CAGR as DevOps teams embed ADC images directly into CI/CD pipelines, reducing rack footprint and accelerating rollout windows. The application delivery controllers market size for virtual solutions is forecast to surge alongside container adoption, challenging hardware’s grip on mission-critical tiers.
Mature vendors hedge by releasing container-native proxies that inherit their policy engines while shedding appliance overhead. Cost transparency plus cloud marketplace billing appeal to agile teams, driving incremental share gains for software even inside traditional enterprises. As TLS 1.3 and QUIC adoption climb, code-level agility will further tilt decisions toward software form factors, though hardware will persist for ultra-high TPS gateways in finance and telecom cores.

By Deployment:
Cloud-Managed Solutions AccelerateOn-premise instances still command 63.25% of the application delivery controllers market size in 2025, favored by sectors bound to data-sovereignty mandates. Integrated threat analytics modules and pay-as-you-grow capacity licensing now refresh legacy estates without forklift replacements .
Conversely, the cloud-managed model rises at 14.68% CAGR as platform teams offload patching, scaling, and telemetry to vendor-operated control planes. Multi-region rollouts complete in hours, and unified API policy enforcement eliminates site-level drift, making it the preferred path for digital-native firms. The application delivery controllers market continues to blend these modes through hybrid dashboards that configure hardware, virtual, and SaaS endpoints from a single console.
By Component:
Services Growth Outpaces SolutionsCore solutions—load balancing, acceleration, and integrated security—captured 69.40% revenue in 2025, but services post a sharper 11.54% CAGR as architects seek guidance on weaving ADC logic into zero-trust and platform-engineering initiatives. Consulting partners now deliver blueprint libraries, automation scripts, and continuous posture assessments that shorten value-realization cycles. Managed services contracts bundle 24/7 policy tuning, threat-signature updates, and SLO monitoring, addressing the talent crunch hindering in-house operations. This recurrent-revenue motion incentivizes vendors to enhance AIOps modules that cut mean-time-to-detect, expanding service attach rates across the application delivery controllers industry.
By Enterprise Size:
SMEs Close the Adoption GapLarge enterprises held 68.20% revenue in 2025, running multi-tier, multi-cluster ADC grids spanning private and public clouds. Central orchestration and cross-site failover protect revenue-critical platforms, making ADC refresh cycles a board-level priority.
SMEs, traditionally constrained by CapEx, now exploit SaaS ADCs with daily metering and low entry points. Growth at 10.08% CAGR reflects the democratization of sophisticated traffic management once exclusive to Fortune 500. Low-code dashboards and curated policy bundles dissolve technical hurdles, positioning the application delivery controllers market as a foundational layer for mid-market digital commerce.
By End-User Vertical:
Healthcare Accelerates Digital InfrastructureIT & Telecom accounted for 29.60% of the application delivery controllers market in 2025. Global carriers hinge on edge-deployed ADC clusters to meet stringent latency targets for voice over 5G, cloud gaming, and OTT video. Telcos also front-load AI-driven analytics to anticipate congestion and preempt outages.
Healthcare & Life Sciences grow fastest at 11.86% CAGR, catalyzed by telemedicine, imaging exchange, and electronic health record portals that demand secure, always-on access. HIPAA and GDPR mandates drive the uptake of integrated WAF and API anomaly detection. Purpose-built clinical filters accelerate DICOM streams, underscoring vertical-specific tuning within the broader application delivery controllers market.
Geography Analysis
North America Application Delivery Controllers (ADC) Market
North America retained 33.70% of the application delivery controllers market in 2025, buoyed by hyperscaler ecosystems and stringent data-privacy regulations that elevate integrated security requirements. Consolidation plays, such as F5’s reported displacement of hundreds of Citrix NetScaler estates, demonstrate churn within mature accounts.
APAC Application Delivery Controllers (ADC) Market
Asia-Pacific delivers the steepest 12.35% CAGR as 5G rollouts and Industry 4.0 agendas spur demand for low-latency, multi-tenant ADC fabrics across factories and smart cities. Government cloud programs in China and India embed ADC functionality inside sovereign clouds, driving local vendor partnerships.
Europe Application Delivery Controllers (ADC) Market
Europe balances on-prem and cloud adoption, reinforced by DORA compliance deadlines influencing bank and fintech upgrades. Regulators’ focus on data residency fuels demand for policy-driven location fencing.
MEA Application Delivery Controllers (ADC) Market
Middle East and Africa tap ADCs to underpin USD 3.7 trillion in megaproject construction, IoT-enabled utilities, and nationwide digital-government portals. Hybrid models satisfy both performance needs and limited regional data-center footprints.
South America Application Delivery Controllers (ADC) Market
South America’s financial-services modernization and retail e-commerce spur incremental uptake, with cloud-based ADCs preferred to circumvent capital constraints amid economic volatility.
Regulatory Landscape
Cybersecurity and operational-resilience mandates increasingly shape ADC procurement by requiring demonstrable application-layer controls, cryptographic assurance, and auditable operations across hybrid environments. In Europe, Implementing Regulation (EU) 2024/2690 ties cybersecurity risk-management measures for covered entities to recognized standards (including ISO/IEC 27001 and ISO/IEC 27002), reinforcing demand for ADC configurations that support consistent policy enforcement, logging, and security monitoring in regulated sectors such as financial services.
National and sectoral frameworks also add localization pressure to global deployments. In the United States, NIST FIPS 140-3 remains a central benchmark for cryptographic modules used in government systems, with Implementation Guidance updates continuing through April 2026. In practice, this is pushing vendors and enterprises to align TLS/crypto components in ADC and SSL inspection stacks with validated modules. In the Middle East, Saudi Arabia's National Cybersecurity Authority Essential Cybersecurity Controls (2024) sets minimum cybersecurity requirements for national entities and critical infrastructure, encouraging deployments that bundle WAF, DDoS protections, and configuration hardening into the ADC footprint. Vendor-side evaluation artifacts, such as F5 BIG-IP v17.5.0 security-target documentation published in March 2026, similarly point to rising demand for formally described secure configurations in high-assurance environments.
Competitive Landscape
Competition remains vigorous as legacy hardware leaders rebuild portfolios around software and AI. F5 shifted 58% of product revenue to software by 2025 and introduced an AI Gateway that optimizes model inference pipelines while enforcing API security. Citrix, rebranded NetScaler, emphasizes secure access for healthcare and public-sector clients, yet partner realignments have opened migration windows.
Cloud providers such as AWS and Azure continue to bundle native load balancers that satisfy basic routing, pressuring standalone vendors to differentiate through deep observability, TLS 1.3 acceleration, and threat-intel integration. Open-source HAProxy sustains momentum; 91% of users recommend it despite steeper self-support effort, signaling healthy community innovation.
Strategic moves in 2025 include Radware’s elastic licensing deal with a top Italian bank to counter 265% YoY growth in Web DDoS attacks, and Kubermatic’s release of KubeLB, a multi-tenant load balancer purpose-built for Kubernetes. M&A talk circles around edge-native specialists and API security start-ups, foreshadowing further convergence.
Application Delivery Controllers (ADC) Industry Leaders
-
F5 Networks Inc.
-
NetScaler (Citrix Systems)
-
Fortinet Inc.
-
A10 Networks Inc.
-
Array Networks Inc.
- *Disclaimer: Major Players sorted in no particular order

Application Delivery Controllers (ADC) Market Companies Covered in this Report
- F5 Networks Inc.
- NetScaler (Citrix Systems)
- Fortinet Inc.
- A10 Networks Inc.
- Array Networks Inc.
- Radware Ltd.
- Akamai Technologies Inc.
- Cisco Systems Inc.
- Barracuda Networks Inc.
- HAProxy Technologies LLC
- Kemp Technologies (Progress Software)
- Loadbalancer.org Inc.
- Cloudflare Inc.
- Dell Technologies Inc.
- Amazon Web Services (ALB / NLB)
- Microsoft Azure (Application Gateway)
- Alibaba Cloud (Global Server Load Balancer)
- Piolink Inc.
- Sangfor Technologies Inc.
- NGINX Inc. (F5)
Market Opportunities and Future Outlook
AI-era application delivery is creating a whitespace for ADC platforms as unified control points for model inference, API exposure, and agentic workflows, moving beyond traditional load balancing. In 2026, product actions show vendors positioning ADCs for AI governance and operational control. Citrix introduced NetScaler MCP Gateway capabilities in July 2026 to govern and observe agent traffic to Model Context Protocol servers, which expands ADC value into LLM and agentic-AI communication paths where policy, identity, and telemetry requirements are intensifying.
Kubernetes-native modernization continues to pull demand toward software and cloud-managed ADC form factors that align with GitOps and platform-engineering workflows. F5's Gold Membership in the Cloud Native Computing Foundation (announced around KubeCon + CloudNativeCon Europe in March 2026) also signals vendor alignment with Kubernetes ecosystems (Ingress, Gateway API, and adjacent service networking patterns). At the same time, operational automation and distributed fleet control remain an adoption lever for enterprises dealing with Layer-7 complexity and talent constraints. For example, F5 released fleet management capabilities for F5 Insight for ADSP in July 2026, including tamper-evident audit trails and AI-driven vulnerability response mechanisms for BIG-IP estates, which supports standardized governance across large, hybrid deployments.
Recent Industry Developments in Application Delivery Controllers (ADC) Market
- July 2026: F5 announced new fleet management capabilities for F5 Insight for ADSP aimed at improving AI cyber resilience across BIG-IP environments. The update added tamper-evident audit trails and accelerated vulnerability response workflows, reinforcing software-led operations for large, distributed ADC estates.
- December 2025: F5 released Distributed Cloud Services 7.0 with enhancements that expanded API discovery and strengthened threat detection within its application delivery platform. The release supports enterprises consolidating traffic management and security controls across hybrid multicloud environments.
- October 2024: F5 announced BIG-IP Next for Kubernetes with NVIDIA BlueField-3 DPU integration to accelerate application delivery for AI infrastructure traffic. The move aligned ADC architectures with high-throughput, low-latency data center paths used for AI training and inference, strengthening the case for hardware-accelerated and cloud-native form factors working together.
Application Delivery Controllers (ADC) Market Report Scope and Research Methodology
Market Definition and Coverage
For this study, the market includes revenue generated from application delivery controllers that sit between users and application servers to manage traffic, improve availability, accelerate delivery, and add security controls across layer 4 to layer 7.
Scope exclusions: We exclude point tools that only do DNS traffic management, standalone API gateways, or pure web application firewalls when they are not bundled with traffic steering and delivery control functions.
Segments Covered in This Report
- By Type
- Hardware-Based ADC
- Virtual/Software ADC
- By Deployment
- On-premise
- Cloud-Managed/Hosted
- By Component
- Solutions (Control, Acceleration, Security)
- Services (Integration, Managed, Training)
- By Enterprise Size
- Large Enterprises
- Small and Medium Enterprises (SMEs)
- By End-user Vertical
- IT and Telecom
- BFSI
- Retail and E-commerce
- Healthcare and Life Sciences
- Government and Public Sector
- Manufacturing and Industrial 4.0
- Media and Entertainment
- Energy and Utilities
- By Geography
- North America
- United States
- Canada
- Mexico
- South America
- Brazil
- Argentina
- Chile
- Peru
- Rest of South America
- Europe
- Germany
- United Kingdom
- France
- Italy
- Spain
- Rest of Europe
- Asia-Pacific
- China
- Japan
- South Korea
- India
- Australia
- New Zealand
- Rest of Asia-Pacific
- Middle East and Africa
- United Arab Emirates
- Saudi Arabia
- Turkey
- South Africa
- Rest of Middle East and Africa
- North America
Data Sources, Market Sizing, and Validation
Desk Research
Desk work starts with understanding the demand pool and the technology boundary, and then collecting inputs that can be reused across regions and years. We refer to public sources such as FCC and NTIA broadband indicators, NIST guidance on TLS and security controls, and NVD feeds to track vulnerability volume and severity trends that often trigger ADC refresh cycles.
We also check standards and traffic signals from bodies such as IETF RFCs and CA browser telemetry for TLS version adoption, plus cloud adoption and enterprise IT spending releases from sources such as the World Bank and OECD. Company filings, investor decks, and reputable press help us translate these signals into realistic adoption timelines for hardware, virtual, and cloud-managed deployments. Paid subscriptions are used in a limited way for company financials and structured news to keep vendor revenue direction and major contract wins consistent with the model. These sources are illustrative only, and many other public references were also used for data collection, validation, and clarification.
Primary Interviews and Surveys
To confirm sizing choices, we run interviews and surveys with product leaders, delivery and security architects, channel partners, and managed service providers across major buying regions. These conversations help us sanity check adoption by deployment model, typical refresh cycles, and the share of spending that is counted as ADC solutions versus related security and networking spend. When responses conflict, we re-contact profiles from different company types so the final assumptions reflect how enterprises buy and operate application delivery infrastructure.
Distribution of primary research fieldwork respondents
| Company type | Respondent position | Region |
|---|---|---|
| Top tier: 30% | CXOs: 15% | APAC: 41% |
| Mid tier: 51% | Functional/Unit leaders: 40% | EMEA: 37% |
| Smaller Players: 19% | Managers: 45% | Americas: 22% |
Market-Sizing & Forecasting
The model is built using a top-down approach where enterprise network and security spend is reconstructed into an ADC addressable pool by applying deployment penetration and attach rates for load balancing, acceleration, and delivery security functions. We then check totals using selective bottom-up approximations, such as sampled average selling price ranges by deployment type and expected unit volumes based on refresh cadence and installed base patterns.
Inputs used in the model include data center and cloud workload migration pace, application traffic growth and TLS adoption, security-driven upgrade pressure (for example, vulnerability cadence and compliance requirements), average contract duration for support and managed services, and the split between hardware appliances and virtual or cloud-managed ADCs. Where a clean roll-up is not possible, gaps are handled through bounded ranges that are tightened using interview feedback and regional channel checks.
For forecasting, scenario analysis is used with a base case anchored to workload growth and cloud adoption, then adjusted for pricing shifts and the pace of virtualization. Assumptions are reviewed with practitioners so the forecast reflects realistic replacement timing rather than purely linear growth.
Data Validation & Update Cycle
Outputs are checked against independent signals like regional IT spend direction, security upgrade cycles, and stated adoption of cloud-managed delivery services to ensure the market path makes sense. If a region shows a step change, the underlying drivers are re-tested and the assumptions are reviewed by a second analyst before sign-off.
Reports are refreshed annually, and interim updates are triggered when there are material events such as major pricing changes, product licensing shifts, or regulation-led security upgrades that move demand. Before delivery, we do a final pass to confirm that currency conversions, base-year alignment, and key assumptions still match the latest public and interview inputs.
Mordor Intelligence's Application Delivery Controllers Market Estimate Compared With Other Published Estimates
Published values for application delivery controllers can vary even when the topic sounds the same, mainly because the line between ADC, load balancers, and adjacent security tools is drawn differently. Differences also show up when one estimate emphasizes appliance revenue, while another leans into subscription and managed service value.
By tracking deployment penetration, refresh cycles, and support and managed service attach rates, Mordor Intelligence keeps the ADC total tied to traffic steering and delivery control use cases, and avoids counting standalone DNS or pure WAF spend that sits outside the ADC boundary.
Benchmark comparison
| Source | Market Size | Gaps in Research Methodology |
|---|---|---|
| Mordor Intelligence | USD 3.72 B (2026) | |
| Global Consultancy A | USD 5.00 B (2025) | Uses an earlier base year and appears to include a broader services stack around ADC, which can pull in implementation and support revenue beyond the ADC function boundary. |
| Industry Research Publisher B | USD 4.35 B (2024) | Anchors the series on 2024 and may apply different hardware versus virtual mix and pricing progression, which shifts the starting value even before forecast assumptions are applied. |
Overall, the spread is explained by scope edges (what gets counted as ADC versus adjacent tools), base-year alignment, and how services and pricing are treated over time. Our approach stays repeatable because it ties demand to a few observable drivers and then cross-checks the result using practical pricing and volume ranges.
Key Questions Answered in the Report
What is driving the strongest growth in the application delivery controllers market?
Rapid adoption of cloud-native microservices, 5G-enabled edge computing, and regulatory mandates for secure digital banking are propelling demand, pushing the global CAGR to 8.87%.
How large is the application delivery controllers market size today?
The application delivery controllers market size stands at USD 3.72 billion in 2026 and is forecast to reach USD 5.69 billion by 2031.
Which region is growing fastest for ADC deployments?
Asia-Pacific is the fastest-growing region with a projected 12.35% CAGR as 5G rollouts and Industry 4.0 projects multiply low-latency application needs.
Why are software ADCs gaining momentum over hardware?
Software and container-native ADCs integrate seamlessly into CI/CD pipelines, scale elastically, and reduce capital outlay, leading to a 14.12% CAGR versus hardware’s slower growth.
How are vendors addressing the skills gap in ADC management?
Providers embed AI-driven policy automation, visual configuration wizards, and managed service offerings to simplify Layer-7 rule creation and ongoing tuning for organizations lacking NetOps expertise.
What impact will regulatory frameworks like DORA have on the market?
Regulations requiring demonstrable application-layer resilience drive immediate upgrades in the financial sector, adding an estimated 1.2% boost to overall market CAGR through 2027.