
App Analytics Market Size and Share
Market Overview
| Study Period | 2020 - 2031 |
|---|---|
| Market Size (2026) | USD 9.81 Billion |
| Market Size (2031) | USD 23.74 Billion |
| Growth Rate (2026 - 2031) | 19.32% CAGR |
| Fastest Growing Market | Asia Pacific |
| Largest Market | North America |
| Market Concentration | Medium |
Major Players *Disclaimer: Major Players sorted in no particular order Image © Mordor Intelligence. Reuse requires attribution under CC BY 4.0. | |
App Analytics Market Analysis by Mordor Intelligence
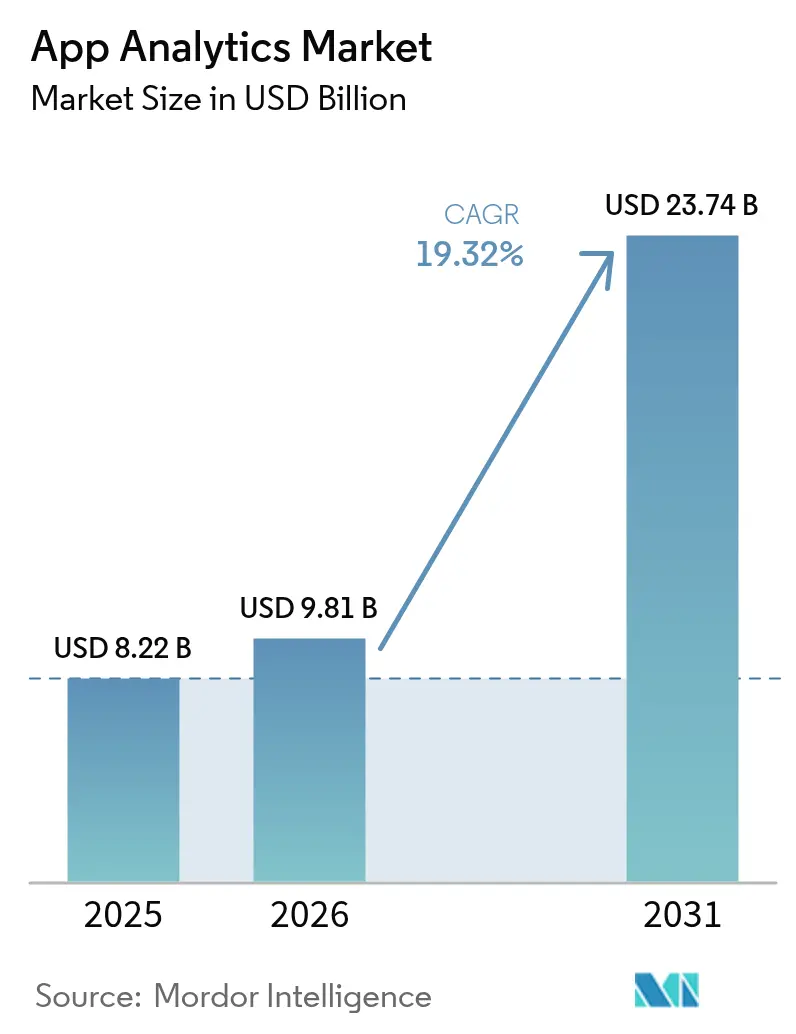
App Analytics market size in 2026 is estimated at USD 9.81 billion, growing from 2025 value of USD 8.22 billion with 2031 projections showing USD 23.74 billion, growing at 19.32% CAGR over 2026-2031. This rapid expansion is propelled by enterprises treating in-app insight platforms as mission-critical infrastructure that anchors customer experience, monetization, and compliance strategies. Accelerated 5G deployment shortens data-collection-to-decision cycles, while privacy-preserving architectures unlock user-level understanding without breaching regulations. Real-time behavioral insight now guides pricing, retention, and fraud controls across industries, prompting a wave of edge-enabled solutions that cut latency and cloud costs. Competitive intensity rises as incumbents integrate AI-driven modules and specialist vendors position privacy-first toolkits, giving CIOs a wider but more complex partner universe.
Key Report Takeaways
- By type, Mobile Apps led with 55.78% revenue share in 2025, while Progressive Web Apps are projected to expand at a 21.90% CAGR through 2031.
- By application, Marketing and Advertising Analytics accounted for 40.75% of the app analytics market share in 2025, whereas User Behaviour and Navigation Analytics is advancing at a 21.25% CAGR.
- By deployment model, Cloud retained 56.61% of the app analytics market size in 2025, and Hybrid deployment is forecast to grow at a 21.65% CAGR to 2031.
- By organisation size, Large Enterprises held 59.72% of the app analytics market share in 2025, while Small and Medium Enterprises are growing at a 22.45% CAGR through 2031.
- By end-user industry, E-commerce and Retail commanded 28.12% revenue share in 2025, whereas Healthcare is projected to record a 20.74% CAGR to 2031.
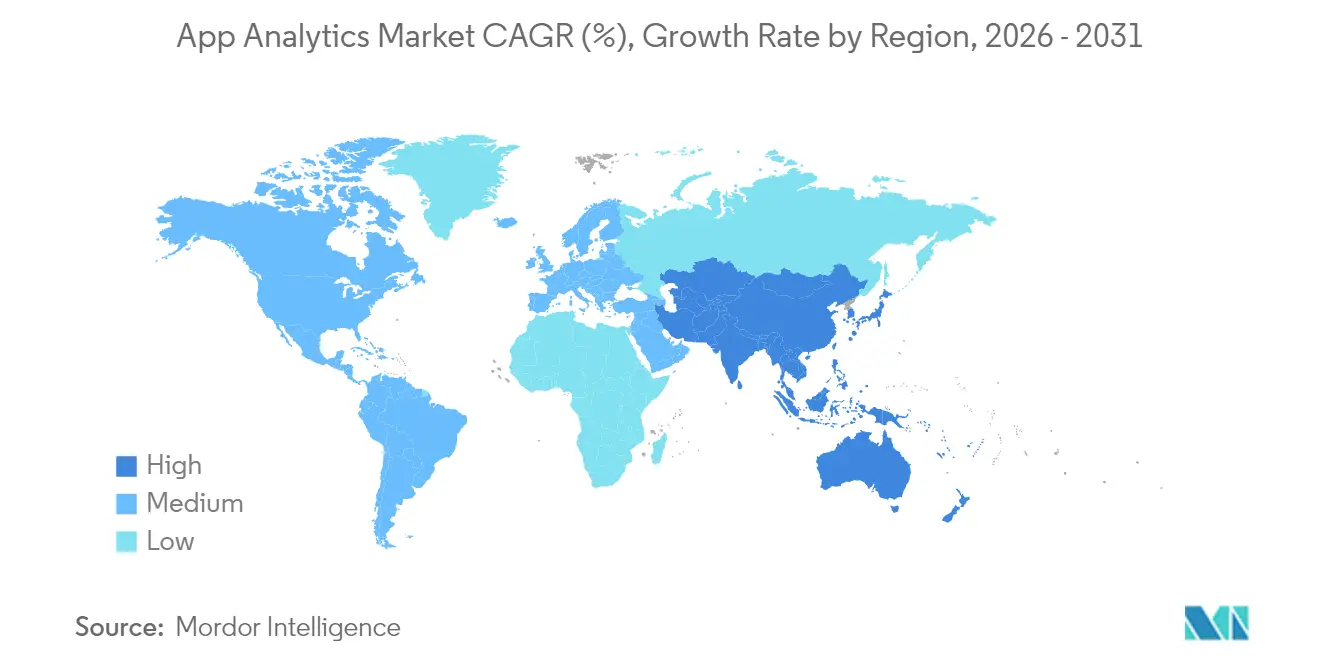
- By geography, North America captured 35.74% revenue in 2025, and Asia-Pacific is set to post a 20.98% CAGR through 2031
Note: Market size and forecast figures in this report are generated using Mordor Intelligence’s proprietary estimation framework, updated with the latest available data and insights as of 2026.
Global App Analytics Market Trends and Insights
Drivers Impact Analysis*
| Driver | (~) % Impact on CAGR Forecast | Geographic Relevance | Impact Timeline |
|---|---|---|---|
| Rising app usage across industries | +4.2% | Global | Medium term (2-4 years) |
| Rapid 5G roll-out & smartphone penetration | +3.8% | APAC core, spill-over to MEA | Short term (≤ 2 years) |
| Time-spent on mobiles driving CX analytics | +3.1% | North America & EU | Medium term (2-4 years) |
| Privacy-preserving analytics as edge | +2.9% | Global | Long term (≥ 4 years) |
| Demand for edge & real-time analytics | +2.6% | North America & APAC | Medium term (2-4 years) |
| Source: Mordor Intelligence | |||
Rising App Usage Across Industries
Enterprises well beyond retail now embed mobile interfaces into production, logistics, and field-service workflows. Volkswagen’s AI-enabled mobile monitoring trimmed factory expenses by EUR 1 billion (USD 1.13 billion) through analytics-guided optimization, illustrating how manufacturing, healthcare, and utilities rely on specialized SDKs for offline sync, IoT hooks, and compliance reporting. [1]Adrian Staar et al., “An In-Depth Case Study of Volkswagen’s AI Integration,” CEUR Workshop Proceedings, ceur-ws.org As traditional B2B firms view mobile front ends as the chief client touchpoint, the app analytics market unlocks new vertical-specific modules that monetize operational data and expand supplier ecosystems.
Rapid 5G Roll-out and Smartphone Penetration
Ultra-low-latency 5G networks enable edge engines that pre-process behavior data on the device, cutting round-trip delays by up to 90% for gaming, streaming, and AR companies. [2]International Journal of Computing and Engineering, “The Impact of Edge Computing on Real-Time Data Processing,” carijournals.org Asia-Pacific, where smartphone penetration tops 85% in urban China, South Korea, and Japan, sees predictive content delivery and real-time fraud detection become standard. These millisecond insights directly uplift retention and in-app spend, strengthening the economic case for advanced telemetry inside every release cycle.
Time-spent on Mobiles Driving CX Analytics
Users spent 4.2 trillion hours in apps last year, yielding dense, high-velocity data streams that power churn-prediction and micro-moment personalization. Banking leaders applying deep text analytics boosted fraud-detection efficiency by 35% and saved USD 15 million annually through automation. Retailers harness heat maps and session replays to shrink stockouts by 40% and fine-tune recommendations in minutes, proof that behavior telemetry converts directly into margin protection.
Privacy-preserving Analytics as Competitive Edge
Apple’s App Tracking Transparency cut identifiable traffic by 55 percentage points in the United States, forcing brands to rethink identity strategies. Firms investing in differential privacy and federated learning not only pass audits but also court user trust that drives engagement. HIPAA-compliant builds cost USD 100,000–1.25 million, a hurdle that squeezes smaller rivals and nudges buyers toward turnkey, privacy-first suites.
Restraints Impact Analysis*
| Restraint | (~) % Impact on CAGR Forecast | Geographic Relevance | Impact Timeline |
|---|---|---|---|
| Heightened data-privacy & security concerns | -2.8% | Global | Long term (≥ 4 years) |
| Stringent global data-protection laws | -2.1% | North America & EU | Medium term (2-4 years) |
| Apple ATT & death of device IDs | -1.9% | Global | Short term (≤ 2 years) |
| Uncertain ad-measurement post-cookie | -1.4% | Global | Medium term (2-4 years) |
| Source: Mordor Intelligence | |||
Heightened Data-privacy and Security Concerns
Default SDKs often siphon user identifiers without developer visibility, triggering reputational damage and fines when uncovered. Building consent layers, encryption routines, and synthetic-data pipelines inflate timelines and budgets, especially for SMEs that already cite maintenance and training as top barriers. Market growth slows where legal complexity diverts resources from feature delivery to compliance checklists.
Stringent Global Data-protection Laws (GDPR/CCPA)
Fines of up to 4% of global revenue under GDPR drive risk-averse procurement and prolonged due diligence. CCPA-style regimes demand deletion workflows and granular consent logs, increasing the total cost of ownership. Cross-border projects stall while legal teams align policies, pushing some firms toward regionalized data centers that raise operating overheads.
*Our forecasts treat driver/restraint impacts as directional, not additive. The impact forecasts reflect baseline growth, mix effects, and variable interactions.
Segment Analysis
By Type: Progressive Web Apps Accelerate Platform Convergence
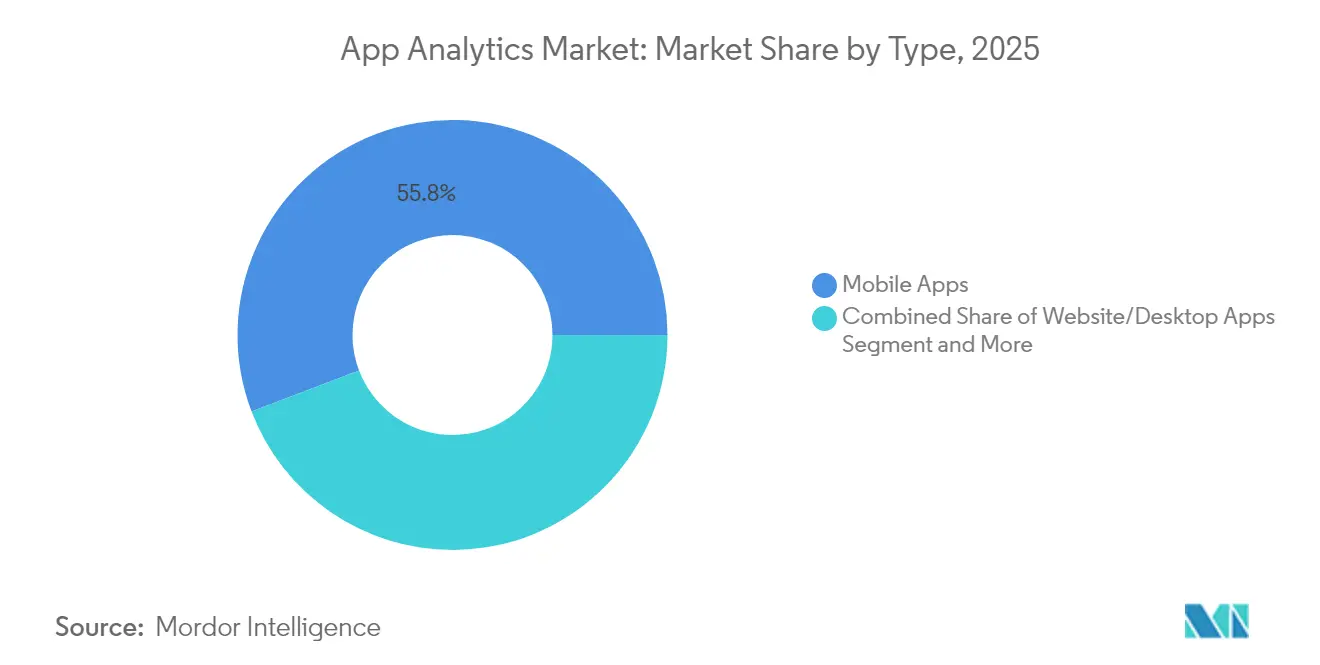
Mobile Apps retained 55.78% of 2025 revenue, underscoring their entrenched role in user engagement. Yet Progressive Web Apps are set for a 21.90% CAGR through 2031 as businesses seek a single-code-base reach without app-store friction. Intershop’s PWA deployment integrates Google Tag Manager and Matomo to refine conversion funnels, demonstrating parity with native telemetry.
The app analytics market now values platform-agnostic tracking so that product teams follow users from browser to install without losing attribution. Service workers enable offline event caching, and unified APIs let analysts compare session depth regardless of container. Vendors that unify mobile, PWA, and desktop pipelines expand wallet share as clients retire channel-specific dashboards. This fluidity cements the app analytics market as the analytics backbone for omnichannel journeys.


By Application: User Behavior Analytics Drives Retention Focus
Marketing and Advertising Analytics held a 40.75% share in 2025, but User Behaviour and Navigation tools will grow fastest at 21.25% CAGR. The shift mirrors rising acquisition costs and the superior ROI of retention. Session heatmaps, funnel drop-off alerts, and predictive churn models now ship as standard modules. Retail pilots using live clickstream feedback saw 40% inventory accuracy gains that flowed directly into margin expansion.
Forward-looking buyers demand platforms that stitch acquisition, engagement, and monetization metrics into one view. Expect packages that pair ad-source attribution with deep in-product behavior scoring so that teams can suppress spend on low-LTV cohorts. The app analytics market size for behavior-centric platforms is forecast to widen further as subscription and marketplace operators pivot budgets toward lifetime-value safeguards.
By Deployment Model: Hybrid Solutions Bridge Sovereignty and Scale
Cloud deployment captured 56.61% revenue in 2025, reflecting the appeal of zero-infrastructure onboarding. However, Hybrid configurations are on a 21.65% CAGR trajectory because regulators and CFOs push data-gravity and cost-governance agendas. AI-enabled FinOps tools that flag cost anomalies in multi-cloud estates gain prominence.
Hybrid orchestration sends sensitive payloads to on-prem or national clouds while bursting heavy compute to hyperscalers, blending compliance with elasticity. Vendors scoring wins are those offering policy-aware routing, single-pane monitoring, and unified billing. Consequently, the app analytics market share of pure-cloud-only products erodes in regulated sectors, whereas adaptable hybrids win new logos in healthcare and finance.
By End-user Industry: Healthcare Transformation Accelerates Digital Analytics
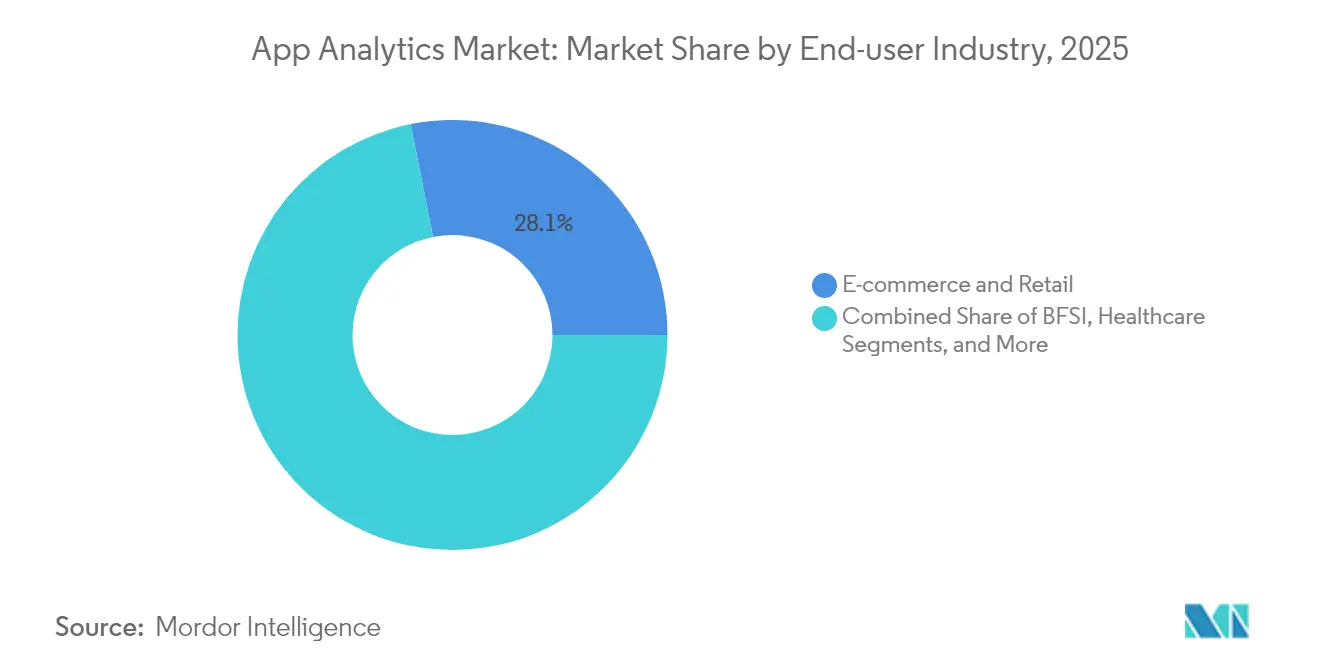
E-commerce and Retail commanded 28.12% revenue in 2025, but Healthcare is the fastest mover at 20.74% CAGR as telehealth and digital therapeutics mature. FDA clearance for apps like PanopticAI’s smartphone pulse monitor underlines regulatory appetite for mobile diagnostics. These approvals mandate HIPAA-grade analytics pipelines, spurring specialist platforms that package audit trails and consent ledgers out of the box.
Hospital networks allocate budgets to predictive readmission models and remote-patient monitoring dashboards. Vendors equipped with de-identification, cohort-building, and longitudinal outcome reporting secure contracts in a segment where data integrity stakes are life-critical. As funding such as Innovaccer’s USD 275 million round shows, capital flows to niche players capturing this vertical’s deep compliance moat.
By Organisation Size: SME Democratization Drives Market Expansion
Large Enterprises held 59.72% revenue in 2025, yet SMEs will expand at 22.45% CAGR thanks to no-code interfaces and usage-based pricing. OECD’s D4SME survey found 39% of small firms now deploy AI within analytics workflows, up from 26% a year earlier.
Barriers remain: 40% cite maintenance cost, 39% lack training. Vendors respond with guided setup wizards, embedded education modules, and partner ecosystems of fractional data scientists. Government grants and tax credits further lower entry thresholds. As democratization widens, the app analytics industry sees rising long-tail adoption that offsets slower growth in saturated large-enterprise accounts.
Geography Analysis
North America contributed 35.74% of 2025 revenue, aided by venture capital outlays that poured USD 33.9 billion into generative-AI tooling, many of which embed real-time in-app telemetry. Regulatory clarity encourages experimentation, yet new state-level privacy acts add integration overhead. Canada’s manufacturing digitization and Mexico’s export-oriented plants also fuel industrial analytics demand, supporting steady regional growth.
Asia-Pacific is the fastest-growing arena at 20.98% CAGR, underpinned by smartphone ubiquity and public-sector digital-first mandates. China’s mobile content market is racing toward USD 302.5 billion in 2030 at 29.5% CAGR. Japan’s services-export boom and India’s 143% leap in food-and-dining app downloads illustrate how sector-specific surges translate into telemetry volume spikes.
Europe balances innovation with governance. GDPR compliance drives adoption of differential privacy and federated learning, giving European vendors an exportable advantage as other regions impose similar restrictions. Germany’s Industry 4.0 programs, the UK’s open-banking wave, and France’s health-data hubs all demand analytics that fuses domain specificity with strict residency. Eastern Europe supplies cost-efficient engineering talent, anchoring provider R&D centers.

Regulatory Landscape
App analytics deployments operate under tightening privacy and data-governance regimes that shape SDK design, consent capture, and measurement methods. In the European Union, GDPR enforcement risk (fines up to 4% of global revenue) continues to influence vendor selection and due diligence, and France's CNIL clarified expectations for mobile app analytics participants in April 2025 through Deliberation No 2025-024, including how responsibilities can attach to SDK providers versus app publishers. In the United States, state privacy laws increasingly recognize device and browser level opt-out signals such as Global Privacy Control (GPC), pushing teams to implement technical enforcement beyond banner consent, with enforcement actions highlighting the operational consequences of incomplete GPC handling.
Regulation is also expanding from privacy into data access and portability obligations that affect telemetry architectures. The EU Data Act (Regulation 2023/2854) introduces design related requirements for connected products and related services, with obligations applying to certain products and services placed on the market from September 2026, which can implicate mobile apps that control connected devices and the analytics pipelines supporting them. In China, the Cyberspace Administration of China published draft rules in January 2026 on personal information collection by apps, emphasizing granular permission controls, increasing the need for configurable data minimization and permission aware event collection in analytics SDKs. Alongside this, the introduction of H.R. 8413 (SECURE Data Act) in April 2026 signals active movement toward a US federal privacy framework that could reshape multi-state compliance planning for global app analytics providers.
Value Chain Analysis
The app analytics value chain starts with telemetry generation inside mobile apps, web apps, and PWAs, implemented via SDKs, APIs, and tag management layers that capture events, performance, and revenue signals. Data then flows through consent and identity layers (consent management, GPC signal handling, probabilistic or deterministic identity where permitted) before ingestion into processing infrastructure spanning cloud data pipelines and, increasingly, edge or hybrid routing for latency and residency control. Core platform providers deliver event collection, normalization, storage, and analytics applications (dashboards, cohorting, attribution, experimentation), while adjacent partners supply enrichment signals (purchase and identity intelligence), observability tooling, and connectors into ad platforms, CRM/CDP stacks, and BI.
Bargaining power is shaped by platform gatekeepers and data signal availability. Apple and Google influence upstream measurement through OS policies and attribution interfaces, while first party platform analytics is expanding, such as Apple adding 100+ new App Store Connect metrics in March 2026 that overlap with portions of third party reporting. Downstream, media buying platforms and publishers increasingly demand interoperable measurement and automated workflows, elevating the role of independent measurement vendors and standardized protocols, as seen in Kochava aligning StationOne with IAB Tech Lab agentic advertising concepts in 2026. Key bottlenecks include scarce engineering talent for privacy safe cross device stitching and the operational cost of maintaining connectors as ad and OS measurement schemes change, which drives vendor consolidation, partnerships for signal access, and product packaging that reduces integration burden for SMEs.
Competitive Landscape
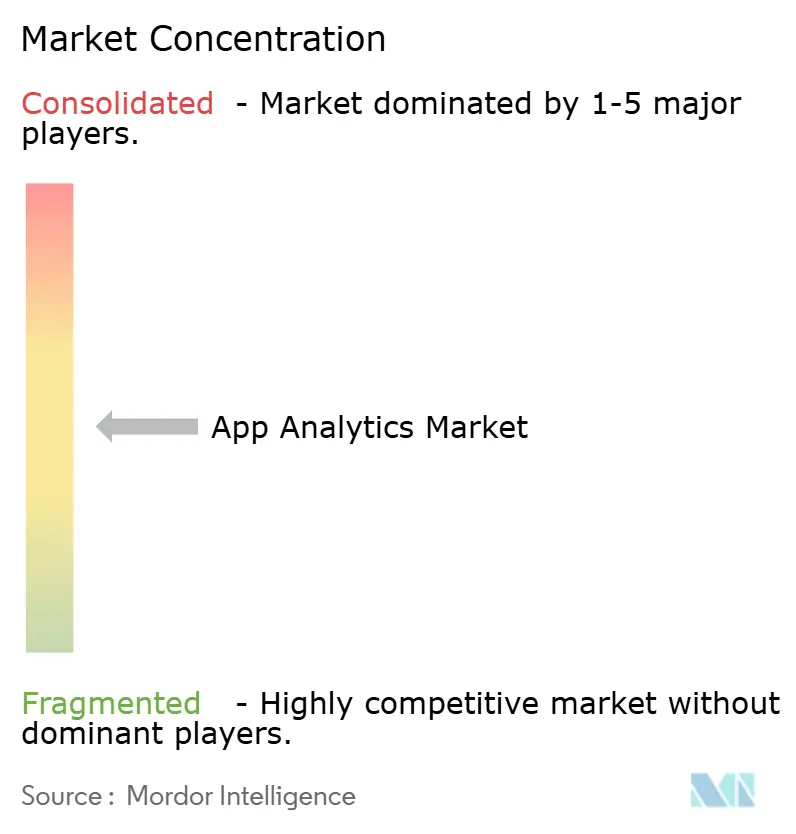
The app analytics market remains moderately fragmented. Google, Apple, and Adobe leverage platform ecosystems, while AppsFlyer, Mixpanel, and Amplitude carve niches in attribution, product, and behavioral analytics. WIPO data shows generative-AI analytics patents exploding 800% since 2017, feeding USD 4.4 trillion in yearly economic value. M&A activity centers on privacy tech and vertical modules; large vendors prefer bolt-ons over greenfield builds.
Regulatory costs act as a moat: smaller entrants must absorb legal overhead before feature velocity. Niche providers differentiate via edge deployment or zero-copy compute, courting clients that fear vendor lock-in. Meta’s patent portfolio around real-time ad bidding sets a benchmark for latency-sensitive insight pipelines. White-space persists in sector-specific suites for healthcare, manufacturing, and public services. Victory will hinge on marrying AI-powered prediction, iron-clad privacy, and hybrid orchestration at a price point palatable to SMEs.
App Analytics Industry Leaders
AppsFlyer Ltd.
Kochava Inc.
Google LLC
Amazon Web Services, Inc.
Adobe Inc.
- *Disclaimer: Major Players sorted in no particular order

Market Opportunities and Future Outlook
Signal fragmentation from privacy controls and platform level policy shifts is creating whitespace for privacy compliant data collaboration, multi source measurement, and hybrid deployment models that preserve utility without expanding risk. AppsFlyer's June 2026 Series E investment from Google, Meta, Unity, and Moloco is a clear proof point, as it targets accelerating omnichannel measurement and agentic workflows and reflects ongoing demand for neutral measurement infrastructure that can ingest diverse signals and activate audiences across channels. AppsFlyer's May 2026 Signal Hub expansion with Experian, Facteus, and Attain also points to a practical packaging path for analytics vendors to provide permissioned purchase and identity intelligence as plug in signal layers, helping customers maintain attribution and segmentation while working within consent and residency constraints.
Differentiation is shifting toward automation and first party data reconciliation as platform analytics expands. Apple adding 100+ new App Store Connect metrics in March 2026 raises the bar for baseline performance and monetization reporting, pushing third party vendors to compete on cross platform unification (app, web, PWA), deeper behavioral analysis, and operational workflows that connect insights to action in marketing and product teams. Regulatory timing also shapes roadmaps: EU Data Act obligations for certain connected products and related services from September 2026, alongside ongoing GDPR and state privacy enforcement dynamics such as GPC handling in the United States, increases demand for configurable event minimization, auditable consent logs, and policy aware routing across cloud and hybrid environments. Vendors that productize these controls as default capabilities, rather than bespoke services, gain traction in regulated industries such as healthcare and government where procurement emphasizes auditability and data governance.
Recent Industry Developments
- June 2026: AppsFlyer announced minority, non-controlling investments from Google, Meta, Unity, and Moloco to accelerate AI-powered ad measurement and agentic workflows. The transaction signaled strategic alignment among major ad platforms around maintaining independent measurement infrastructure amid signal loss and privacy constraints.
- May 2026: AppsFlyer expanded Signal Hub with Experian, Facteus, and Attain to add purchase and identity intelligence for audience activation. The move strengthened data collaboration and enrichment capabilities that support privacy-conscious targeting and measurement across fragmented ecosystems.
- December 2024: WIPO reported generative AI patent families rose from 733 in 2014 to about 14,000 in 2023, highlighting the growing IP intensity around AI-enabled analytics. This acceleration reinforces competitive pressure for app analytics vendors to invest in defensible AI modules and differentiated data processing methods.


Research Methodology Framework and Report Scope
Market Definition and Coverage
We define the app analytics market as revenue earned from software and related services that collect, process, and visualize app usage, performance, revenue, and marketing behavior data across mobile, web, and progressive web applications.
Scope exclusions: Excludes stand-alone crash loggers and basic ad-tag scripts that do not provide a unified analytics dashboard.
Segmentation Overview
- By Type
- Mobile Apps
- Website/Desktop Apps
- Progressive Web Apps
- By Application
- Marketing/Advertising Analytics
- Revenue Analytics
- In-app Performance Analytics
- User Behaviour & Navigation Analytics
- By Deployment Model
- Cloud
- On-premise
- Hybrid
- By End-user Industry
- BFSI
- E-commerce and Retail
- Media and Entertainment (incl. Social and Gaming)
- Travel and Hospitality
- IT and Telecom
- Healthcare
- Government and Public Sector
- Manufacturing
- Other End-user Industries
- By Organisation Size
- Large Enterprises
- Small and Medium Enterprises
- By Geography
- North America
- United States
- Canada
- Mexico
- South America
- Brazil
- Argentina
- Chile
- Rest of South America
- Europe
- Germany
- United Kingdom
- France
- Italy
- Spain
- Russia
- Rest of Europe
- Asia-Pacific
- China
- India
- Japan
- South Korea
- Singapore
- Malaysia
- Australia
- Rest of Asia-Pacific
- Middle East and Africa
- Middle East
- United Arab Emirates
- Saudi Arabia
- Turkey
- Rest of Middle East
- Africa
- South Africa
- Nigeria
- Egypt
- Rest of Africa
- Middle East
- North America
Data Sources, Market Sizing, and Validation
Desk Research
Desk work starts by mapping demand signals that explain why analytics spend grows with app usage. We referenced public datasets and publications such as the International Telecommunication Union (ITU) for connectivity, the World Bank for digital economy indicators, OECD digital statistics, and US Census Bureau data for business and services trends, then aligned these with mobile and web usage patterns reported in reputable press and association sites.
On the supply side, we used company filings, earnings call commentary, investor presentations, and product documentation to understand pricing logic (seat based, usage based, or event based) and typical packaging of analytics modules. Where needed, we also used paid subscriptions for company financials and intelligence, software patent lookups, and shipment-level import and export checks for certain hardware-adjacent telemetry components, which helped validate a few assumptions. These examples are illustrative only, and many other public sources were also consulted to collect, validate, and clarify specific data points.
Primary Interviews and Surveys
To ground the model, we ran expert interviews and structured surveys across app publishers, digital teams at enterprises, agencies, and solution providers that implement analytics. Respondent input was used to confirm adoption patterns by region, typical contract sizes, the split between cloud and on-premise deployments, and how buyers budget for analytics versus adjacent tools such as attribution and marketing automation.
Distribution of primary research fieldwork respondents
| Company type | Respondent position | Region |
|---|---|---|
| Top tier: 25% | CXOs: 15% | APAC: 45% |
| Mid tier: 56% | Functional/Unit leaders: 26% | EMEA: 33% |
| Smaller Players: 19% | Managers: 59% | Americas: 22% |
Market-Sizing & Forecasting
The starting point is a top-down build that reconstructs the addressable spending pool using app economy indicators and enterprise digital spend signals, then filters it through analytics adoption and average spend per customer. To keep this practical, we used a small set of repeatable inputs such as smartphone and internet penetration, app usage intensity (sessions and engagement proxy measures), cloud software spend direction, the share of apps running monetization models (ads and in-app purchases), and typical pricing meters (events tracked, monthly active users, and seats).
Results were then cross-checked with selective bottom-up approximations, using supplier revenue disclosures where available, channel checks with implementers, and sampled contract ranges discussed in interviews. This helped adjust totals when a region appeared overstated. Where vendor reporting was not clean (for example, bundled analytics inside broader marketing or product suites), we handled gaps by using allocation ratios validated through interviews and by checking consistency with customer counts and pricing ranges.
For forecasts, scenario analysis was used because buying behavior changes with privacy rules, OS level tracking limits, and shifts in ad budgets, and these drivers do not always move smoothly year to year. Assumptions for growth were stress-tested using primary feedback on expected seat expansion, event volume growth, and likely price progression for higher-value modules such as funnel analytics and cohort retention reporting.
Data Validation & Update Cycle
We validated outputs by triangulating the model against independent signals like app usage growth, enterprise software budget direction, and publicly visible pricing and packaging trends, then checked whether regional splits lined up with adoption reality shared by interviewees. When large variances appeared, the model was re-opened for logic checks (units, currency timing, and double counting risks), followed by a second analyst review before sign-off.
Reports are refreshed annually, and interim updates are made when material events occur such as major privacy changes, platform policy shifts, or sharp changes in digital advertising spend. Before delivery, an analyst performs a fresh pass on key inputs so clients receive the most current view available at the time of publication.
Mordor Intelligence's App Analytics Market Size Measured Against Other Published Estimates
Published market values for app analytics can look far apart because scope is not always drawn the same way, and the input assumptions behind pricing and adoption are often not visible. Differences also come from the chosen base year, constant versus current dollar reporting, and whether managed services revenue is counted alongside platform fees.
Stand-alone crash loggers and basic ad-tag scripts sit outside Mordor Intelligence's scope, which can pull the total away from estimates that lump in lightweight tracking tools and broader mobile marketing software. Gaps also show up when some publishers extend the forecast window far out, apply aggressive MAU growth assumptions, or use a single blended ASP that does not reflect event-based pricing and regional discounting.
Benchmark comparison
| Source | Market Size | Gaps in Research Methodology |
|---|---|---|
| Mordor Intelligence | USD 9.81 B (2026) | |
| Global Consultancy A | USD 6.89 B (2024) | Uses an earlier base year and does not clearly separate full app analytics platforms from adjacent tooling, so pricing meters and managed services treatment can be inconsistent. |
| Regional Consultancy B | USD 5.49 B (2025) | Runs a longer horizon forecast and appears to apply a broader demand pool with limited detail on constant-dollar conversion and on how bundled suite revenue is allocated to analytics. |
The table shows that the spread is largely explained by base-year choice, what is included as analytics versus adjacent marketing tools, and how pricing is translated from interviews into a repeatable model. By tying the value to clear demand indicators and realistic pricing meters, the estimate stays easier to audit and update as market conditions change.


Key Questions Answered in the Report
What is the current size of the app analytics market?
The app analytics market is valued at USD 9.81 billion in 2026 and is projected to reach USD 23.74 billion by 2031.
Which region is expanding the fastest?
Asia-Pacific is the fastest-growing region, forecast to record a 20.98% CAGR through 2031 on the back of widespread 5G adoption and digital-first policies.
Which deployment model is gaining ground over cloud-only setups?
Hybrid deployment is growing at 21.65% CAGR as enterprises blend on-prem sovereignty with public-cloud scalability.
Why are Progressive Web Apps important to future growth?
PWAs provide native-like experiences without app-store barriers and are forecast to expand at 21.90% CAGR, encouraging platform-agnostic analytics.
How are privacy regulations affecting vendor selection?
Regulations such as GDPR and CCPA elevate demand for privacy-preserving architectures, favoring vendors that ship differential privacy and consent-management features by default.
What factors limit analytics adoption among SMEs?
OECD research lists maintenance costs and employee training time as primary hurdles, although simplified SaaS models are gradually lowering these barriers.
Page last updated on:






