
Market Overview
| Study Period | 2020 - 2031 |
|---|---|
| Forecast Data Period | 2026 - 2031 |
| Base Year Market Size (2025) | USD 396.67 Billion |
| Market Size (2026) | USD 429.95 Billion |
| Market Size (2031) | USD 643.23 Billion |
| Growth Rate (2026 - 2031) | 8.39 % |
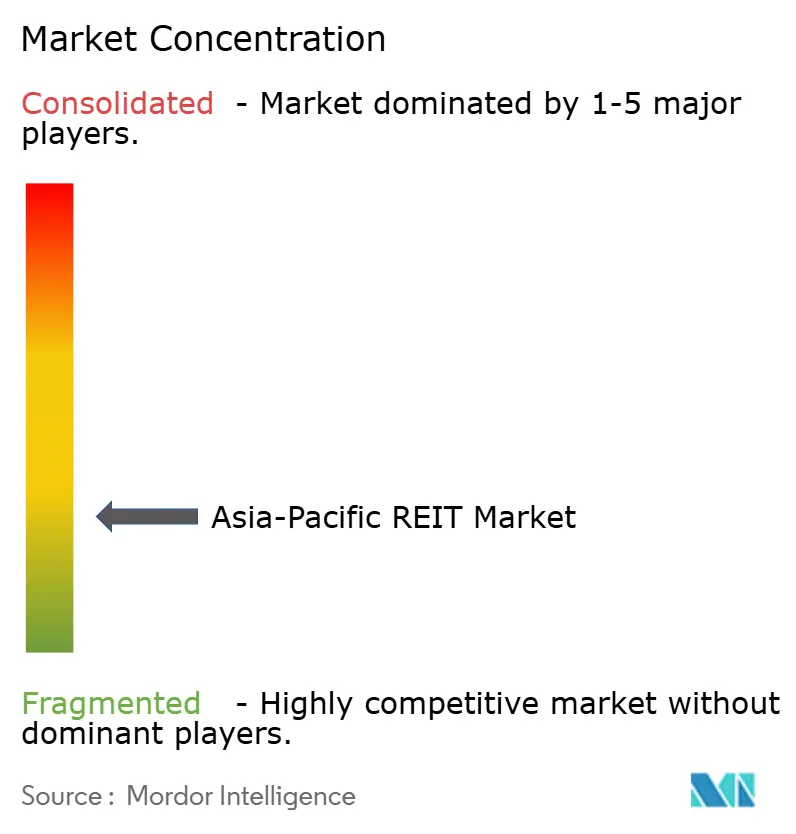
| Market Concentration | Low |
Major Players
*Disclaimer: Major Players sorted in no particular order Image © Mordor Intelligence. Reuse requires attribution under CC BY 4.0. |
|
Asia-Pacific REIT Market Analysis by Mordor Intelligence
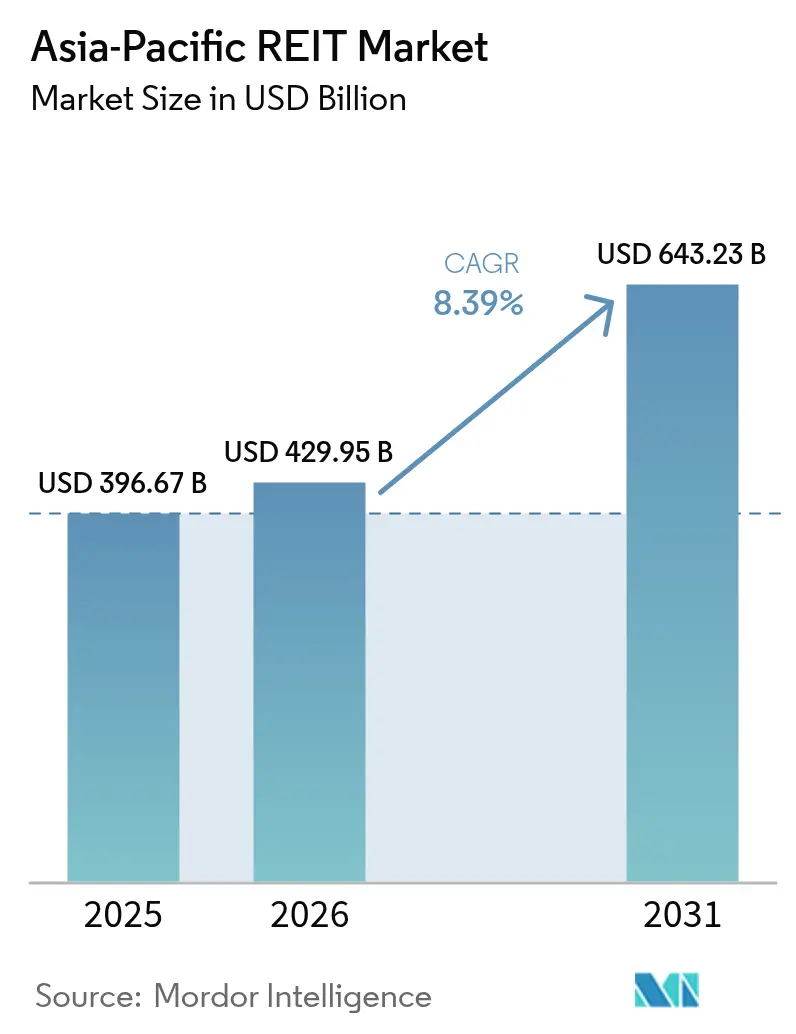
The Asia-Pacific REIT market size was valued at USD 396.67 billion in 2025 and estimated to grow from USD 429.95 billion in 2026 to reach USD 643.23 billion by 2031, at a CAGR of 8.39% during the forecast period (2026-2031). Strong capital reallocation by sovereign wealth funds, favorable regulatory tweaks that expand gearing headroom, and an accelerating shift toward digital infrastructure all underpin this growth trajectory. Cross-border investment flows into listed trusts rebounded on the back of widening yield spreads over government bonds, while accommodative monetary settings in Japan and selective easing cycles elsewhere tempered refinancing risk in early 2025. Policymakers across Singapore, India, and China continued to refine tax pass-through rules and listing frameworks, creating scalable entry points for both domestic and foreign sponsors. At the same time, ESG index inclusion requirements prompted sizable green-bond issuance and retrofit programs, reinforcing asset quality and broadening the investor base. Market participants also cited the privatization pipeline for data centers and telecom towers as a multi-year acquisition engine that should help sustain distribution growth despite pockets of interest-rate volatility.
Key Report Takeaways
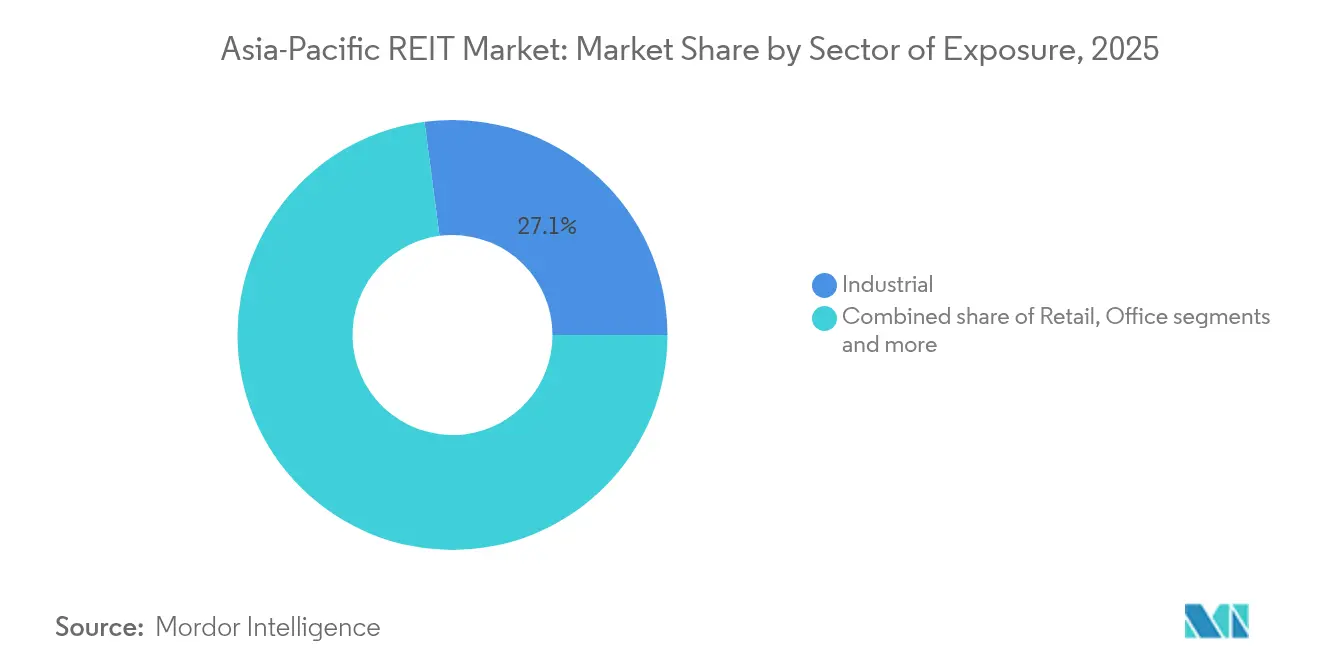
- By sector, industrial logistics assets led with 27.08% of the Asia-Pacific REIT market share in 2025; data centers are projected to expand at a 13.95% CAGR to 2031.
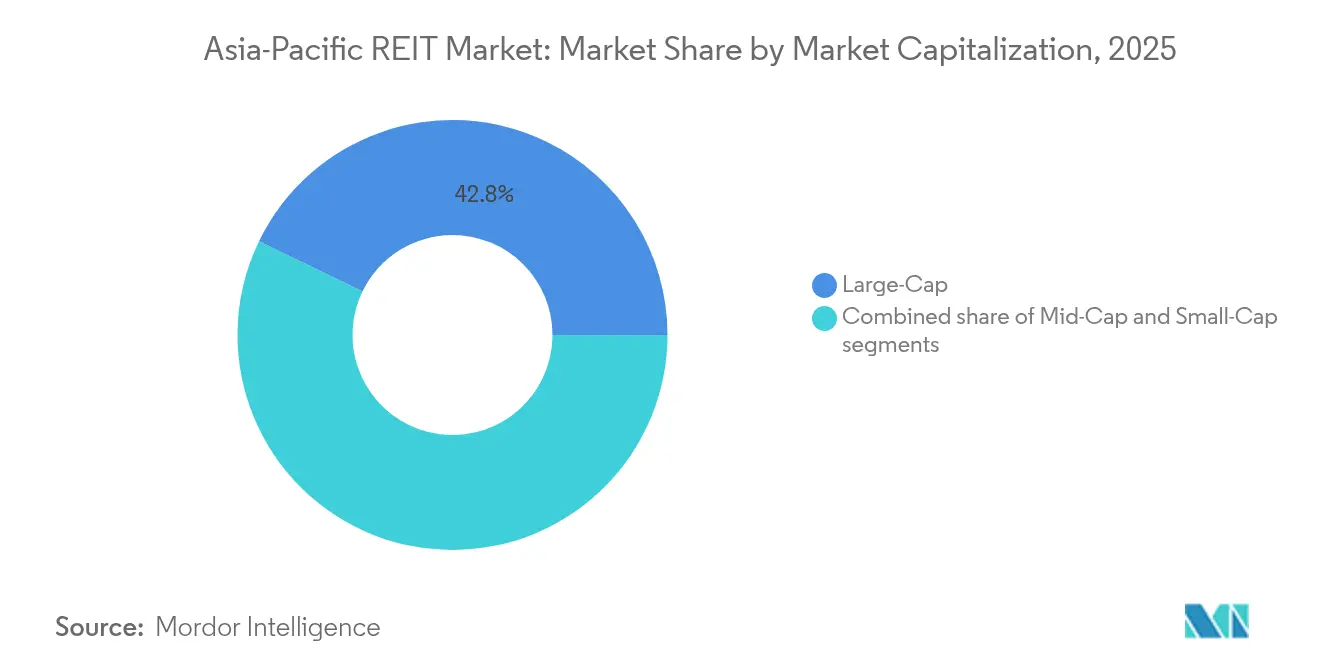
- By market capitalization, the large-cap cohort held 42.82% of the Asia-Pacific REIT market share in 2025, while the small-cap cohort is forecast to grow at a 10.22% CAGR through 2031.
- By geography, Japan accounted for 24.15% of the Asia-Pacific REIT market size in 2025, and India is advancing at an 11.07% CAGR through 2031.
Note: Market size and forecast figures in this report are generated using Mordor Intelligence’s proprietary estimation framework, updated with the latest available data and insights as of 2026.
Market Trends and Insights
Drivers Impact Analysis of Asia-Pacific REIT Market*
| Driver | (~) % Impact on CAGR Forecast | Geographic Relevance | Impact Timeline |
|---|---|---|---|
| Rising institutional allocations to listed property | +1.8% | Pan-regional | Medium term (2-4 years) |
| Supportive tax and REIT-enabling regulation | +1.2% | Singapore, India, Japan, Australia | Long term (≥ 4 years) |
| Surging e-commerce and urban logistics demand | +2.1% | China, India, Southeast Asia | Short term (≤ 2 years) |
| Portfolio diversification by pension and SWF capital | +1.5% | Global inflows to APAC | Medium term (2-4 years) |
| ESG index inclusion and green-financing channels | +0.9% | Core APAC with EU spillover | Long term (≥ 4 years) |
| Digital-infrastructure privatization pipeline | +1.0% | China, India, Indonesia | Medium term (2-4 years) |
| Source: Mordor Intelligence | |||
Rising Institutional Allocations to APAC REITs
Sovereign wealth funds and pension systems are systematically increasing APAC REIT allocations as part of broader portfolio diversification mandates. Cross-regional investment flows into Asia-Pacific surged 221% year-over-year in H2 2024, with institutional investors attracted by yield spreads averaging 130-133 basis points above risk-free rates[2]. Singapore's Government Investment Corporation and Malaysia's Employees Provident Fund have expanded REIT exposure through both direct holdings and co-investment vehicles, while Australian superannuation funds allocated USD 2.82 billion (AUD 4.4 billion) to regional property securities in 2024. This institutional capital influx provides stable funding sources for REIT expansion and acquisition activity, particularly benefiting large-cap vehicles with established track records and diversified asset portfolios.
Supportive REIT-Enabling Regulations & Tax Incentives
Regulatory harmonization across APAC jurisdictions is reducing structural barriers to REIT formation and cross-border investment. Singapore's Monetary Authority introduced enhanced leverage flexibility for REITs in 2024, allowing temporary increases to 50% debt-to-assets for strategic acquisitions, while maintaining prudential oversight through quarterly reporting requirements[3]. India's Securities and Exchange Board implemented Small and Medium REIT regulations, enabling smaller property portfolios to access public markets, with Knowledge Realty Trust's USD 576 million IPO demonstrating investor appetite for Grade A office exposure. Japan's revised J-REIT taxation framework provides additional depreciation allowances for energy-efficient retrofits, supporting portfolio modernization initiatives across the sector.
Surging E-commerce & Urban Logistics Demand
Digital commerce expansion continues driving logistics real estate demand across APAC markets, with Indonesia projecting data center capacity growth from 150 MW to 1 GW by 2030[4]. Goodman Group exemplifies this trend, with data centers comprising over 50% of its USD 13.7 billion work-in-progress pipeline and new projects in Hong Kong and Los Angeles targeting yield-on-cost returns around 9%. Urban logistics facilities command premium rents due to last-mile delivery requirements, with Singapore and Hong Kong warehouse rents increasing 8-12% annually as supply constraints intersect with e-commerce fulfillment needs. This sector benefits from long-term lease structures and built-to-suit development opportunities that provide predictable cash flows for REIT investors.
Portfolio-Diversification Hunger Among Pension & SWF Investors
Institutional investors are expanding APAC REIT allocations to reduce geographic concentration risk and capture yield premiums unavailable in developed markets. Australian superannuation funds increased international property exposure by 15% in 2024, while Canadian pension plans allocated USD 2.04 billion (CAD 2.8 billion) to Asia-Pacific real estate securities. This diversification drive particularly benefits healthcare and senior living REITs, with Parkway Life REIT's European expansion through €111.2 million French nursing home acquisitions demonstrating cross-border growth strategies. The aging demographic trend across developed Asia creates structural demand for specialized healthcare real estate, with Japan's 65+ population projected to reach 25% by 2065.
Restraints Impact Analysis of Asia-Pacific REIT Market*
| Restraint | (~) % Impact on CAGR Forecast | Geographic Relevance | Impact Timeline |
|---|---|---|---|
| Interest-rate volatility lifts funding costs | -2.3% | Global | Short term (≤ 2 years) |
| Foreign-ownership caps in select markets | -0.8% | China, Thailand, Malaysia | Long term (≥ 4 years) |
| Transition-risk CAPEX for aging non-green stock | -1.1% | Japan, Australia, Singapore | Medium term (2-4 years) |
| FX-mismatch risk on cross-border portfolios | -0.7% | Pan-regional | Short term (≤ 2 years) |
| Source: Mordor Intelligence | |||
Rising institutional allocations to listed property
Interest-rate volatility poses a significant restraint on the Asia-Pacific REIT market by inflating the overall cost of capital, making it more expensive for REITs to finance acquisitions, developments, or refinancing activities. As regional central banks adjust monetary policy in response to global inflationary pressures and geopolitical uncertainty, frequent and unpredictable rate shifts create challenges for long-term financial planning and capital allocation. Elevated borrowing costs can deter REITs from pursuing growth strategies, such as expanding their portfolios or undertaking value-enhancing redevelopment projects, due to thinner spreads and lower return prospects. Moreover, volatility in rates undermines investor confidence, as rising yields on government bonds and other fixed-income instruments erode the relative attractiveness of REIT dividend distributions. This dynamic often results in capital outflows, valuation pressures, and reduced liquidity across the REIT sector.
Supportive tax and REIT-enabling regulation
Foreign-ownership caps in select Asia-Pacific markets act as a structural barrier to broader investor participation and capital inflows. These regulatory limits, often designed to protect domestic interests or maintain economic sovereignty, restrict the percentage of REIT units that non-resident investors can hold. As a result, foreign institutional investors who are typically key drivers of liquidity and long-term capital may be deterred from entering or expanding their positions in these markets. It limits the pool of available capital and reduces competitive pressure on REITs to improve governance, transparency, and performance standards. Additionally, foreign-ownership restrictions can contribute to lower trading volumes and suppressed valuations, particularly in emerging REIT markets where local investor bases are still developing. In the long term, unless regulatory reforms are introduced, these caps could hinder cross-border investment, slow market maturation, and reduce the Asia-Pacific REIT sector’s global competitiveness.
*Our forecasts treat driver/restraint impacts as directional, not additive. The impact forecasts reflect baseline growth, mix effects, and variable interactions.
Asia-Pacific REIT Market Segment Analysis
By Sector of Exposure:
Data centers accelerate digital transformationIndustrial logistics retained leadership with 27.08% share of the Asia-Pacific REIT market size in 2025, reflecting the structural need for cross-border e-commerce fulfillment capacity. Data-center REITs, although still a smaller slice of the pie, are projected to log the fastest 13.95% CAGR through 2031 as artificial-intelligence workloads fuel hyperscale leasing demand. The Asia-Pacific REIT market benefits from the region’s distinct scarcity of institutional-grade server farms, with power and land permits acting as entry barriers. Retail malls remained the largest absolute contributor at 29.18% but saw muted rent reversions compared with logistics. Office landlords continued to pivot toward flexible-floor plates and wellness retrofits to defend occupancy above 90% in CBD corridors, whereas healthcare trusts drew support from aging demographics and government spending. Diversified vehicles used internal capital recycling to tilt portfolios toward sectors with stronger NOI growth, cushioning distribution yields against cyclical headwinds.
Longer-dated power purchase agreements in data-center portfolios offer quasi-infra cash flow that commands premium valuations. Industrial warehouse landlords such as Goodman Group are embedding solar generation on-site, forging a natural ESG hedge. Retail REITs concentrated in essential-services sub-regional centers have outperformed discretionary mall peers on footfall recovery. Healthcare assets—particularly acute-care hospitals and stabilized nursing homes—carry yield spreads above 250 basis points to comparable office stock, making them attractive to yield-oriented investors. The multi-track nature of sector performance underscores why diversified strategies inside the Asia-Pacific REIT market can mitigate single-asset-class volatility.

By Market Capitalization:
Small-cap outperforms in growth but large-cap owns liquidityLarge-cap names accounted for 42.82% of the Asia-Pacific REIT market share in 2025, anchored by platforms such as Link REIT and Goodman Group that each manage multi-jurisdiction portfolios. These giants enjoy lower funding costs-often 30-40 basis points inside small-cap peers-owing to better credit ratings and deep shareholder registers. Small-cap vehicles, however, are expected to advance at a 10.22% CAGR through 2031 as they capitalize on specialized niches-student housing in Japan, cold-storage warehouses in Malaysia, and boutique data hubs in India. Mid-cap trusts, sitting at roughly 34.7% market weight, balance external growth via acquisitions with internal value-add initiatives such as asset enhancement and cost-of-capital optimization.
Liquidity remains the key discriminator. Large-caps trade at an average free-float velocity of 0.8x compared with 0.2x for small-caps, a factor that keeps exchange-traded fund (ETF) inflows skewed toward the former. Yet, alpha-seeking active managers continue to mine the Asia-Pacific REIT industry for under-covered microcaps that can re-rate once they cross the USD 2 billion threshold. Private equity real-estate sponsors increasingly view take-private transactions as a pathway to turbo-charge growth strategies before re-listing assets at a larger scale.
Geography Analysis
Japan and Australia REIT Market
Japan’s J-REIT universe delivers a stable 24.15% market share due to long-lease office and retail assets in Tokyo and Osaka. Distribution yields hover near 3.70%, a spread of 310 basis points over five-year JGBs, though analysts caution that a 50–75 basis-point lift in base rates could shave 7% off annual distributable income. Sponsors are proactively disposing of noncore assets and locking in fixed-rate debt tenors to preserve payout ratios. Industrial heavyweights are also experimenting with sustainability-linked loans to diversify funding channels. Australia’s platform boasts a 24.03% share on the back of deeply liquid capital markets and compulsory pension inflows. Goodman Group’s USD 13.7 billion work-in-progress pipeline is more than 50% allocated to data centers, underscoring how industrial landlords are evolving into infrastructure hybrids. Retail-anchored Scentre Group reported 99% occupancy despite weak discretionary spending, aided by a tilt toward service tenants.
India REIT Market
India captured 13% of Grade-A office stock via publicly listed trusts by the end of 2024. The Asia-Pacific REIT market outlook for the country is underpinned by 70 million sq ft of annual gross leasing, the highest in the region. New SME-REIT rules lower the minimum asset value threshold to INR 0.5 billion, catalyzing listings from regional developers. Knowledge Realty Trust’s planned INR 48 billion IPO could lift the free-float market cap for India-listed vehicles by nearly 30%, accelerating index inclusion.
China REIT Market
Potential headwinds include rising land-acquisition costs and a patchwork of state stamp duties that erode headline yields. China’s infrastructure-focused C-REIT segment leapt to USD 75.35 billion (RMB 550 billion) in market cap after the second batch of offerings in March 2025 targeted power-grid and cold-chain logistics assets. While foreign ownership remains capped, cross-border feeder funds are exploring quota allocations under Qualified Foreign Institutional Investor (QFII) rules to tap into the higher-growth domestic names. Currency volatility remains manageable as revenue streams are largely RMB-denominated against RMB debt.
Regulatory Landscape
Regulation across Asia-Pacific continues to converge around tighter leverage guardrails, enhanced disclosure, and clearer eligible-asset definitions, shaping REIT balance-sheet capacity and listing pipelines. In Singapore, the Monetary Authority of Singapore (MAS) implemented a 50% aggregate leverage limit and a 1.5x minimum interest coverage ratio (ICR) from November 2024, and reinforced supervisory expectations through its updated compliance toolkit for REIT managers in February 2026. Hong Kong’s Securities and Futures Commission (SFC) issued an updated Code on Real Estate Investment Trusts in October 2024, supporting ongoing modernization and governance consistency for listed trusts.
Other jurisdictions also refreshed frameworks in 2025-2026 to widen participation while tightening process discipline. Malaysia’s Securities Commission released revised Guidelines on Listed Real Estate Investment Trusts in March 2026, while India’s Securities and Exchange Board of India (SEBI) tabled further amendments in April 2026 to ease doing business and refine investment conditions alongside the earlier SM REIT framework. Japan’s Financial Services Agency (FSA) advanced asset-management reforms in 2025-2026, including measures that allow investment managers to outsource middle and back office operations more fully, reducing operating friction for platforms managing multi-asset portfolios.
Value Chain Analysis
The Asia-Pacific REIT value chain starts with asset origination and sponsorship, typically by developers, operating real estate companies, or institutional owners that seed stabilized portfolios and pipeline assets into a listed trust. REIT managers then set strategy, allocate capital, and manage financing and risk, while trustees (and custodians, where applicable) protect unitholder interests and oversee compliance with local REIT codes. Property managers and specialist operators in sectors such as data centers, logistics, and healthcare generate net operating income through leasing, facilities management, energy optimization, and tenant retention, supported by valuation agents, auditors, and legal advisers for reporting and transactions.
Capital formation and distribution are mediated by investment banks, brokers, and placement agents that structure IPOs, follow-on equity, and debt issuance, supported by lenders and green-finance providers as ESG-linked disclosure becomes more standardized. DBS is an example of a regional financial-services platform providing underwriting and capital-markets distribution for REITs and business trusts. End investors span sovereign wealth funds, pension funds, insurers, ETFs, and retail unit holders, and their preferences increasingly drive portfolio rotation, reflected in acquisition and recycling activity such as CapitaLand Ascendas REIT’s March 2026 moves across Singapore industrial assets and a Greater Osaka hyperscale data center interest, alongside funding directed into data center development pipelines.
Competitive Landscape
The Asia-Pacific REIT market is moderately concentrated but remains competitively fragmented, offering room for consolidation and strategic specialization. The leading REITs hold a significant portion of total market share, yet many mid-tier players create space for mergers and focused sector plays. Market leadership often reflects geographic strengths, with some REITs dominating retail and car park segments in key urban centers, while others lead in industrial or logistics assets across multiple countries. This landscape allows regional champions to emerge based on localized expertise and asset performance. As a result, the market presents both scale-driven and niche-focused growth opportunities.
Strategic differentiation is increasingly based on sector specialization and depth of operational capability. REITs focused on data centers are seeing stronger investor demand, driven by rising AI adoption and power infrastructure constraints. Industrial-focused REITs are developing large-scale capacity and high pre-leasing rates, while others concentrate solely on mission-critical digital infrastructure across Asia-Pacific. Geographic diversification is also becoming a key strategy, with some REITs expanding into healthcare assets in Europe or integrating regional platforms to optimize asset portfolios. These moves support portfolio resilience and help access broader pools of international capital.
Technology integration and strong ESG compliance have shifted from being value-add features to baseline requirements. Institutional investors now expect detailed sustainability disclosures, operational efficiency reporting, and evidence of climate-aligned investment strategies. Leading REITs are responding with measurable environmental targets, renewable energy investments, and sustainability initiatives to align with global benchmarks. At the same time, market consolidation is likely in fragmented segments such as healthcare and student housing, where achieving operational scale can attract institutional backing. Ultimately, management expertise and alignment with evolving investor expectations will define the next wave of market leaders in the region.
Asia-Pacific REIT Industry Leaders
-
Link REIT
-
Goodman Group
-
Ascendas REIT
-
Nippon Building Fund
-
Scentre Group
- *Disclaimer: Major Players sorted in no particular order
Asia-Pacific REIT Market Companies Covered in this Report
- Link REIT
- Goodman Group
- Ascendas REIT
- Nippon Building Fund
- Scentre Group
- CapitaLand Integrated Commercial Trust
- Mapletree Logistics Trust
- Dexus
- Vicinity Centres
- Keppel DC REIT
- Stockland
- Mirvac Group
- GIC?sponsored REITs
- ESR REIT
- Nomura Real Estate Master Fund
- Daiwa House REIT
- Japan Retail Fund
- Frasers Logistics & Commercial Trust
- Cromwell European REIT (APAC exposure)
- GLP J-REIT
Market Opportunities and Future Outlook
Digital infrastructure continues to create scalable acquisition and funding pathways for listed vehicles, especially where sponsors already have regional pipelines and can inject stabilized capacity into REITs. Market activity in 2026 highlighted this approach, with NTT Data indicating plans to inject additional data center assets into its Singapore-listed NTT DC Real Estate Investment Trust to support regional AI-related expansion, and CapitaLand Ascendas REIT executing multiple acquisitions in March 2026, including an interest in a Greater Osaka data center. Sponsor appetite to monetize and recapitalize large-scale platforms through REIT structures is also visible in the prospective Singapore IPO pipeline, with Blackstone-backed AirTrunk reported as targeting a US$1.5 billion Singapore REIT IPO window in September or October 2026.
Regulatory refinements are opening more product design and capital deployment space, particularly in India. REIT market deepening has been supported by SM REIT rules, and in April 2026 SEBI proposed amendments to InvIT and REIT regulations, including enabling up to 10% of assets to be invested in greenfield infrastructure projects. These changes align with sector rotation themes already evident across the region, including green-certified office redevelopment financing and healthcare and senior-living platform expansion, where sponsors and managers can combine retrofit capex, green-bond channels, and long-lease demand drivers to broaden investor appeal and stabilize distributions.
Recent Industry Developments in Asia-Pacific REIT Market
- April 2026: Link REIT announced the disposal of its property interests in Swing By at Thomson Plaza, Singapore, for S$250 million. The transaction forms part of a capital recycling approach, and Link indicated proceeds were intended for unit buybacks, supporting balance-sheet flexibility and unitholder returns.
- December 2025: Goodman Group and Canada Pension Plan Investment Board (CPP Investments) launched an A$14 billion European data centre partnership. The platform expands Goodmans institutional capital partnering model and reinforces data centres as a core growth engine across its global development pipeline, with read-through for Asia-Pacific demand and financing structures.
- February 2024: Link REIT completed the acquisition of the remaining 50% interest in Shanghai Qibao Vanke Plaza for RMB 2,383.8 million, becoming the sole owner. Full control improves asset-level decision-making on leasing and capital expenditure, and it also signals selective deployment into repriced assets within mainland China retail real estate.
Asia-Pacific REIT Market Report Scope and Research Methodology
Market Definition and Coverage
We define the APAC REIT market as the total market value of listed real estate investment trust vehicles across Asia-Pacific, captured through their traded equity value and investable real estate exposure, and then expressed in USD for a consistent view.
Scope exclusions: We exclude non-listed real estate funds, direct property transactions, private REIT-like structures, and operating revenues from real estate service companies that sit outside REIT vehicles.
Segments Covered in This Report
-
By Sector of Exposure
- Retail
- Industrial
- Office
- Residential
- Diversified
- Other Sectors
- Data Centers
- Healthcare
-
By Market Capitalization
- Large-Cap (more than USD 10 billion)
- Mid-Cap (USD 2–10 billion)
- Small-Cap (less than USD 2 billion)
-
By Geography
- India
- China
- Japan
- Australia
- South Korea
- South-East Asia (Singapore, Malaysia, Thailand, Indonesia, Vietnam, Philippines)
- Rest of Asia-Pacific
Data Sources, Market Sizing, and Validation
Desk Research
Desk work starts by mapping how REIT regimes operate across major APAC markets, and what gets counted as a listed REIT. We rely on public, repeatable data points that are consistent across countries, then normalize them into a single USD series using the same currency timing.
Common reference inputs include exchange publications and market statistics, central bank releases on interest rates and capital flows, and regulator disclosures that clarify listing rules and trust structures. We also use national statistics office series for construction and property indicators, IMF and World Bank macro data, and BIS publications for cross-border finance signals. To round this out, we review REIT annual reports, exchange filings, and investor presentations, and we use paid subscriptions for company financials and news screening. Patent databases are used only when they support specific infrastructure themes (for example, data center activity). These sources are not exhaustive, and we review additional public documents and filings for data collection, validation, and classification clarification.
Primary Interviews and Surveys
Primary work is used to confirm how market value should be treated across countries, and to sanity check key assumptions around sector exposure, leverage trends, and how rate cycles translate into valuation changes. We speak with REIT managers, listed market participants, property analysts, and advisors across APAC, and we use respondent input to test whether desk-based signals match deal and capital market activity across different property types.
Distribution of primary research fieldwork respondents
| Company type | Respondent position |
|---|---|
| Top tier: 35% | CXOs: 13% |
| Mid tier: 47% | Functional/Unit leaders: 31% |
| Smaller Players: 18% | Managers: 56% |
Market-Sizing & Forecasting
Market sizing is built from a top-down reconstruction of the listed REIT universe in Asia-Pacific, where exchange-level coverage and country-level REIT counts are converted into a consistent value series and then reconciled to investable market signals. To keep the output grounded, we corroborate totals with selective bottom-up checks such as sampled REIT roll-ups by country, sector mix validation, and simple cross checks using market cap bands.
Key inputs that steer the model include listed REIT market capitalization by country, the share of large-cap, mid-cap, and small-cap trusts, and sector exposure splits (such as retail, industrial, office, residential, and data centers). Rate and spread indicators are tracked because REIT values react quickly to financing costs, and we also monitor vacancy and rent direction indicators that affect expected cash flow. Where data is uneven, gaps are handled through rule-based interpolation using comparable markets and confirmed through interviews, before totals are locked.
For forecasting, we use scenario analysis supported by trend smoothing, since forward REIT values depend on a mix of rates, macro growth, and sector-level demand. Assumptions for rate paths, sector rotation (for example, data centers versus office), and capital access are reviewed with primary respondents, then applied consistently across the forecast window to avoid sudden step changes.
Data Validation & Update Cycle
Validation is done through multiple passes, where outputs are checked against independent signals like exchange reported totals, country-level REIT listing activity, and broad real estate investment flows. When a country-level series shows a sharp jump or a drop, we re-check currency timing, corporate actions, and classification shifts, and then re-contact respondents if the variance cannot be explained with public filings.
Before sign-off, the model is reviewed by another analyst who did not build the first draft, which helps catch assumption drift and copy-forward errors. Reports refresh annually, and interim updates are triggered when there are material events such as major rule changes, a large wave of listings, or a sustained rate shock. Right before delivery, one more quick scan is completed so clients receive the latest view that matches the most recent public disclosures.
Mordor Intelligence's APAC Reit Market Size Measured Against Other Published Estimates
Published market sizes for APAC REITs can differ even when the headline topic sounds the same, because firms mix different valuation bases and sometimes combine listed trusts with broader real estate vehicles. Timing also matters, since FX conversion dates and market volatility can move USD values quickly, which then shifts what is labeled as the current year.
The main gap drivers usually come from whether the estimate is built from listed REIT market capitalization only, how sector categories like data centers are handled, and whether small-cap listings and newly added markets are fully captured. Some publishers also embed a more aggressive or conservative rate scenario into the current-year value, instead of separating current values from forecast assumptions, which can push the starting point up or down.
Benchmark comparison
| Source | Market Size | Gaps in Research Methodology |
|---|---|---|
| Mordor Intelligence | USD 396.67 B (2025) | |
| Global Consultancy A | USD 360.00 B (2025) | This figure commonly runs lower when only the largest listed REITs are counted and smaller trusts are excluded, and when USD conversion is taken from a different averaging window during volatile months. |
| Industry Association B | USD 435.00 B (2026) | This figure can look higher when it uses the next-year value as the headline, and when it includes broader listed property trust structures that are not consistently classified as REITs across all APAC markets. |
The spread in the table largely comes from what is treated as a listed REIT, how small-cap coverage is handled, and whether the published number is a true current year value or a forward year snapshot. By keeping the USD timing consistent and separating listed REIT market cap from adjacent listed property vehicles, the total stays traceable to clear country and sector inputs, a modeling choice applied by Mordor Intelligence.
Key Questions Answered in the Report
How large is the Asia-Pacific REIT market in 2026?
The Asia-Pacific REIT market size reached USD 429.95 billion in 2026 and is projected to grow at an 8.39% CAGR to 2031.
Which segment is expanding fastest?
Data-center REITs are forecast to post a 13.95% CAGR through 2031 owing to AI-driven demand for hyperscale capacity.
Why are institutional investors increasing exposure?
Yield spreads over government bonds and supportive tax frameworks are drawing sovereign wealth and pension funds into the region’s listed trusts.
What is the main regulatory tailwind?
Measures such as Singapore’s higher leverage cap and India’s SME-REIT rules have lowered structural barriers and improved cash yields.
Which geography is the fastest-growing?
India is expected to record an 11.07% CAGR through 2031, propelled by robust office absorption and new listing guidelines.
How significant are ESG considerations?
ESG index inclusion is driving substantial green-bond issuance and retrofit spending, lowering borrowing costs and broadening the investor base.