
Market Overview
| Study Period | 2020 - 2031 |
|---|---|
| Forecast Data Period | 2026 - 2031 |
| Base Year Market Size (2025) | USD 1.53 Billion |
| Market Size (2026) | USD 1.7 Billion |
| Market Size (2031) | USD 2.87 Billion |
| Growth Rate (2026 - 2031) | 11.08% CAGR |
| Market Concentration | Medium |
Major Players *Disclaimer: Major Players sorted in no particular order Image © Mordor Intelligence. Reuse requires attribution under CC BY 4.0. | |
Asia Pacific Interior Design Software Market Analysis by Mordor Intelligence
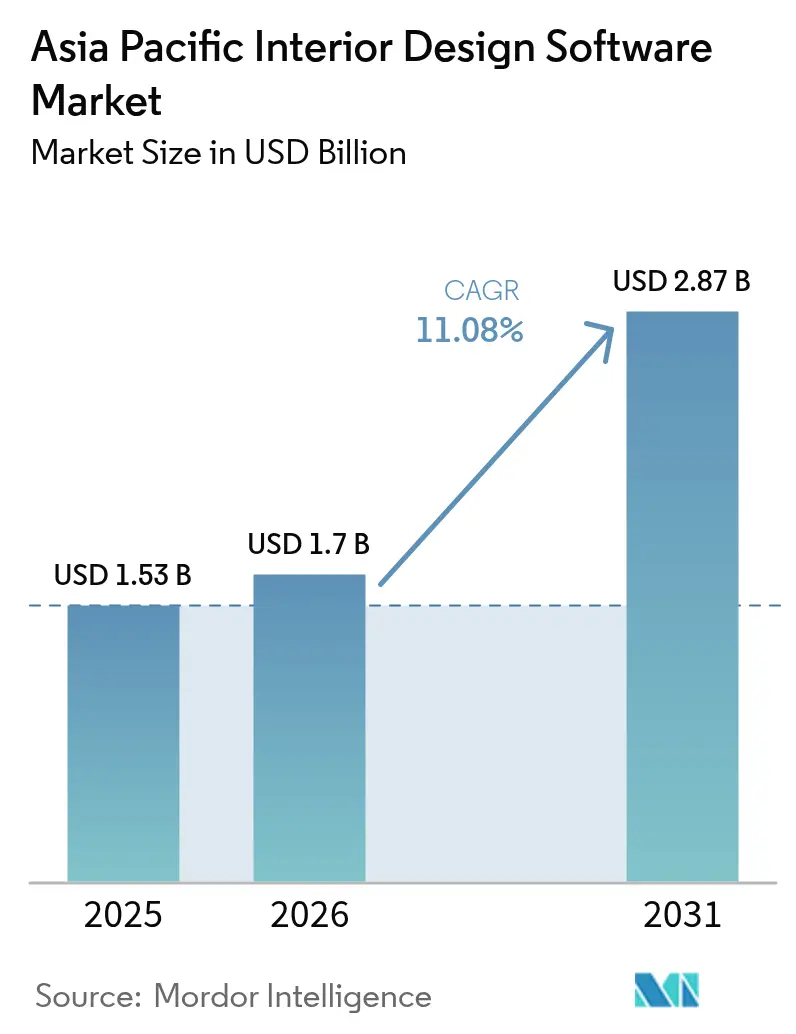
The Asia Pacific interior design software market size in 2026 is estimated at USD 1.7 billion, growing from 2025 value of USD 1.53 billion with 2031 projections showing USD 2.87 billion, growing at 11.08% CAGR over 2026-2031. The expansion stems from an accelerating shift toward cloud-native subscriptions, real-time collaboration, and embedded artificial intelligence that automates space planning and photorealistic rendering.[1]Autodesk Investor Relations, “Fiscal Q3 2025 Earnings Release,” investors.autodesk.com Trimble’s SketchUp surpassed 1 million paid users by late 2024, marking a significant shift away from perpetual licenses. China’s e-commerce-led workflows, India’s Smart Cities build-out, and Southeast Asia’s mobile-first design culture are reshaping competitive priorities. Vendors that fuse visualization with procurement and cost estimation are capturing share, while hardware-driven desktop strategies face tariff-induced cost pressure.
Key Report Takeaways
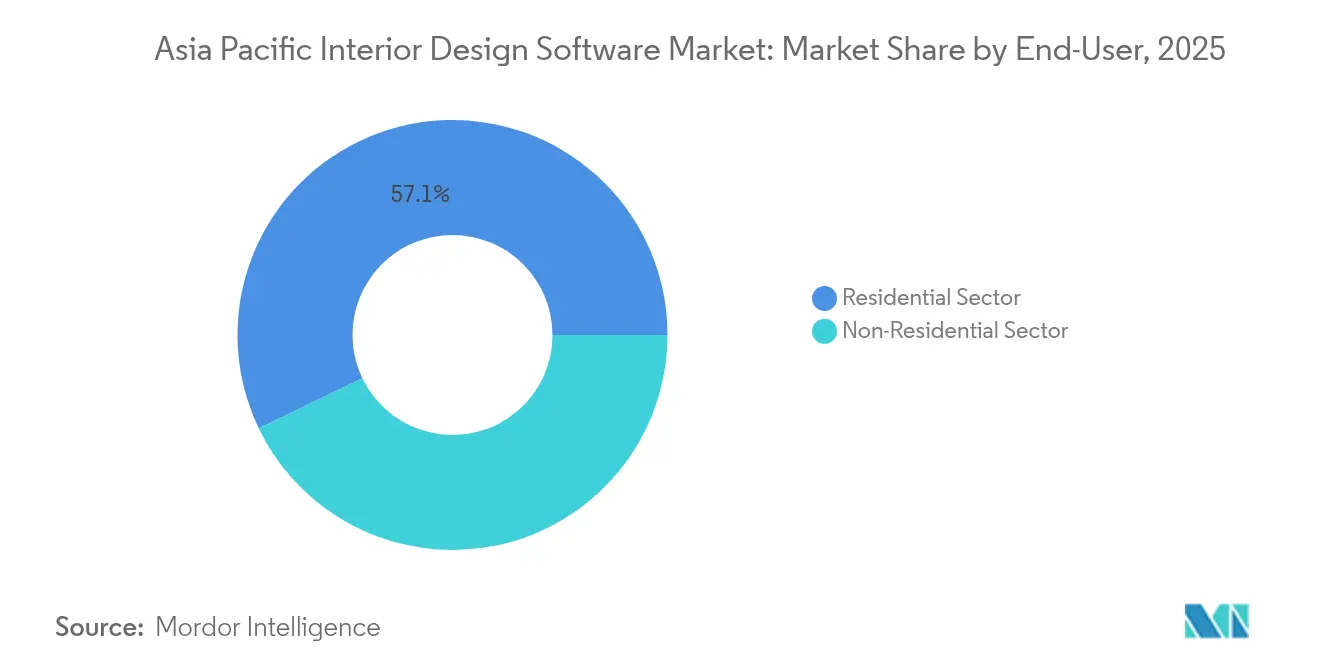
- By end-user, the residential segment led with a 57.13% share in 2025; non-residential design is projected to advance at a 13.52% CAGR through 2031.
- By deployment mode, cloud solutions held 62.52% of the Asia Pacific interior design software market share in 2025, and this segment is expected to expand at a 15.08% CAGR to 2031.
- By application, three-dimensional design and rendering accounted for 49.51% of the Asia Pacific interior design software market size in 2025, while virtual reality and augmented reality visualization are projected to show the fastest growth, with a 16.42% CAGR to 2031.
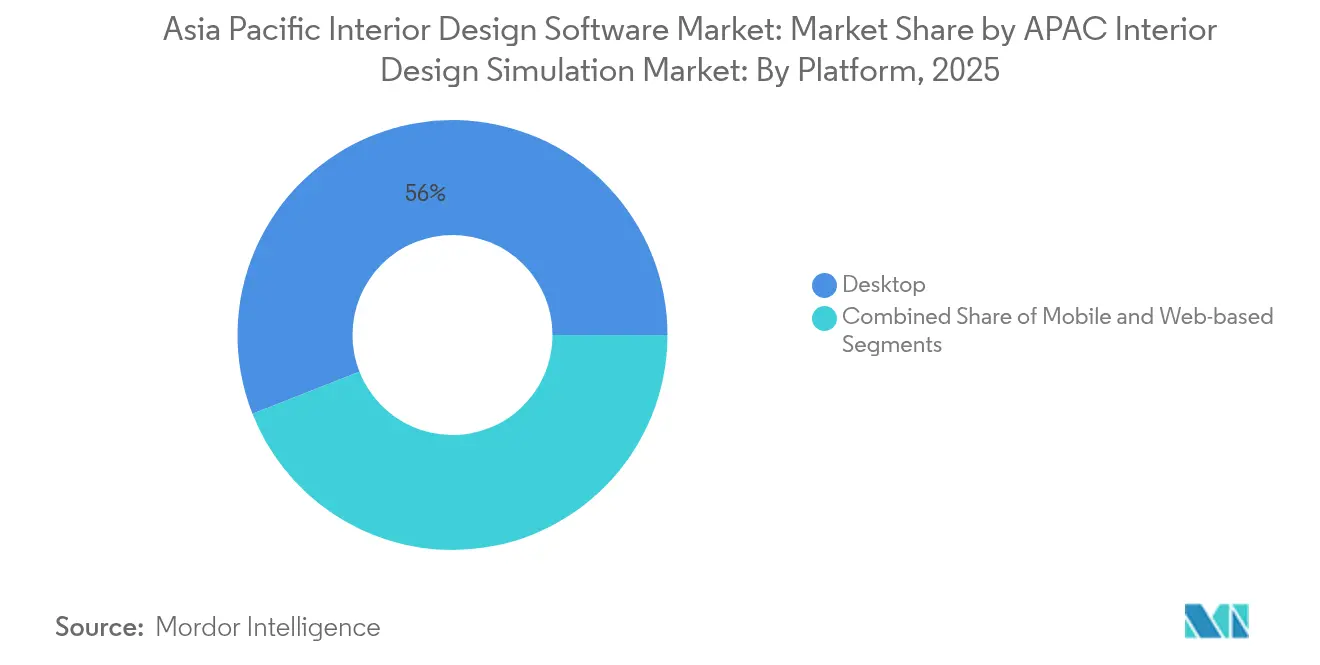
- By platform, desktop workflows secured a 55.97% revenue share in 2025; mobile platforms are projected to climb at a 15.65% CAGR through 2031.
- By license model, subscription SaaS contributed 63.02% of 2025 revenue; freemium and ad-supported tiers are forecast to grow at 16.84% CAGR.
Note: Market size and forecast figures in this report are generated using Mordor Intelligence’s proprietary estimation framework, updated with the latest available data and insights as of 2026.
Asia Pacific Interior Design Software Market Trends and Insights
Drivers Impact Analysis*
| Driver | (~) % Impact on CAGR Forecast | Geographic Relevance | Impact Timeline |
|---|---|---|---|
| Rising demand for visualization-driven home renovation | +2.3% | China, Japan, Australia, South Korea | Medium term (2-4 years) |
| Government smart-city and housing initiatives | +1.8% | India, China, Thailand, Vietnam, Singapore | Long term (≥ 4 years) |
| Surge in cloud-based design collaboration adoption | +2.7% | Whole region, strongest in India and Southeast Asia | Short term (≤ 2 years) |
| Integration of AI for automated space planning | +1.9% | China, India, Japan urban centers | Medium term (2-4 years) |
| Expansion of virtual furniture e-commerce partnerships | +1.6% | China, Indonesia, Thailand, Vietnam | Short term (≤ 2 years) |
| Hardware tariff pressures accelerating cloud rendering shift | +1.4% | Region-wide, acute in India and Australia | Short term (≤ 2 years) |
| Source: Mordor Intelligence | |||
Rising Demand for Visualization-Driven Home Renovation
Homeowners now insist on photoreal previews before committing capital to remodels. Japan recorded JPY 7.2 trillion (USD 48.6 billion) renovation outlays in 2024, with 68% of projects using digital visualization.[2]Ministry of Land, Infrastructure, Transport and Tourism, “Housing Report 2024,” mlit.go.jpAustralian households followed suit as higher mortgage rates lengthened dwelling lifecycles. Software publishers responded by integrating material-pricing APIs with design canvases, allowing users to toggle finishes against live budgets. Platforms that unify visualization and purchasing are shortening decision cycles and gaining loyalty.
Government Smart-City and Housing Initiatives
Public digital-twin mandates spill into private practice. India’s Smart Cities Mission deployed INR 48,000 crore (USD 5.8 billion) and normalized Building Information Modeling tools for municipal contractors. China’s 290 pilot smart cities require cloud collaboration for cross-agency reviews. Thailand’s Digital Economy Promotion Agency and Dassault Systèmes are certifying 500 designers annually to support Eastern Economic Corridor projects.[3]Digital Economy Promotion Agency, “Dassault Systèmes Training Center Partnership,” depa.or.thSuch mandates set interoperability baselines and anchor long-run demand for compliant platforms.
Surge in Cloud-Based Design Collaboration Adoption
Cloud usage scales fastest where on-premise GPUs have become price-constrained. AWS opened a Malaysia region in 2024, cutting render latency by 40% for Southeast Asian firms.[4]Amazon Web Services, “AWS Asia Pacific Infrastructure Update,” press.aboutamazon.com Microsoft Azure added 60% more GPU capacity in India, halving per-hour costs. With cross-border data rules clarified under China’s Personal Information Protection Law, designers can route files through Singapore nodes while maintaining compliance. Reduced costs and legal clarity accelerate the uptake of multi-site collaboration.
Integration of AI for Automated Space Planning
Generative algorithms turn software into a design partner. Dassault’s HomeByMe concept reduced concept time by 40% by automatically placing furniture after scanning room metrics. SketchUp 2025 ships “Diffusion,” generating 3D assets from text prompts and improving IFC alignment with Revit. Coohom’s engine delivers ready-to-share renders in 90 seconds. As iteration becomes instantaneous, users gravitate to platforms that treat AI as core infrastructure, not a bolt-on.
Restraints Impact Analysis*
| Restraint | (~) % Impact on CAGR Forecast | Geographic Relevance | Impact Timeline |
|---|---|---|---|
| Interoperability issues among design platforms | -1.4% | Global, sharpest where vendor mix is high | Medium term (2-4 years) |
| High subscription and training costs for SMEs | -1.8% | India, Southeast Asia, smaller Chinese cities | Short term (≤ 2 years) |
| Shortage of skilled 3D and VR designers | -1.2% | Region-wide, most acute in India, Vietnam, Indonesia | Long term (≥ 4 years) |
| Data-privacy and cybersecurity compliance gaps | -0.9% | China, India, Singapore | Medium term (2-4 years) |
| Source: Mordor Intelligence | |||
Interoperability Issues Among Design Platforms
Disparate file structures require firms to invest in multiple tools and incur manual rework. The IFC 4.3 schema, finalized in 2024, still omits parametric furniture, so assets lose editability when moved between Revit, SketchUp, or Vectorworks. Japan’s BIM mandate lacks a unified national template, resulting in regional variations that hinder coordination. Time lost to translation inflates costs and tempers adoption where projects rely on mixed vendor stacks.
High Subscription and Training Costs for SMEs
For small studios, software fees often rival payroll costs. Autodesk AutoCAD costs USD 1,865 per user per year, equivalent to 40% of a junior designer’s monthly pay in tier-2 Indian cities. Structured parametric modeling courses run USD 800-1,200 in Vietnam and Indonesia, keeping many freelancers on basic 2D tools. Freemium tiers address the gap, yet conversion depends on affordable credentials and usage-based billing.
*Our forecasts treat driver/restraint impacts as directional, not additive. The impact forecasts reflect baseline growth, mix effects, and variable interactions.
Segment Analysis
By End-User: Non-Residential Demand Outpaces Residential Maturity
The residential portion held 57.13% of 2025 revenue, reflecting early homeowner adoption of visualization for remodel budgeting. The Asia Pacific interior design software market size linked to non-residential clients is growing faster, with hospitality, retail, and co-working projects advancing at a 13.52% CAGR. Hotel builders in India used 3D walkthroughs for 62% of new rooms added in 2024. Japanese retailers repurposed physical stores as experiential showrooms, integrating VR configurators that lifted conversion by 18%.
Residential growth decelerates to 9.66% CAGR as penetration saturates tier-1 Chinese and Australian cities, though rural India and emerging Vietnamese metros remain greenfields. The Asia Pacific interior design software market is driving compliance in commercial real estate, with Singapore developers requiring BIM-ready submissions for projects exceeding SGD 50 million. Platforms able to align with building codes and procurement needs will dominate the expanding non-residential segment.


By Deployment Mode: Cloud Economics Rewrite Infrastructure Choices
Cloud deployments captured a 62.52% share in 2025 and are growing at a 15.08% CAGR, outpacing the Asia Pacific interior design software market by four points. GPU shortages pushed on-premise card prices above USD 2,200, while India’s import tariff added 28%. AWS render nodes now cost roughly USD 3 per hour, so a studio running 100 jobs a month spends USD 1,200 versus USD 18,000 annual amortization for local hardware.
Hybrid models are projected to rise at a 12.32% CAGR, where privacy laws require in-country storage, yet workloads must surge to the cloud during peaks. Autodesk’s Flex license allows toggling between desktop and cloud renders in a single SKU, shielding users from upfront capital and compliance friction. Vendors lacking seamless hybrid workflows risk losing customers as they recalibrate their cost structures.
By Application: VR and AR Visualization Disrupt Traditional Rendering
Three-dimensional design and rendering supplied 49.51% of the 2025 spend, anchoring the core workflow of the Asia Pacific interior design software market. Virtual reality and augmented reality, although smaller, are driving revenue growth at a 16.42% CAGR as retailers embed headset-based planners to shorten sales cycles. AiHouse and OPPEIN reported a 15% increase in conversions when customers manipulated layouts in mixed reality.
Two-dimensional drafting holds a 21.84% share but trails at a 7.69% CAGR because it cannot convey the spatial depth that clients expect. Standalone rendering packages face commoditization; growth now hinges on bundling cost estimation, task assignment, and version control into a single environment. Users gravitating toward platforms that consolidate design, approval, and procurement into a single session will reshape application priorities.
By Platform: Mobile-First Southeast Asia Redefines Interfaces
Desktop workflows still account for 55.97% of 2025 revenue, but mobile is adding users at a 15.65% CAGR. Indonesia has 204 million smartphone owners, yet only 68 million PC users. Consequently, designers are adopting Planner 5D and RoomSketcher for browser-based projects. Japan and South Korea cling to desktops for parametric precision, maintaining a regional share that remains elevated.
Web-based canvases grow 13.02% CAGR, favored by Vietnam’s freelancer-heavy firms that avoid licensing friction. Autodesk Forma stitched mobile photo capture to cloud terrain generation and desktop refinement into a coherent, device-agnostic loop. Vendors who ignore cross-device continuity risk irrelevance across Southeast Asia’s mobile-centric workforce.
By License Model: Freemium Unlocks Underserved Micro-Enterprises
Subscription SaaS held a 63.02% share in 2025 and remains the revenue anchor. The Asia Pacific interior design software market size tied to freemium tiers is, however, expanding at a 16.84% CAGR, the fastest lane, as India’s 63 million microenterprises test tools without upfront fees. Planner 5D reached 10 million Southeast Asian users on an ad-funded plan and converts at a 3% rate after firms grow beyond the hobby scale.
Perpetual licenses have declined by 2.29% annually since Autodesk discontinued perpetual AutoCAD in 2024. Conversion hinges on gentle paywalls: RoomSketcher caps the number of renders in its free tier, prompting upgrades once users exceed five projects per month. Coohom aligns charges with AI-generated variations, capturing value per output rather than per seat.
Geography Analysis
China controlled 41.78% of the 2025 spend, as furniture e-commerce embedded design was directly integrated into the checkout. Coohom, valued at USD 1 billion, alone holds a 23.2% local share by bundling photorealistic renders with instant purchase paths. Growth moderates to a 10.65% CAGR as tier-1 penetration nears saturation, but tier-3 cities and rural provinces still provide a runway.
India logs the fastest 14.56% CAGR, driven by Smart Cities mandates across 100 municipalities and an urban housing pipeline that added 1.2 million units in 2024. Small firms are embracing low-cost subscriptions that come with training credits, while cloud GPU expansions are reducing entry barriers.
Japan advances at an 11.12% CAGR in renovation subsidies for energy and seismic retrofits. Over 30% of homes are over 30 years old, spurring demand for design tools that model insulation and earthquake reinforcement. Local vendors who map to unique building codes gain an advantage.
Australia and South Korea each hold a 6.00-7.00% share and are growing at a near 9.85% CAGR, where replacement cycles, rather than first-time adoption, drive spending. Firms prioritize BIM interoperability with construction suites over flashy visualization.
Southeast Asia is projected to grow at a 13.18% CAGR, with Thailand, Vietnam, and Indonesia deploying AR showrooms and PropTech financing that mirrors China’s model. IKEA Thailand achieved a 12% conversion uplift by utilizing AR planners in 45 stores. Agile, mobile-first tools dominate freelancer-heavy ecosystems.
The rest of the Asia Pacific, including New Zealand and emerging South Asian states, advances at a 11.92% CAGR, driven by the cloud that eliminates infrastructure hurdles. Regional market approaches vary by location, with localized pricing strategies: freemium models for Indonesia, bundled training for India, and compliance certifications for China and Singapore.
Regulatory Landscape
Regulation across Asia Pacific increasingly links interior design workflows to BIM-based submissions and data governance, which is pushing software toward auditable collaboration and standardized exchange. In Hong Kong, Development Bureau guidelines effective 1 April 2025 made design BIM models contractually binding for all works tenders, increasing the need for version control and traceable approvals within authoring and coordination tools.
Singapore is tightening digital submission requirements through CORENET X, with a mandatory schedule of 1 October 2025 for new projects with GFA of 30,000 square meters or more and 1 October 2026 for all new projects regardless of size. In Malaysia, the National BIM E-Submission (NBeS) system incorporates automated compliance checks aligned to Uniform Building By-Laws (UBBL) and standards such as MS1183 and MS1184, reinforcing demand for platforms that can output compliant models and support automated rule validation. Regional interoperability priorities are also reinforced by the ASEAN Digital Masterplan 2030 (finalized January 2026), which emphasizes alignment with international frameworks (ISO/IEC/ITU) that shapes how cloud collaboration, file exchange, and cross-border delivery are implemented.
Value Chain Analysis
The value chain covers content creation and design authoring (2D/3D/VR), model coordination and interoperability (BIM/CDE workflows), visualization and compute (local GPUs and cloud GPU instances), and downstream commercialization through procurement and manufacturing integrations. Upstream inputs include device ecosystems (desktop workstations and mobile capture), content libraries (local SKU catalogs for finishes and furniture), and cloud infrastructure that supports rendering and multi-site collaboration. Core vendors provide the authoring and collaboration layer, including Autodesk, Trimble, and Dassault Systèmes, while regional ecosystems increasingly connect designs to quoting, ordering, and production.
Downstream, integrators and platforms link design files to sales and manufacturing execution, reducing manual handoffs between studios, retailers, and factories. Foundryx Malaysia's collaboration with Coohom and Homag illustrates this direction, using an approach structured to integrate design, sales, and manufacturing into a digital workflow aligned with the report's emphasis on visualization combined with procurement and cost estimation. Key bottlenecks center on compute economics and compliance, since GPU price volatility and import frictions increase the appeal of browser and cloud rendering, while data localization and security requirements influence where vendors host project data and how they implement access control, audit logs, and component risk management.
Competitive Landscape
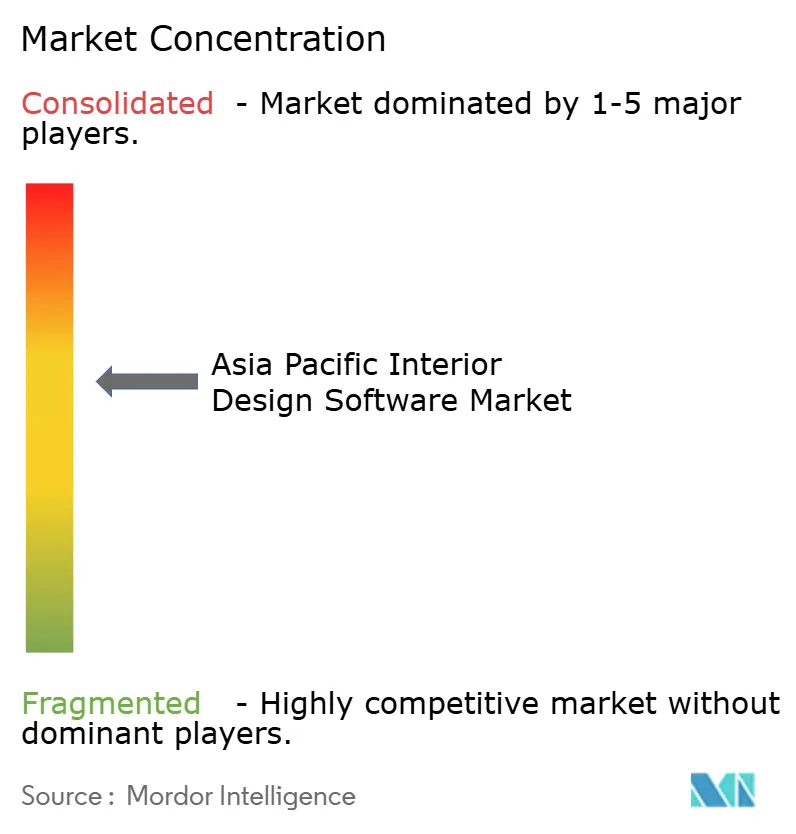
The top five players, Autodesk, Trimble, Dassault Systèmes, Coohom, and AiHouse, hold a prominent share, positioning the Asia Pacific interior design software market in a moderately fragmented landscape. Autodesk locks enterprise customers by linking AutoCAD, Revit, and BIM 360; switching costs exceed USD 50,000 for mid-size firms. Trimble’s SketchUp has surpassed 1 million paid users, driven by text-to-3D Diffusion AI and tighter IFC schemas that facilitate seamless Revit handoffs.
Chinese vendors grow through localized libraries. Coohom offers 2 million native SKUs, compared to 400,000 in SketchUp’s Asia catalog, accelerating the design of locally sourced furnishings. AiHouse blends mixed reality with cabinet makers to boost conversion. Regional newcomers, such as Foyr in India and Infurnia, are introducing API-first configurators that retailers embed in their e-commerce journeys, thereby bypassing traditional desktop interfaces.
Strategic alliances mark 2024-2025. Dassault and Thailand’s DEPA opened a BIM academy certifying 500 designers yearly. AWS’s Malaysia region slashed render latency by 40% in Southeast Asia. Microsoft doubled A100 and H100 GPU capacity in India. Firms that clear China and India data-privacy hurdles can serve regulated public projects, while agile start-ups capture the long tail of micro-enterprises with pay-as-you-go plans.
Asia Pacific Interior Design Software Industry Leaders
Dassault System SE
Autodesk Inc
Trimble, Inc.
Foyr LLC
Infurnia Technologies Pvt. Ltd
- *Disclaimer: Major Players sorted in no particular order

Market Opportunities and Future Outlook
Opportunities are clustering where regulatory and workflow change force upgrades from standalone desktop design to connected BIM and Common Data Environment patterns that support submission, review, and traceability. In Singapore, the CORENET X timetable creates near-term whitespace for interior design software providers that can package BIM-ready outputs, collaboration controls, and governed exchange formats into a single workflow for architects, interior consultants, and contractors, given the mandatory requirements from 1 October 2025 for large new projects and 1 October 2026 for all new projects.
Another opportunity is integrating design with procurement, quoting, and off-site production, particularly in Southeast Asia and China where design is increasingly tied to e-commerce-style conversion and fast SKU substitution. The Foundryx Malaysia partnership with Coohom and Homag is a concrete signal of this value shift toward design-to-manufacture connectivity, and it favors vendors that provide APIs, configurable catalogs, and cost estimation alongside rendering. AI-enabled acceleration also remains an adoption lever, but vendors can defend monetization more effectively when they pair automation with interoperability and compliance, including support for mixed stacks and IFC alignment rather than focusing only on aesthetic rendering outputs.
Recent Industry Developments
- May 2026: Foyr released the Foyr Project Management tool, extending its platform beyond design into execution workflows. This expands addressable use cases from concept and visualization to task tracking and coordination, aligning with rising demand for collaboration features across distributed teams in Asia Pacific.
- October 2025: Foyr announced the launch of AI Hub in Foyr Neo, adding generative AI capabilities such as image-to-3D conversion and AI-assisted post-processing. The release increases competitive pressure on incumbents and regional vendors to embed AI into everyday design and iteration loops rather than treating it as an add-on.
- July 2024: Dassault Systèmes signed an MoU with Thailand's Digital Economy Promotion Agency (depa) and Silpakorn University to establish an industry training center supporting smart city and urban planning talent development. The initiative strengthens local skills pipelines and increases the pool of tool-trained users that can adopt 3DEXPERIENCE-based workflows in public and private projects.


Research Methodology Framework and Report Scope
Market Definition and Coverage
For this methodology, the market covers revenue earned from interior design software used to plan spaces and create 2D layouts and 3D designs, including rendering and visualization features, that are sold to users across APAC through licenses or subscriptions.
Scope exclusions: We exclude interior design services revenue, general construction management software that is not used for interior design workflows, and pure hardware sales (such as VR headsets) even when used with design tools.
Segmentation Overview
- By End-User Industries
- Residential Sector
- Non-Residential Sector
- By Deployment Mode
- On-Premise
- Cloud
- Hybrid
- By Application Type
- 2D Design And Drafting
- 3D Design And Rendering
- VR And AR Visualization
- Project Management And Collaboration
- By Platform
- Desktop
- Mobile
- Web-Based
- By License Model
- Perpetual One-Time License
- Subscription SaaS
- Freemium / Ad-Supported
- By Country
- China
- India
- Japan
- South Korea
- Australia
- Southeast Asia
- Rest of Asia Pacific
Data Sources, Market Sizing, and Validation
Desk Research
Desk work starts with getting the boundary right, so we first map what counts as interior design software in practice, and then align it with common product delivery models (subscription, perpetual, and freemium) across APAC. We reference public sources that help anchor adoption and demand signals, such as OECD and World Bank digital indicators, ITU connectivity statistics, national statistics offices for construction and housing activity, and UN Comtrade where relevant for related hardware trends that can influence visualization use.
We also review company annual reports, investor presentations, reputable press coverage, and association publications that discuss design and construction digitization, cloud software adoption, and pricing changes. In a few cases, paid subscriptions for company financials and intelligence, patent databases, and import export shipment level views are used to cross-check scale and timing for product rollouts and demand cycles. The sources listed here are illustrative only, and many other public and paid references were also used for collection, clarification, and validation.
Primary Interviews and Surveys
Primary work is used to confirm what buyers actually pay and how they deploy these tools, which is important in a market where bundles, seat counts, and usage based add-ons can move the final value. We speak with a mix of software providers, channel partners, interior design studios, and commercial users across key APAC countries to validate assumptions on subscription mix, renewal behavior, and the split of desktop versus cloud use.
Distribution of primary research fieldwork respondents
| Company type | Respondent position | Region |
|---|---|---|
| Top tier: 25% | CXOs: 14% | |
| Mid tier: 58% | Functional/Unit leaders: 32% | |
| Smaller Players: 17% | Managers: 54% |
Market-Sizing & Forecasting
The core sizing starts from a top-down approach where the APAC demand pool is reconstructed using digitization signals and design activity indicators, and then filtered into addressable software spend for interior design use cases. Results are then checked with selective bottom-up approximations, such as sampled subscription price points times estimated paid seats, channel feedback on deal sizes, and supplier roll ups where revenue is reported or can be reasonably inferred.
Key inputs used in the model include the share of cloud versus on-premise deployment, typical subscription seat pricing and discounting patterns, adoption of 2D drafting versus 3D rendering and VR or AR visualization modules, usage of project management and collaboration features that can trigger higher plans, and construction and housing activity that influences project starts. Where data is thin for smaller countries, gaps are handled by using proxy penetration rates from comparable APAC markets and then adjusting through interview feedback on affordability and buying cycles.
For forecasting, scenario analysis is applied so growth is tied to a small set of drivers that interviewees consistently pointed to, including cloud migration pace, new user additions in residential versus non-residential workflows, and expected pricing progression by license model. The output is reviewed each step so that the implied revenue per user and growth rates stay realistic by country and by product delivery method.
Data Validation & Update Cycle
Validation is done through triangulation across independent signals, and then through variance checks that flag outliers at the country level and across license models. When a number looks off, we revisit assumptions, re-check currency conversion timing, and re-contact relevant respondents to confirm whether the variance is explained by pricing moves, bundling, or a shift in cloud adoption.
Before sign-off, the model goes through multiple analyst reviews so calculation logic, assumptions, and outputs are consistent with the defined scope and with observable demand indicators. Reports are refreshed annually, and interim updates are made when material events occur, such as major pricing changes, product packaging shifts, or step changes in adoption. Right before delivery, an analyst performs a fresh pass to ensure clients receive the most current view supported by the latest checks.
Mordor Intelligence's APAC Interior Design Software Market Size Compared With Other Published Estimates
Published market values for this space can look different because the scope boundary is set differently, and because pricing is treated in different ways, especially where subscription plans and add-ons are changing quickly. Differences also show up when firms choose different base years, currency conversion timings, and what they count as interior design software versus adjacent design or construction tools.
In a refresh-led approach, the update cadence and the way subscription ASP progression is rolled forward usually become the biggest drivers of the spread, followed by whether freemium and ad-supported models are counted as meaningful revenue. By rechecking conversion rates and plan mix changes close to the release window, and then validating implied revenue per paid seat with APAC interview inputs, the estimate stays tighter to current conditions in Mordor Intelligence.
Benchmark comparison
| Source | Market Size | Gaps in Research Methodology |
|---|---|---|
| Mordor Intelligence | USD 1.53 B (2025) | |
| Trade Journal A | USD 1.06 B (2023) | Uses an earlier base year and a shorter window, and the definition described is closer to apartment space-planning tools, which can undercount broader 3D rendering, collaboration, and cross-sector use in APAC. |
| Regional Consultancy B | USD 1.31 B (2025) | Appears to apply a different pricing and plan-mix assumption for subscriptions, and it is unclear how hybrid deployment and freemium monetization are treated, which can compress the 2025 total versus a fuller license-model build. |
The table shows that most gaps come from timing and scope choices, not from a single math issue, since base year selection, currency conversion points, and what modules are counted can each move the total. Our method keeps the value traceable by tying the model to observable deployment mix, license model splits, and interview-checked pricing ranges, so the market size can be reproduced and updated without changing definitions each cycle.


Key Questions Answered in the Report
How large is the Asia Pacific interior design software market in 2026?
The market stands at USD 1.7 billion in 2026 and is forecast to hit USD 2.87 billion by 2031.
Which deployment mode is expanding fastest across the region?
Cloud-based implementations lead with a 15.08% CAGR thanks to falling GPU cloud costs and regional data-center additions.
What is driving non-residential software uptake?
Hospitality, retail, and co-working renovations adopt 3D and VR tools to differentiate guest experience, pushing non-residential demand at 13.52% CAGR.
Which country shows the fastest growth?
India advances at 14.56% CAGR, propelled by Smart Cities mandates and an urban housing boom.
Page last updated on:






