
Anti-Pollution Mask Market Size and Share
Market Overview
| Study Period | 2021 - 2031 |
|---|---|
| Market Size (2026) | USD 15.61 Million |
| Market Size (2031) | USD 30.15 Million |
| Growth Rate (2026 - 2031) | 14.11 % |
| Fastest Growing Market | Asia Pacific |
| Largest Market | Asia Pacific |
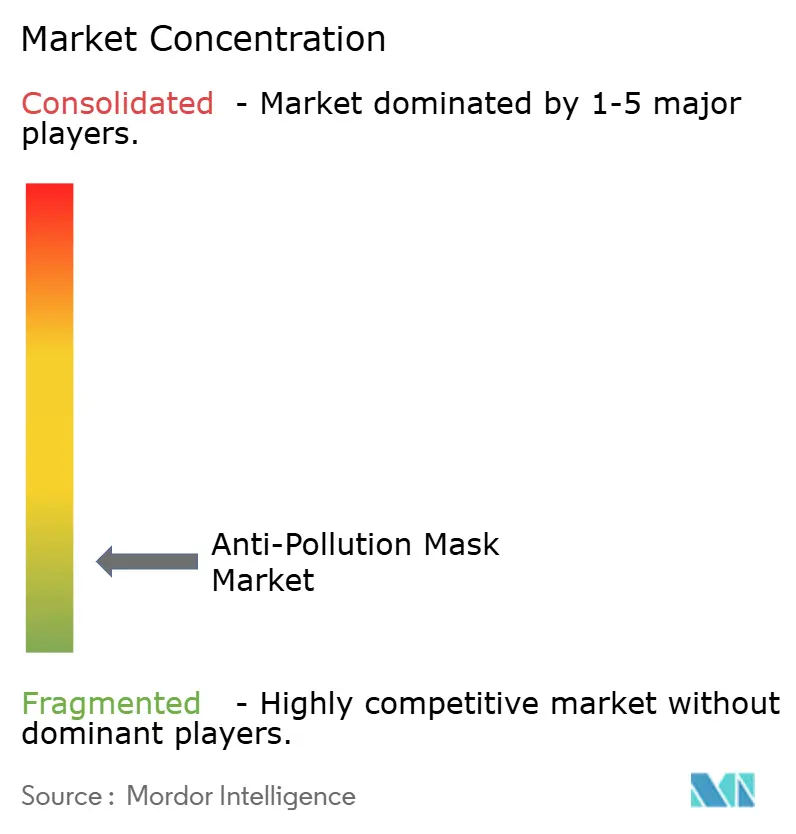
| Market Concentration | Low |
Major Players
*Disclaimer: Major Players sorted in no particular order Image © Mordor Intelligence. Reuse requires attribution under CC BY 4.0. |
|
Anti-Pollution Mask Market Analysis by Mordor Intelligence
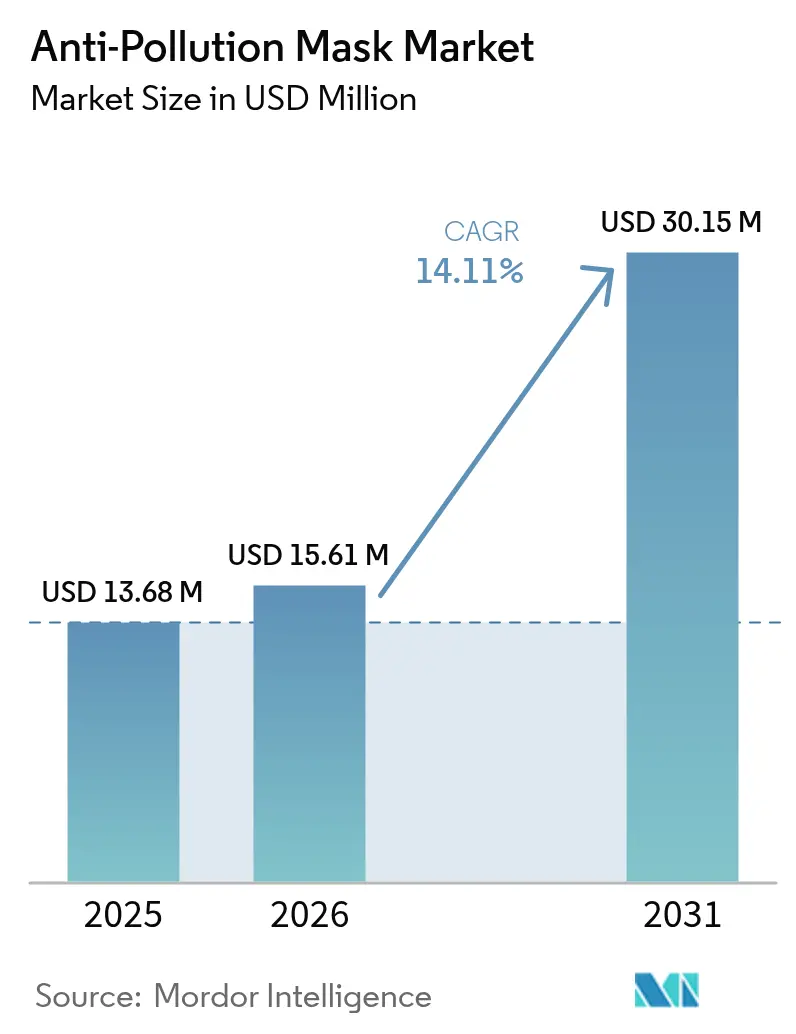
The anti-pollution mask market size is expected to grow from USD 13.68 million in 2025 to USD 15.61 million in 2026 and is forecast to reach USD 30.15 million by 2031 at 14.11% CAGR over 2026-2031. This growth is driven by stringent air quality regulations across major economies, particularly in the Asia-Pacific and North America regions. Cities worldwide are becoming increasingly hazardous to breathe in, with rising air pollutants like particulate matter (PM2.5 and PM10), vehicle emissions, industrial gases, dust, allergens, and seasonal smog taking center stage. Technological advancements are driving a surge in demand. Innovations like multi-layer filtration systems, nanofiber materials, rechargeable micro-ventilators, and sensor-equipped smart masks have enhanced both the efficacy and comfort of masks, drawing in health-conscious and tech-savvy consumers. Additionally, the widespread availability of masks in both offline retail outlets and online platforms has significantly boosted their global accessibility. Additionally, the COVID-19 pandemic has significantly influenced consumer behavior, leading to increased awareness about respiratory protection and air quality. The rising industrialization, urban air pollution levels, and growing health consciousness among consumers have further accelerated market expansion.
Key Report Takeaways
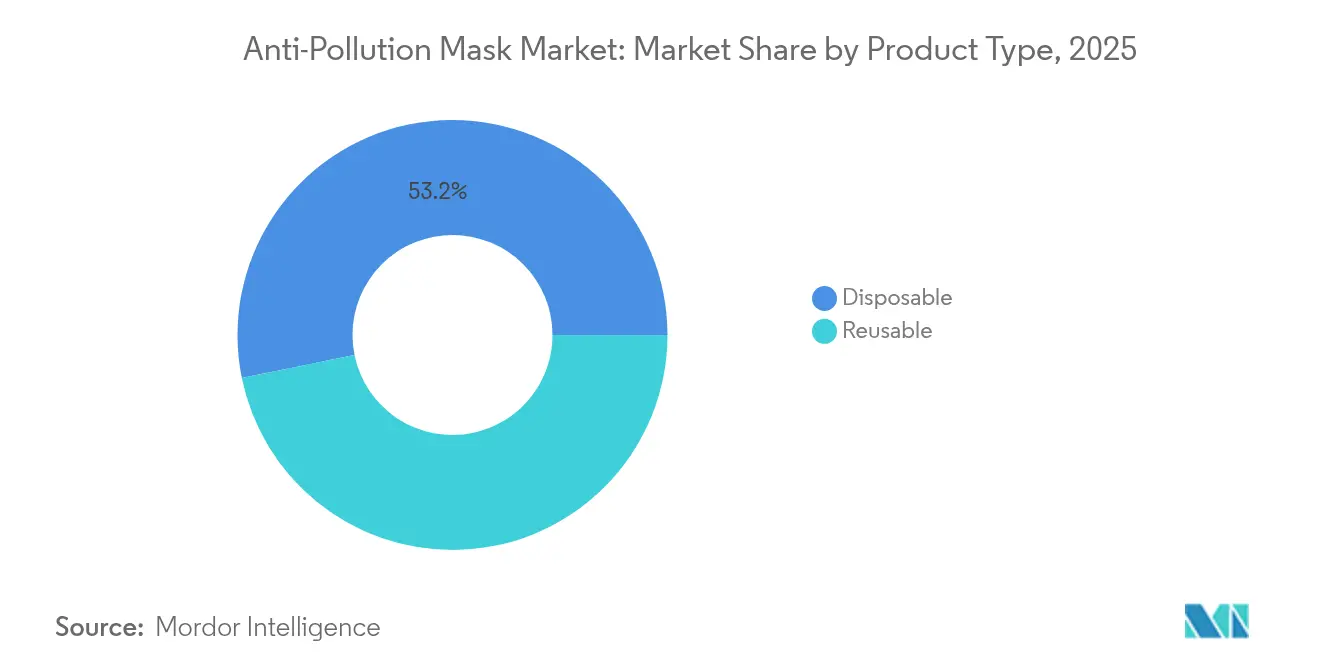
- By product type, disposable masks led with 53.20% of anti-pollution mask market share in 2025, while reusable masks are set to advance at a 14.34% CAGR through 2031.
- By filter type, particulate filters captureda 57.80% share in 2025, whereas gas and odor filters are forecast to grow at 14.42% CAGR between 2026-2031.
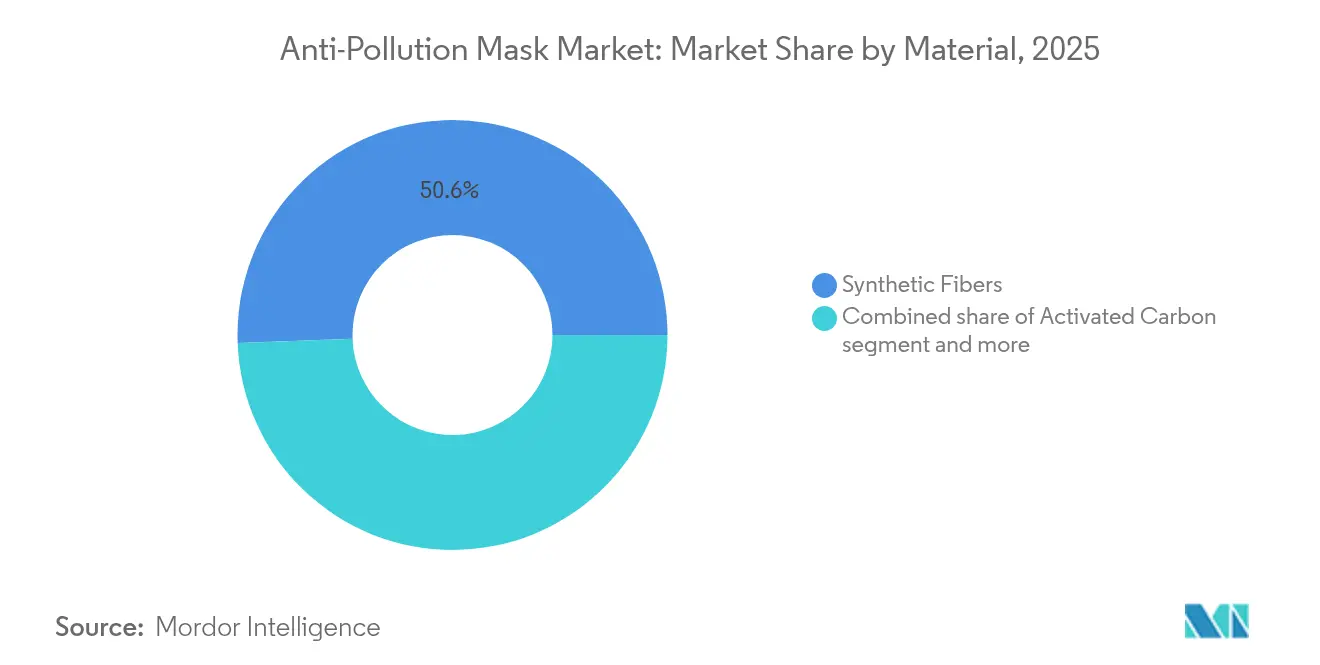
- By material, synthetic fibers held 50.60% revenue share in 2025; activated carbon materials will expand fastest at 14.7% CAGR to 2031.
- By distribution channel, drug stores and pharmacies accounted for 32.10% of 2025 sales; online retail stores recorded the highest 15.1% CAGR for 2026-2031.
- By geography, Asia-Pacific commanded 34.10% of 2025 revenue and is poised to rise at 15.05% CAGR to 2031.
Note: Market size and forecast figures in this report are generated using Mordor Intelligence’s proprietary estimation framework, updated with the latest available data and insights as of 2026.
Market Trends and Insights
Drivers Impact Analysis of Anti-Pollution Mask Market*
| Driver | (~) % Impact on CAGR Forecast | Geographic Relevance | Impact Timeline |
|---|---|---|---|
| Increasing Prevalence of Respiratory Diseases | +2.1% | Global, with concentration in Asia-Pacific urban centers | Medium term (2-4 years) |
| Growing Awareness of Health Risks from Air Pollution | +2.8% | Asia-Pacific core, spill-over to Middle East and Africa and South America | Short term (≤ 2 years) |
| Technological Advancements in Mask Design | +1.9% | North America and Europe innovation hubs, manufacturing in Asia-Pacific | Long term (≥ 4 years) |
| Government and NGO Awareness Programs | +2.4% | India, China, and select Middle East and Africa countries | Medium term (2-4 years) |
| Heightened Awareness Due to the COVID-19 Pandemic | +1.6% | Global, with sustained impact in healthcare sectors | Short term (≤ 2 years) |
| Increased Demand for Reusable and Eco-Friendly Masks | +1.4% | Europe and North America primarily | Long term (≥ 4 years) |
| Source: Mordor Intelligence | |||
Increasing Prevalence of Respiratory Diseases
With worsening air quality leading to a rise in both the prevalence and severity of respiratory diseases, individuals are increasingly turning to protective measures. Respiratory disease burden creates sustained demand for protective equipment as urbanization accelerates exposure risks. The Health Effects Institute's 2024 State of Global Air report documents 8.1 million deaths annually from air pollution, with 99% of the global population living in areas exceeding WHO PM2.5 [1]Source: The State of Global Air, "State of Global Air 2024,"stateofglobalair.org . This epidemiological reality drives preventive healthcare adoption, particularly in Asia-Pacific, where rapid industrialization compounds traditional pollution sources. The correlation between air quality deterioration and respiratory morbidity establishes mask usage as a medical necessity rather than discretionary protection, fundamentally altering market dynamics from episodic to continuous demand patterns.
Growing Awareness of Health Risks from Air Pollution
Public consciousness regarding air pollution health impacts has reached a tipping point, transforming mask adoption from reactive to proactive behavior. Delhi's achievement of 209 'Good to Moderate' air quality days in 2024, the highest on record, paradoxically coincided with increased mask sales as residents became more attuned to daily AQI fluctuations [2]Source: Ministry of Environment, Forest and Climate Change, "2024 - Air Quality Perspective in Delhi,"pib.gov.in . This phenomenon reflects sophisticated consumer behavior where improved air quality increases rather than decreases protective equipment usage, as awareness campaigns educate populations about sub-clinical exposure risks. The shift from crisis-driven to prevention-focused purchasing patterns creates more stable revenue streams for manufacturers while expanding addressable market segments beyond traditional high-pollution episodes. As awareness grows about the hidden and accumulating dangers of pollutants, individuals are turning to personal protective measures to shield themselves from harmful particles.
Technological Advancements in Mask Design
Innovation in filtration technology is reshaping performance expectations and market positioning strategies. Researchers at the University of Tokyo developed porphyrin-based nanosheets that achieve 96% particle filtration efficiency while maintaining superior breathability compared to conventional N95 standards [3]Source: Phys.org, "Porphyrin-based nanosheets capture viruses,"phys.org . Simultaneously, City University of Hong Kong's self-charging electrostatic masks extend effective filtration duration to 60 hours versus 4 hours for traditional designs, addressing the primary consumer complaint of frequent replacement costs. These breakthrough technologies create differentiation opportunities for premium positioning while potentially disrupting established market hierarchies based on traditional filtration metrics. Additionally, manufacturers are now prioritizing sustainability, crafting reusable and washable masks from eco-friendly materials such as organic cotton and biodegradable polymers. These masks also feature durable filters, aiming to minimize environmental waste. This move resonates with the increasing consumer demand for eco-conscious products.
Government and NGO Awareness Programs
Government initiatives are driving market growth through comprehensive education programs and targeted subsidies. The Department of Science and Technology's Clean Air Research Initiative (CARI) has installed WAYU air purification devices at major traffic intersections across urban centers while conducting extensive public awareness campaigns about personal protective equipment. The program combines advanced technological solutions with systematic behavioral change initiatives, including community outreach, educational workshops, and media campaigns to increase mask adoption rates among the general population. The World Health Organization's European guidelines extensively document and recommend face coverings as an essential component of personal protection strategies, significantly influencing insurance policy frameworks, corporate health protocols, and workplace safety standards across industries. These institutional mechanisms have created a robust support system that encourages widespread adoption of protective measures against air pollution.
Restraints Impact Analysis of Anti-Pollution Mask Market*
| Restraint | (~) % Impact on CAGR Forecast | Geographic Relevance | Impact Timeline |
|---|---|---|---|
| Poor Quality Masks and Ineffective Filtration | -1.8% | Global, particularly in price-sensitive markets | Short term (≤ 2 years) |
| Volatile Demand Due to Health Crises and Seasonal Factors | -2.2% | Global, with higher volatility in temperate regions | Medium term (2-4 years) |
| Environmental Concerns Related to Disposable Masks | -1.4% | Europe and North America primarily | Long term (≥ 4 years) |
| Regulatory Hurdles and Certification Requirements | -1.1% | Global, with varying intensity by jurisdiction | Medium term (2-4 years) |
| Source: Mordor Intelligence | |||
Poor Quality Masks and Ineffective Filtration
Quality control failures in pollution control equipment reduce consumer confidence and trigger regulatory oversight that limits market growth. Manufacturers face challenges in maintaining consistent product quality across their supply chains, leading to performance variations that erode market trust. The widespread distribution of low-quality masks during the COVID-19 pandemic generated consumer distrust due to insufficient protection, resulting in heightened examination of filtration performance claims. Many consumers experience respiratory issues despite using certified masks, while others discover counterfeit products in the market. This quality-related challenge increases compliance costs for established manufacturers while creating market entry barriers that potentially restrict innovation from smaller companies. Companies must now invest significantly in quality assurance systems, third-party testing, and certification processes to maintain market presence and regulatory compliance.
Environmental Concerns Related to Disposable Masks
The increasing emphasis on sustainability is fundamentally reshaping product development priorities and consumer purchasing behavior in the mask market. Reusable masks demonstrate significant environmental and economic advantages, reducing waste generation and operational costs by approximately 75%. This substantial reduction in both environmental impact and expenses creates a compelling value proposition for manufacturers and end-users. Cambridge Mask Co. has strategically positioned its reusable products as environmentally responsible alternatives, exemplifying the industry's broader adaptation to sustainability requirements. The company's approach reflects the growing market demand for sustainable solutions and regulatory compliance. However, this transition presents financial challenges as companies adjust their revenue models from high-volume, disposable mask sales to lower-frequency purchases of durable products. This shift affects short-term revenue streams while establishing a foundation for long-term sustainable business practices.
*Our forecasts treat driver/restraint impacts as directional, not additive. The impact forecasts reflect baseline growth, mix effects, and variable interactions.
Anti-Pollution Mask Market Segment Analysis
By Product Type:
Reusable Innovation Challenges Disposable DominanceDisposable masks hold a 53.20% market share in 2025, supported by established supply chains and widespread consumer adoption of single-use protective equipment. The disposable segment operates under clear regulatory frameworks, particularly NIOSH 42 CFR 84, which provides manufacturers with defined compliance standards from the National Institute for Occupational Safety and Health. These masks offer convenience through easy disposal after use, eliminating the need for cleaning and maintenance. Healthcare facilities, industrial workplaces, and public institutions prefer disposable masks for their consistent performance, reduced risk of cross-contamination, and simplified inventory management. The segment's growth is further driven by continuous improvements in material technology, enhanced filtration capabilities, and cost-effective manufacturing processes that maintain product quality while ensuring competitive pricing.
The reusable segment is growing at a CAGR of 14.34% through 2031, driven by sustainability regulations and lower total cost of ownership. This growth reflects changing consumer preferences toward sustainable products, as more consumers prioritize environmental responsibility in their purchasing decisions. The shift is particularly evident in developed markets where environmental awareness is high and regulatory support for sustainable alternatives is strong. Manufacturers of reusable products are using educational campaigns about environmental benefits to support premium pricing strategies. These campaigns emphasize reduced waste generation, lower carbon footprint, and long-term cost savings. The educational initiatives also highlight the durability and quality of reusable products, demonstrating their value proposition despite higher initial costs.


By Filter Type:
Gas and Odor Filtration Gains MomentumParticulate filters hold a 57.80% market share in 2025, as they effectively remove PM2.5 and PM10 particles in urban environments. These filters are designed to capture and remove microscopic particles from the air, including dust, pollen, smoke, and other airborne contaminants. Their high market share reflects their crucial role in addressing air quality concerns, particularly in densely populated urban areas where pollution levels are typically higher. The filters' effectiveness in trapping particles as small as 2.5 micrometers has made them essential components in various air filtration systems, from residential air purifiers to industrial air handling units.
The gas and odor filtration segments are growing at a CAGR of 14.42%, driven by increased awareness of volatile organic compounds and chemical pollutants beyond particulate matter. The integration of activated carbon technology demonstrates the segment's technical progress, particularly in enhancing absorption capacity and pollutant selectivity. These advancements allow manufacturers to target multiple pollutants simultaneously, including benzene, formaldehyde, and other harmful gases. The development of hybrid filtration systems combines activated carbon with other materials to improve overall efficiency and longevity. Manufacturers are now developing products offering comprehensive protection through multi-layer filtration mechanisms, specialized coating technologies, and enhanced surface area treatments. This evolution in filtration technology enables better removal of both visible and invisible contaminants while maintaining consistent performance throughout the filter's lifecycle.
By Material:
Activated Carbon Innovation Drives Premium PositioningSynthetic fibers hold a 50.60% market share in 2025, due to established manufacturing processes and cost advantages in high-volume production. These fibers, including polyester, nylon, and acrylic, benefit from streamlined production methods that have been refined over decades. The manufacturing efficiency allows producers to maintain lower production costs while meeting large-scale demand. Additionally, synthetic fibers offer consistent quality and performance characteristics, making them particularly attractive for industrial applications and mass-market consumer products. The cost-effectiveness of synthetic fiber production, combined with their durability and versatility, continues to drive their dominant position in the global fiber market.
The activated carbon materials market is growing at a CAGR of 14.7%, driven by effective gas and odor filtration capabilities that address increasing urban air pollution. Research advancements in material science are transforming the activated carbon segment. Recent studies on composite nanofiber membranes using solution blow spinning techniques show CO2 capture capacities of 44.7 mg/g with CO2/N2 selectivity ratios of 28:1. These technological improvements allow activated carbon manufacturers to maintain premium pricing while expanding into specialized industrial and medical applications beyond conventional air filtration.
By Distribution Channel:
Digital Transformation Reshapes Retail DynamicsDrug stores and pharmacies hold a 32.10% market share in 2025, due to their established healthcare product distribution networks and consumer trust in medical retail channels. These retail establishments benefit from their strategic locations, professional staff, and ability to offer personalized healthcare advice. Their dominance in the market is further strengthened by long-standing relationships with pharmaceutical manufacturers, insurance providers, and healthcare institutions. Additionally, drug stores and pharmacies have successfully integrated digital services with their physical presence, offering conveniences such as online prescription refills, medication reminders, and home delivery services, which enhance their market position.
The online retail market is growing at a CAGR of 15.1%, driven by consumer convenience, 24/7 shopping accessibility, and extensive product information that enables informed purchasing decisions. The expansion of e-commerce presents opportunities through wider market reach and reduced operational costs, while creating challenges for traditional retail channels in terms of competition and changing consumer preferences. Online platforms allow manufacturers to offer comprehensive product information, detailed specifications, customer reviews, ratings, and side-by-side comparison tools. These digital capabilities enhance the consumer shopping experience and support premium product positioning through educational content, virtual demonstrations, and interactive features.
Geography Analysis
APAC Anti-Pollution Mask Market
Asia-Pacific accounts for 34.10% of the market share in 2025 and is projected to grow at a CAGR of 15.05% through 2031. This growth stems from high pollution levels, large populations, and stricter regulations in the region. The area's established manufacturing base and access to raw materials create cost advantages that support both domestic use and exports. Manufacturing capabilities are particularly strong in countries like China, Vietnam, and Malaysia, which have developed extensive production networks and supply chains.
East Asia Anti-Pollution Mask Market
In China, air quality improvements have increased consumer awareness, leading to higher mask adoption. The country's urban areas continue to implement stringent air quality measures, while consumers maintain mask-wearing habits developed during periods of severe pollution. Japan and South Korea contribute to market expansion through technological advancements in premium products, which influence global standards. These countries focus on developing masks with enhanced filtration capabilities, smart features, and improved comfort. Their innovations include masks with replaceable filters, adjustable fits, and antimicrobial properties. The technological developments from these markets often set benchmarks for manufacturers worldwide, particularly in the premium segment.
North America and EMEA Anti-Pollution Mask Market
North America and Europe are mature markets with significant growth rates, primarily due to regulatory compliance requirements and sustainability mandates. These regions have established infrastructure and stringent environmental regulations that drive the adoption of protective equipment. The implementation of advanced monitoring systems and regular updates to safety standards further support market growth. The Middle East and Africa demonstrate growth potential due to increasing urbanization and industrial development, which raises pollution exposure risks. These regions are experiencing rapid industrial expansion, infrastructure development, and population growth in urban centers, leading to heightened concerns about air quality and environmental protection. The establishment of new manufacturing facilities and energy production plants has intensified the focus on worker safety and environmental compliance.
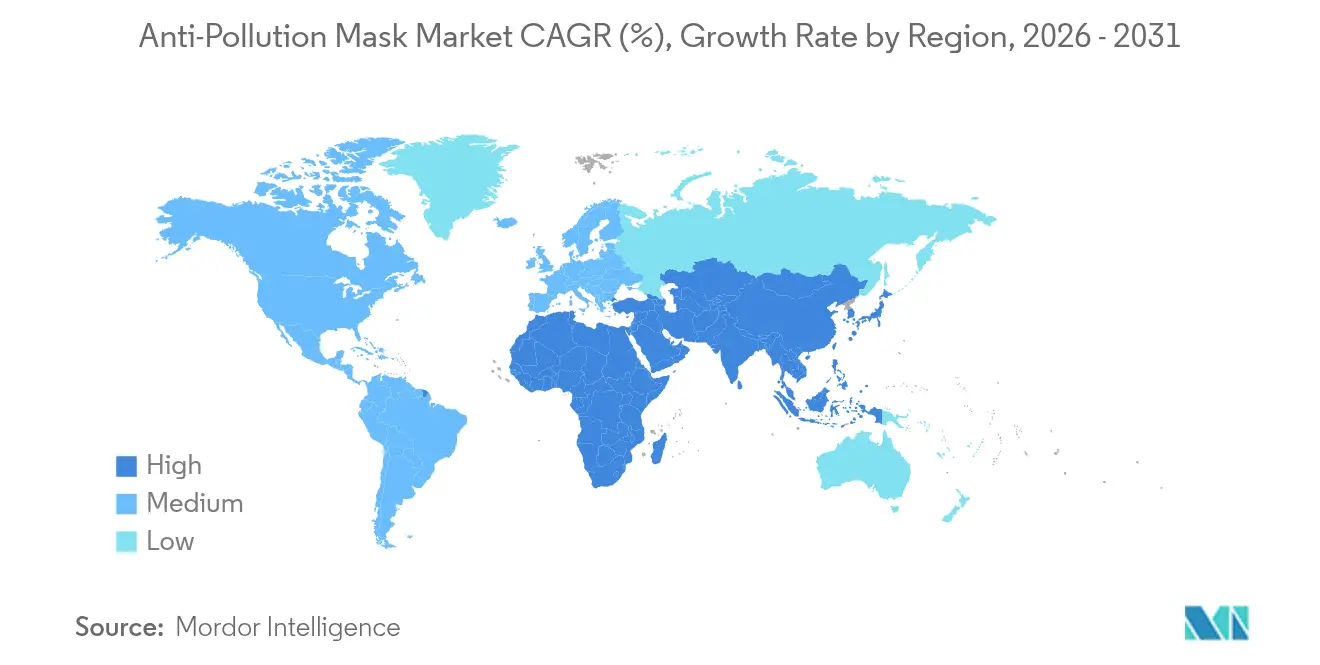
Note: Regional shares of all individual regions will be available upon report purchase

Regulatory Landscape
Regulation of anti-pollution masks spans occupational respiratory protection rules and consumer-facing PPE conformity regimes, which results in a multi-standard compliance environment for global brands. In the United States, NIOSH approvals under 42 CFR Part 84 anchor performance claims for respirators, while OSHA enforces the Respiratory Protection Standard (29 CFR 1910.134), driving employer requirements such as fit testing and training for workplace use. FDA also distinguishes among N95 respirators, surgical masks, face masks, and barrier face coverings in its device-related guidance framework.
In the European Union, Regulation (EU) 2016/425 governs PPE market access and CE marking, commonly demonstrated through conformity to harmonized standards such as EN 149 for filtering half masks. Internationally, ISO 17420-2:2021 sets testing and performance requirements for filtering respiratory protective devices and is used as a technical reference point across jurisdictions. Regulatory activity continues to evolve, including OSHA actions publicized in June 2026 regarding progress on amending medical evaluation requirements for certain respirators under 29 CFR 1910, reinforcing the need for manufacturers and institutional buyers to track updates that can affect qualification, labeling, and deployment practices.
Competitive Landscape
The market is fragmented, offering both established players and emerging disruptors avenues to carve out market share through unique positioning strategies. This fragmented landscape mirrors the varied application needs across different geographic markets, regulatory frameworks, and consumer demographics, hindering dominant players from asserting universal control. Factors such as differing pollution intensities, cultural perceptions of mask usage, and localized government regulations contribute to a patchwork of market niches, eschewing a singular global market. For instance, Asia's urban hubs, grappling with acute pollution, lean towards high-performance masks boasting advanced filtration. In contrast, consumers in Europe and North America often weigh comfort, reusability, and aesthetics equally with protective features. Such geographic and demographic nuances thwart monopolistic tendencies, cultivating a competitive arena where both legacy corporations and agile startups flourish by customizing offerings to meet regional or individual consumer demands.
Major leaders in the anti-pollution mask market include 3M, Honeywell International Inc., Respro Ltd., Cambridge Mask Co., and Vogmask (Ohlone Press LLC). Technology differentiation emerges as the primary competitive vector, with companies investing in advanced filtration materials, smart monitoring capabilities, and sustainable manufacturing processes to justify premium positioning. Manufacturers are now prioritizing sustainability, crafting reusable and washable masks from eco-friendly materials such as organic cotton and biodegradable polymers. These masks also feature durable filters, aiming to minimize environmental waste. This move resonates with the increasing consumer demand for eco-conscious products.
New entrants and smaller players are carving out niche markets, offering specialized masks tailored for activities such as cycling, running, and industrial use. These players often highlight features like comfort, breathability, and a fashionable appeal. This strategic diversification not only broadens the market reach beyond just high-pollution episodes but also fuels a wave of competitive innovation.
Anti-Pollution Mask Industry Leaders
-
3M
-
Honeywell International Inc.
-
Respro Ltd.
-
Cambridge Mask Co.
-
Vogmask (Ohlone Press LLC)
- *Disclaimer: Major Players sorted in no particular order
Anti-Pollution Mask Market Companies Covered in this Report
- 3M
- Honeywell International Inc.
- Respro Ltd.
- Cambridge Mask Co.
- Vogmask (Ohlone Press LLC)
- RESPILON Ltd.
- AMD Medicom Inc.
- Makrite
- idMASK Co., Ltd.
- Dragerwerk AG & Co. KGaA
- Airinum AB
- Guangzhou Harley Commodity Co., Ltd.
- VENUS Safety & Health Pvt. Ltd.
- RZ Industries
- Moldex-Metric Inc.
- Aero Pro Co., Ltd
- Ansell Ltd.
- Shanghai Dasheng Health Products
- UVEX Safety Group
- Alpha Pro Tech Ltd.

Market Opportunities and Future Outlook
Honeywell’s completed divestment of its Personal Protective Equipment business (May 2025) to Protective Industrial Products is changing competitive dynamics across parts of the respiratory and safety distribution ecosystem. In parallel, 3M’s March 2026 agreement to acquire Madison Fire & Rescue and combine it with Scott Safety under a new structure signals more concentrated attention on fire, industrial, and emergency-response categories, which can influence respiratory protection benchmarks and channel emphasis for adjacent anti-pollution mask lines.
Materials innovation and compliance-led product differentiation are also key opportunity areas, especially where buyers want improved comfort without trading off filtration. Activity around advanced filtration media, including graphene-enabled filtration media orders reported by Zentek in July 2026 for commercial air filtration applications, and published work on functionalized electrospun nanofiber membranes with antimicrobial and biodegradable attributes indicate an active technology pipeline that can translate into premium reusable mask designs. On the policy side, OSHA’s ongoing updates to 29 CFR 1910.134, including June 2026 rulemaking activity, keep institutional procurement focused on verified performance, fit, and program compliance, supporting demand for clearly certified products and creating room for manufacturers that strengthen testing, traceability, and anti-counterfeit quality controls.
Recent Industry Developments in Anti-Pollution Mask Market
- June 2026: OSHA advanced work to amend elements of the Respiratory Protection Standard (29 CFR 1910.134), including actions tied to changes in medical evaluation requirements for certain respirators. The update keeps employer programs focused on documented compliance steps such as qualification and safe use, influencing institutional procurement criteria for filtering facepiece and powered air-purifying respirator categories.
- May 2025: Honeywell completed the sale of its Personal Protective Equipment business to Protective Industrial Products in an all-cash transaction. The ownership change reshapes supplier relationships across safety distribution and can alter competitive positioning for respiratory protection offerings that overlap with anti-pollution mask demand.
- August 2024: Cambridge Mask Co. launched educational campaigns emphasizing the environmental impact of disposable masks and promoting reusable alternatives. The messaging supported sustainability-led differentiation and helped reinforce premium positioning for reusable anti-pollution masks in markets where waste reduction is a purchase driver.


Anti-Pollution Mask Market Report Scope and Research Methodology
Market Definition and Coverage
This market covers anti-pollution masks bought for everyday exposure to outdoor and indoor air pollutants, where filtration is the core value delivered. Our sizing reflects revenue from selling these masks across consumer and institutional buying, across major regions.
Scope exclusions: Medical or surgical masks purchased mainly for infection control, full-face respirators, and industrial PPE kits sold as bundled systems are not counted unless the purchase is specifically for anti-pollution mask use.
Segments Covered in This Report
-
By Product Type
- Reusable
- Disposable
-
By Filter Type
- Particulate
- Gas and Odour
- Combination
-
By Material
- Synthetic Fibers
- Cotton
- Activated Carbon
- Non-woven Fabric
-
By Distribution Channel
- Supermarkets/Hypermarkets
- Drug Stores/Pharmacies
- Online Retail Stores
- Other Distribution Channels
-
By Geography
-
North America
- United States
- Canada
- Mexico
- Rest of North America
-
Europe
- Germany
- United Kingdom
- Italy
- France
- Spain
- Netherlands
- Poland
- Belgium
- Sweden
- Rest of Europe
-
Asia-Pacific
- China
- India
- Japan
- Australia
- Indonesia
- South Korea
- Thailand
- Singapore
- Rest of Asia-Pacific
-
South America
- Brazil
- Argentina
- Colombia
- Chile
- Peru
- Rest of South America
-
Middle East and Africa
- South Africa
- Saudi Arabia
- United Arab Emirates
- Nigeria
- Egypt
- Morocco
- Turkey
- Rest of Middle East and Africa
-
North America
Data Sources, Market Sizing, and Validation
Desk Research
Desk research was used to set the market boundaries and to anchor the demand environment using public indicators that can be checked year after year. We referred to sources such as WHO air quality guidance and PM2.5 exposure references, World Bank urbanization and population series, OECD environment statistics, and government environment and health departments that publish air quality and respiratory health summaries.
We also used secondary material such as company annual reports, investor presentations, product specification sheets, and customs and trade portals where available, plus reputed press coverage of smog events and consumer behavior shifts. For cross-checking company presence and financial context, we selectively used paid subscriptions focused on company financials and news intelligence, alongside patent databases for filtration and mask design signals. These examples are not exhaustive, and we reviewed other public sources for data collection, validation, and research clarification.
Primary Interviews and Surveys
Primary interviews and surveys focused on validating what drives actual mask purchases, price bands, and replacement behavior for reusable and disposable formats. We spoke with a mix of manufacturers, distributors, retail channel contacts, and informed users across APAC, EMEA, and the Americas, so the model could reflect regional adoption patterns, filter preferences, and regulatory cues.
Distribution of primary research fieldwork respondents
| Company type | Respondent position | Region |
|---|---|---|
| Top tier: 32% | CXOs: 12% | APAC: 46% |
| Mid tier: 54% | Functional/Unit leaders: 30% | EMEA: 29% |
| Smaller Players: 14% | Managers: 58% | Americas: 25% |
Market-Sizing & Forecasting
The sizing starts with a top-down demand pool build that links urban population exposure and pollution intensity to likely mask usage, then converts it into annual revenues through usage frequency and pricing. To keep totals realistic, we corroborated the outputs with selective bottom-up approximations, including sampled channel price checks, a limited roll-up of visible supplier revenues, and volume-to-value conversions using typical unit prices.
Key inputs used in the model include urban population share, persistence of high PM2.5 days in large cities, the split between reusable and disposable mask purchases, filter type preference (particulate, gas and odor, or combination), and average selling price progression by channel (online versus offline). When a variable was not consistently available in every country, we handled the gap using proxy markets with similar urbanization and air-quality profiles, then reviewed it with interview feedback before applying it.
For forecasting, we used scenario analysis so adoption and replacement rates could be flexed based on pollution severity cycles, policy enforcement, and consumer affordability, then smoothed into a single base case. The final trajectory was reviewed against expert expectations for how quickly reusable formats and higher-filtration masks are likely to penetrate over the forecast period.
Data Validation & Update Cycle
Outputs are checked through multiple steps so the numbers do not move only because one assumption changed. We compare implied per-capita mask consumption, price bands, and reusable replacement cycles against independent signals from public air-quality trends, trade flow directionality where relevant, and channel availability checks, and then investigate outliers.
Before sign-off, the model and assumptions are reviewed by another analyst, and a re-contact is triggered when a major variance is found versus expected adoption, pricing, or channel mix. Reports are refreshed annually, and interim updates are made when material events occur, such as sharp pollution episodes, regulatory changes, or major shifts in consumer purchasing behavior. Right before delivery, a fresh validation pass is done so clients receive the latest updated view.
Mordor Intelligence's Anti Pollution Mask Market Sizing Compared With Other Published Estimates
Published market sizes for anti-pollution masks can look far apart, even when they are describing a similar product. The differences usually come from how the scope is set, the year used as the anchor, and how pricing and replacement frequency are assumed over time.
In this market, the biggest gap drivers are whether broad PPE and healthcare mask demand gets mixed into the count, how reusable masks are converted into annual revenue (purchase versus filter replacement), and whether pricing stays realistic for mass online channels or is pushed up using premium product averages. Currency conversion timing and how often the model is refreshed can also shift the stated value, especially when inflation and logistics costs move quickly.
Benchmark comparison
| Source | Market Size | Gaps in Research Methodology |
|---|---|---|
| Mordor Intelligence | USD 15.61 M (2026) | |
| Global Consultancy A | USD 9.71 B (2024) | Often presented as a broad anti-pollution mask revenue pool that can implicitly capture wider PPE behavior and pandemic-led mask carryover, and it may apply higher average prices across geographies without clearly separating everyday anti-pollution use from adjacent mask categories. |
| Industry Publisher B | USD 4.41 B (2025) | Uses a different time frame and base year, and the revenue build can be sensitive to how reusable products are annualized and how channel mix is treated, especially when online pricing and replacement rates are not validated market by market. |
Air-quality exposure signals and channel price checks are the anchors that keep Mordor Intelligence aligned to a narrower, everyday anti-pollution demand pool. This helps explain why the value is not directly comparable to estimates that blend in broader mask use or apply different annualization logic. Taken together, the table shows that scope boundaries, pricing treatment, and replacement assumptions are the practical reasons published values spread, so users should match the estimate to the decision they are trying to support.


Key Questions Answered in the Report
What is the current Anti-Pollution Mask market value?
The Anti-Pollution Mask market stands at USD 15.61 million in 2026 and is forecast to reach USD 30.15 million by 2031.
Which region leads the Anti-Pollution Mask market?
Asia-Pacific leads, holding 34.10% of 2025 revenue and posting the fastest 15.05% CAGR through 2031.
Are reusable masks gaining ground over disposables?
Yes. Although disposables retain 53.20% share, reusable models will grow at 14.34% CAGR due to sustainability and cost-of-ownership advantages.
What technological trends are reshaping product design?
Orphyrin-based nanosheet filters, self-charging electrostatic layers and smart sensor integration are redefining filtration efficiency and user comfort.
Page last updated on:


 Your data is secure and never sold or shared.


