
Market Overview
| Study Period | 2020 - 2031 |
|---|---|
| Market Size (2026) | USD 4.05 Billion |
| Market Size (2031) | USD 9.27 Billion |
| Growth Rate (2026 - 2031) | 18.01 % |
| Fastest Growing Market | Asia Pacific |
| Largest Market | North America |
| Market Concentration | Medium |
Major Players *Disclaimer: Major Players sorted in no particular order Image © Mordor Intelligence. Reuse requires attribution under CC BY 4.0. | |
Anti-Money Laundering Solutions Market Analysis by Mordor Intelligence
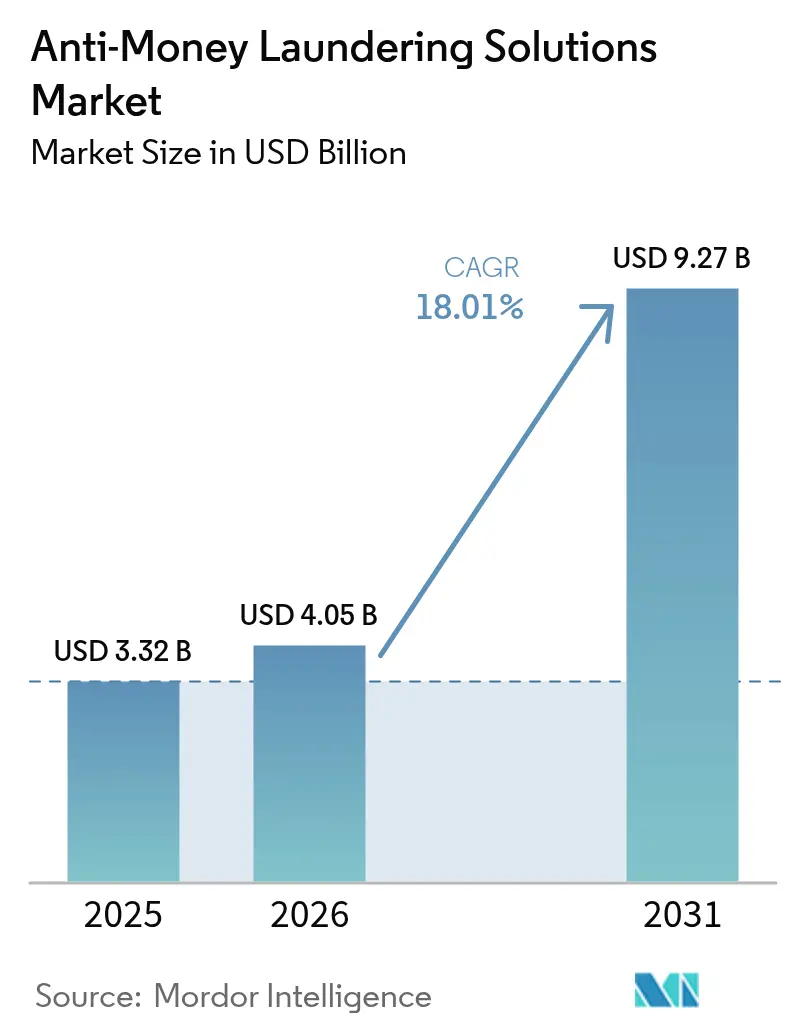
The anti-money laundering solutions market size is expected to grow from USD 3.32 billion in 2025 to USD 4.05 billion in 2026 and is forecast to reach USD 9.27 billion by 2031 at an 18.01% CAGR over 2026-2031. Continued regulatory tightening, rapid adoption of instant-payment rails, and mounting enforcement penalties are pushing compliance teams to replace legacy, batch-based controls with always-on analytics. Cloud-native platforms that pool anonymized data are gaining favour because real-time surveillance needs elastic compute that on-premises installations struggle to provide. Venture capital is flowing to start-ups that embed agentic artificial intelligence in investigative workflows, promising to compress alert handling times without adding headcount. At the same time, financial-crime units are shifting scarce specialists toward proactive typology design while outsourcing high-volume alert triage to managed-service providers. Together, these forces create a demand cycle that keeps the anti-money laundering solutions market on a steep growth trajectory.
Key Report Takeaways
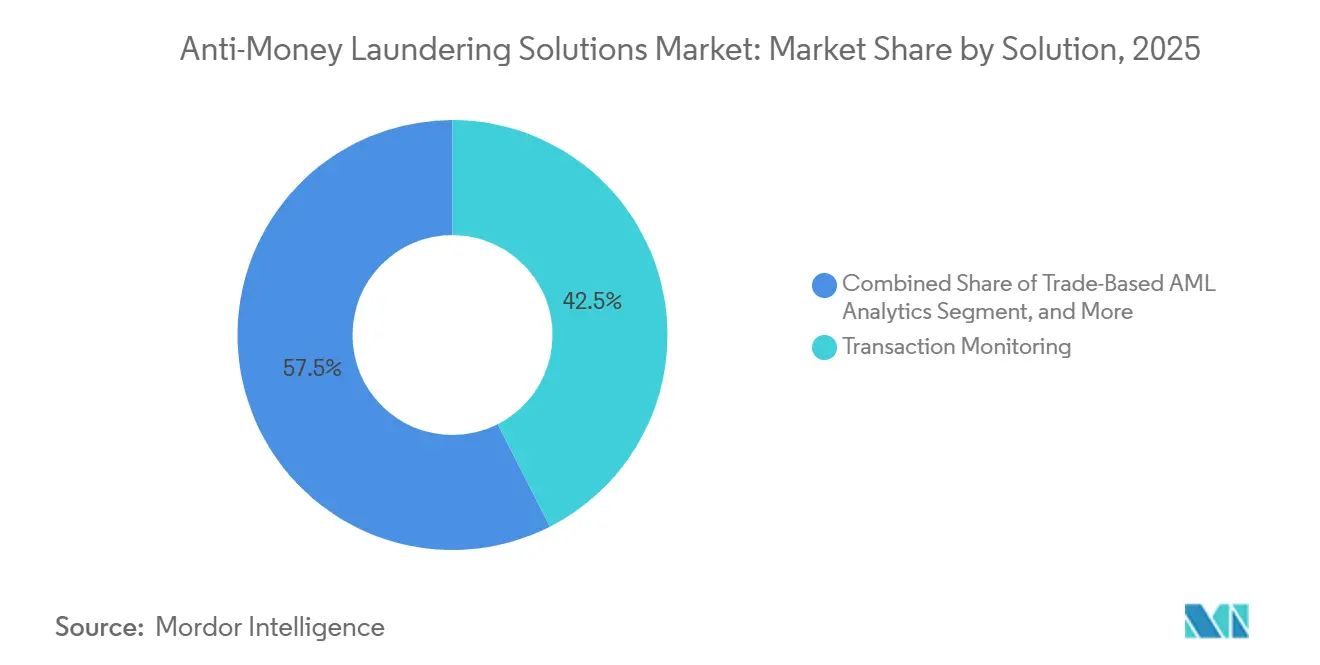
- By solution, transaction monitoring systems led with 42.51% revenue share in 2025, while trade-based analytics is projected to expand at an 18.91% CAGR through 2031.
- By component, software accounted for 63.59% of the anti-money laundering solutions market share in 2025, yet services are forecast to grow at 18.84% through 2031.
- By deployment model, on-premises deployments commanded 58.94% of the anti-money laundering solutions market size in 2025, whereas cloud solutions are advancing at an 18.53% CAGR to 2031.
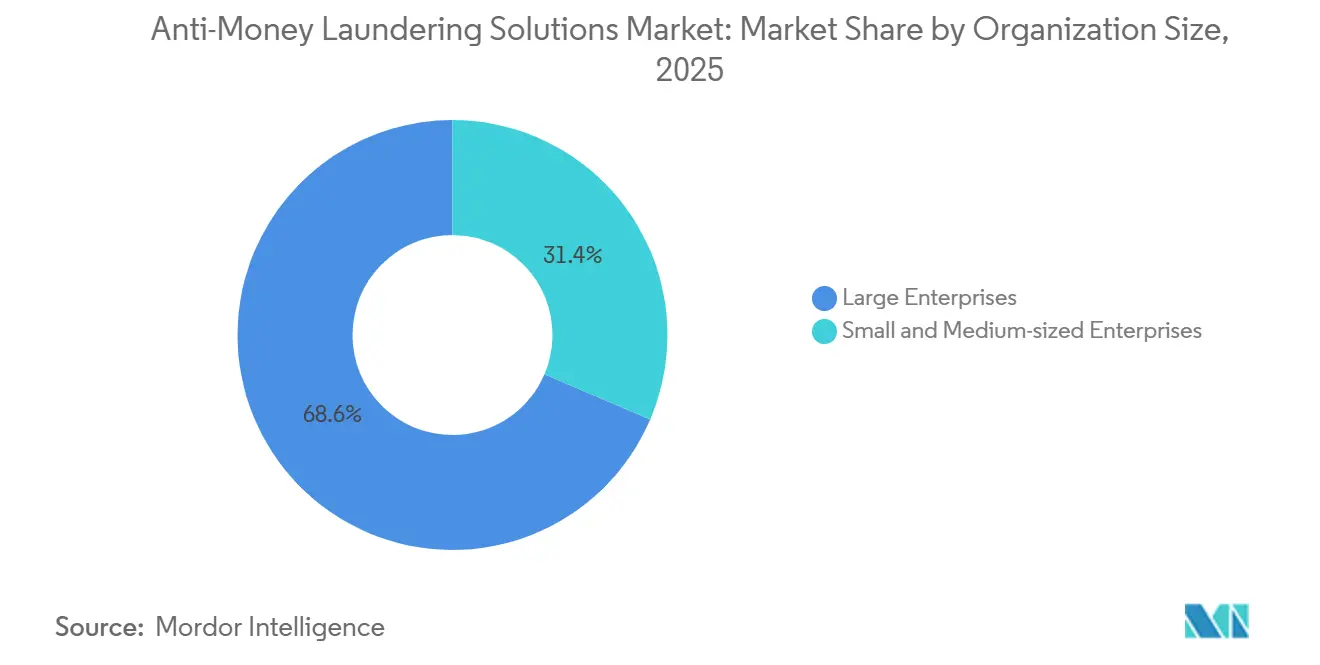
- By organization size, large enterprises held 68.58% of spending in 2025 and small and medium-sized enterprises are set to grow at a 19.05% CAGR through 2031.
- By end-user, banking represented 54.54% of 2025 revenue, and cryptocurrency exchanges are forecast to record the highest CAGR at 19.11% to 2031.
Note: Market size and forecast figures in this report are generated using Mordor Intelligence’s proprietary estimation framework, updated with the latest available data and insights as of 2026.
Market Trends and Insights
Drivers Impact Analysis of Anti-Money Laundering Solutions Market*
| Driver | (~) % Impact on CAGR Forecast | Geographic Relevance | Impact Timeline |
|---|---|---|---|
| Real-Time Compliance Mandates under EU AMLR 2023 | +3.20% | Europe, spillover to UK and Middle East | Medium term (2-4 years) |
| Expansion of Instant Payment Schemes Lifting Monitoring Volumes | +2.80% | Global, led by North America, Europe, Asia-Pacific | Short term (≤ 2 years) |
| Cryptocurrency Exchange Licensing in Asia-Pacific Fuelling Blockchain-Analytics Spend | +2.50% | Asia-Pacific core, spillover to Middle East | Medium term (2-4 years) |
| FinCEN Rule Extending to SEC-Registered Investment Advisers | +1.90% | North America, primarily United States | Short term (≤ 2 years) |
| FATF Grey-Listing Pressure Accelerating Upgrades in High-Risk Economies | +1.60% | Africa, South America, Southeast Asia | Long term (≥ 4 years) |
| Convergence of Digital Identity and eKYC Platforms with AML Stacks | +1.40% | Global, early adoption in Europe and Asia-Pacific | Medium term (2-4 years) |
| Source: Mordor Intelligence | |||
Real-Time Compliance Mandates Under EU AMLR 2023
The European Union’s Anti-Money Laundering Regulation, published in 2024, obliges firms to screen transactions before funds leave the institution, replacing overnight batch reviews.[1] Lowered customer-due-diligence thresholds intensify data-collection demands, and a board-level compliance manager role ensures executive accountability. Because more than 80% of surveyed European banks remain in early preparation, vendors have a multi-year runway to supply real-time analytics, centralized beneficial-ownership checks, and harmonized suspicious-activity-report templates.[2] The regulation’s extraterritorial reach forces United Kingdom and Middle East institutions operating in the bloc to adopt identical standards, turning the anti-money laundering solutions market into a compliance technology arms race.
Expansion of Instant Payment Schemes Lifting Monitoring Volumes
FedNow, SEPA Instant, and India’s Unified Payments Interface settle transactions in seconds, compressing alert-decision windows and multiplying monitoring volumes. Banks report alert spikes of up to 40% after onboarding instant rails, exposing rule-based systems that lack latency-optimized scoring. The European Central Bank processed 14.6 billion instant transactions in 2024, forcing adoption of in-memory analytics.[3] Vendors such as NICE Actimize now offer cross-institution intelligence feeds that surface counterparty risk in milliseconds, a capability that accelerates cloud migration and pushes the anti-money laundering solutions market ahead of broader regtech spending.
Cryptocurrency Exchange Licensing in Asia-Pacific Fuelling Blockchain-Analytics Spend
Singapore, Hong Kong, and Japan now license virtual-asset service providers under bank-equivalent standards. Singaporean rules effective December 2024 require suspicious-transaction reports within five working days and enhanced due diligence above SGD 20,000 (USD 15,000). Hong Kong demands blockchain analytics that can trace funds through mixers and privacy coins. Venture funding follows: Sardine raised USD 70 million in 2025 to expand AI agents for automated sanctions monitoring. These mandates push exchanges to deploy enterprise platforms, expanding the addressable anti-money laundering solutions market beyond traditional finance.
FinCEN Rule Extending to SEC-Registered Investment Advisers
Effective January 2026, roughly 15,000 U.S. investment advisers managing USD 110 trillion must adopt risk-based programs, file suspicious-activity reports, and appoint compliance officers. Smaller advisers face per-client compliance costs above USD 1,200, driving outsourcing and boosting services demand. Parallel European rules widen coverage to mortgage intermediaries and crowdfunding platforms, aligning transatlantic obligations. As wealth managers rush to integrate surveillance with portfolio systems, the anti-money laundering solutions market gains a fresh cohort of mid-sized buyers.
Restraints Impact Analysis of Anti-Money Laundering Solutions Market*
| Restraint | (~) % Impact on CAGR Forecast | Geographic Relevance | Impact Timeline |
|---|---|---|---|
| High False-Positive Investigation Costs for Tier-2 Banks | -1.80% | Global, acute in North America and Europe | Short term (≤ 2 years) |
| Data-Residency Laws in ASEAN Limiting Cloud AML Adoption | -1.30% | Southeast Asia, spillover to South Asia | Medium term (2-4 years) |
| Lack of Explainable-AI Models Hindering Regulator Approval | -0.90% | Global, regulatory scrutiny in Europe and United States | Medium term (2-4 years) |
| Shrinking Correspondent Banking Lines in Africa Curtailing Addressable Market | -0.70% | Africa, limited spillover to Middle East | Long term (≥ 4 years) |
| Source: Mordor Intelligence | |||
High False-Positive Investigation Costs for Tier-2 Banks
Alert conversion rates below 5% mean community banks burn budget on investigations that rarely yield suspicious-activity reports. The Office of the Comptroller of the Currency now allows examiners to carry forward satisfactory findings to ease pressure, yet institutions still face USD 500-plus costs per false alert. Managed-service providers offering per-alert pricing appeal to these banks, but regulatory expectations for oversight keep adoption cautious, slowing the anti-money laundering solutions market among smaller depository institutions.
Data-Residency Laws in ASEAN Limiting Cloud AML Adoption
Indonesia, Vietnam, and Thailand demand that customer data remain onshore, complicating single-tenant cloud migrations. Vendors respond with sovereign-cloud regions and in-country key management. Hybrid architectures lift implementation costs and extend project timelines, tempering cloud growth in Southeast Asia even as the anti-money laundering solutions market expands elsewhere.
*Our forecasts treat driver/restraint impacts as directional, not additive. The impact forecasts reflect baseline growth, mix effects, and variable interactions.
Anti-Money Laundering Solutions Market Segment Analysis
By Solution:
Trade Finance Analytics Gains MomentumTrade-based analytics is forecast to be the fastest-growing slice of the anti-money laundering solutions market, expanding at an 18.91% CAGR through 2031. Traditional monitoring engines held 42.51% of 2025 revenue, yet they lack visibility into invoices, manifests, and commodity pricing. Multinational banks now feed customs data into blockchain-enabled analytics to flag over- and under-invoicing.
The anti-money laundering solutions market size tied to transaction monitoring still dominates, but niche vendors that bridge physical-goods data with payment flows are capturing new budgets. Continuous know-your-customer screening blurs with monitoring as vendors trigger re-verification when adverse media or sanctions hits appear. Case-management systems add agentic AI that drafts narratives, shrinking investigation times. Market entrants that package trade-risk models into modular APIs stand to influence the anti-money laundering solutions market share as mid-tier banks join global supply chains.

By Component:
Services Outpace SoftwareSoftware represented 63.59% of revenue in 2025, reflecting decades of rules-based engines deployed on-premises. Services, however, are projected to grow 18.84% per year, making them the fastest-expanding component of the anti-money laundering solutions industry. Enforcement actions signal regulators tolerate outsourcing if governance is tight, pushing institutions to contract 24/7 alert triage, sanctions screening, and suspicious-activity report drafting.
The anti-money laundering solutions market size related to professional services rises as vendors bundle model tuning and explainability documentation. Managed-service providers differentiate through typology depth: some target crypto-mixing, others trade finance or gaming patterns. This specialization shifts fixed cost into pay-per-transaction models, allowing small firms to access enterprise-grade protection.
By Deployment Model:
Cloud Adoption AcceleratesOn-premises installations still held 58.94% market share in 2025, but cloud deployments are advancing at an 18.53% CAGR. Elastic scaling is indispensable for real-time screening of instant payments and for model retraining that produces explainable AI artifacts demanded by supervisors. Hybrid models proliferate where data-localization rules apply, with primary screening engines running on-premises while sanctions tables, name-matching algorithms, and negative-media scans execute in vendor clouds.
Oracle’s sovereign-cloud regions let banks keep encryption keys domestically, easing Southeast Asian concerns over data flow. Over time, cloud newcomers could narrow the anti-money laundering solutions market share gap, especially as cross-institution intelligence networks require pooled data that single-tenant servers cannot provide.
By Organization Size:
SMEs Enter the FoldLarge enterprises generated 68.58% of spending in 2025, but growth momentum lies with small and medium-sized enterprises. New rules rope securities advisers, crowdfunding portals, and professional football clubs into anti-money laundering surveillance. Per-user SaaS pricing lets a 30-person wealth manager deploy baseline monitoring for thousands monthly, rather than hiring full-time analysts.
Vendors pre-configure rule sets that map to niche risk typologies, lowering entry hurdles. As SME adoption widens, the anti-money laundering solutions market size gains breadth, diversifying away from its traditional dependence on global banks.
By End-User Industry:
Crypto Exchanges SurgeBanking supplied 54.54% of 2025 revenue, anchored by mature regulatory frameworks and high transaction volumes. Yet cryptocurrency exchanges and virtual-asset service providers are the fastest-growing customer set, projected at a 19.11% CAGR. Asia-Pacific licensing standards now mirror bank obligations, compelling exchanges to integrate blockchain analytics with traditional KYC onboarding.
Payment service providers also accelerate spending as instant-payment volumes balloon. Gaming operators adopt pattern detection to flag rapid bet-and-cash-out behaviour. Government agencies deploy investigative platforms to spot procurement fraud. Together, these non-bank sectors expand the total addressable anti-money laundering solutions market.
Geography Analysis
North America Anti-Money Laundering Solutions Market
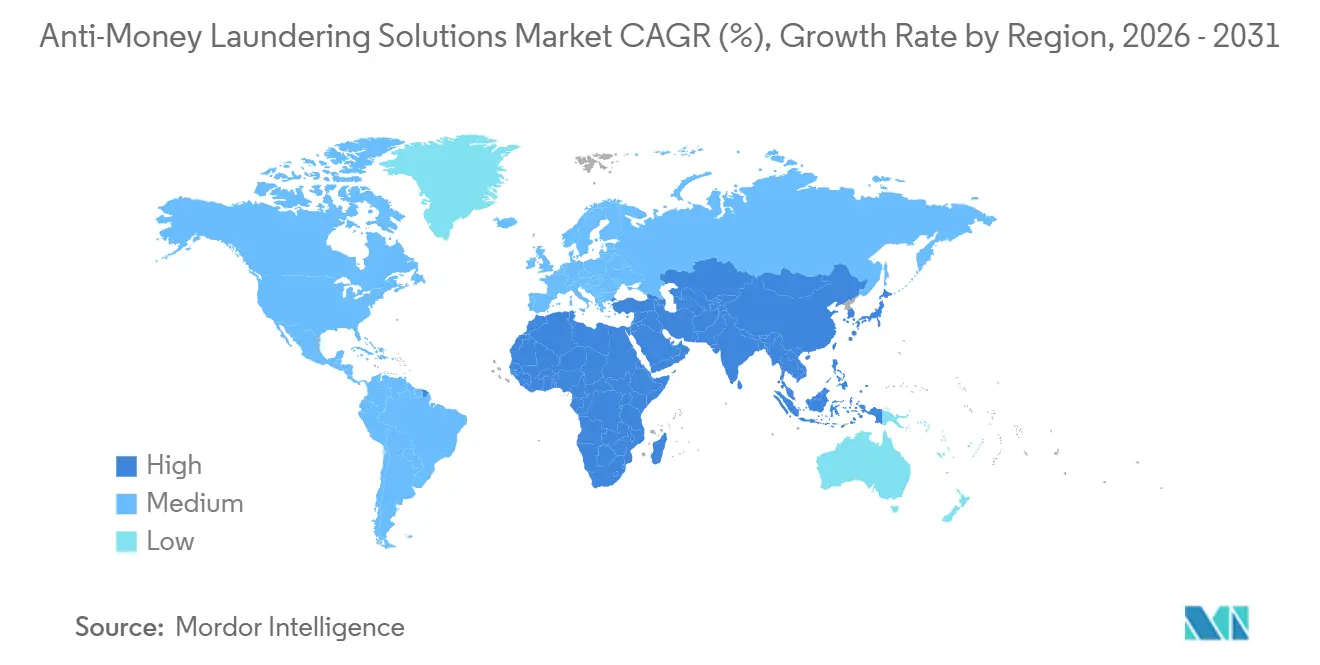
North America generated 43.09% of revenue in 2025 on the back of stringent enforcement and high per-institution budgets. FinCEN’s USD 1.3 billion penalty against TD Bank reinforced the expectation that underinvestment in technology will be punished, prompting multi-year platform replacement programs.
Europe and APAC Anti-Money Laundering Solutions Market
Europe follows closely, with direct supervision by the new European Anti-Money Laundering Authority starting 2028 driving real-time system upgrades. Asia-Pacific, however, is the growth engine, forecast to advance at 19.31% through 2031. Licensing of virtual-asset providers, rapid instant-payment adoption, and Financial Action Task Force grey-listing pressures create an urgent need for modern surveillance across banks, fintechs, and public agencies.
MEA and South America Anti-Money Laundering Solutions Market
South America and Africa remain smaller but strategically important, as correspondent banking retrenchment forces local institutions to modernize controls or lose access to dollar clearing. The Middle East leverages anti-money laundering modernization to attract fintech sandboxes and cross-border payment corridors, adding incremental demand for the anti-money laundering solutions market.
Regulatory Landscape
Regulatory pressure is tightening around real-time controls, beneficial-ownership transparency, and virtual-asset oversight. In the European Union, the unified AML package built around Regulation (EU) 2024/1624 and the AMLA founding regulation (Regulation (EU) 2024/1620) is moving from legislation to implementation. AMLA applies from December 31, 2025, and Member States must bring national provisions into force for beneficial-ownership register rules by July 10, 2026, which pushes financial institutions and covered non-financial firms to update transaction screening, case management, and reporting workflows, especially as instant payments compress decision windows.
Globally, FATF standards keep driving convergence on cross-border transparency and VASP supervision. FATF reported that, as of July 2026, 83% of surveyed jurisdictions had passed Travel Rule legislation, up from 73% in 2025. Its Seventh Targeted Update in July 2026 also pointed to persistent gaps in licensing, registration, and supervision of VASPs, which is lifting demand for blockchain analytics and for governance controls around outsourced and cloud-based monitoring. Buyers are also prioritizing explainable model documentation that supervisors can review across banking, fintech, and virtual-asset ecosystems.
Competitive Landscape
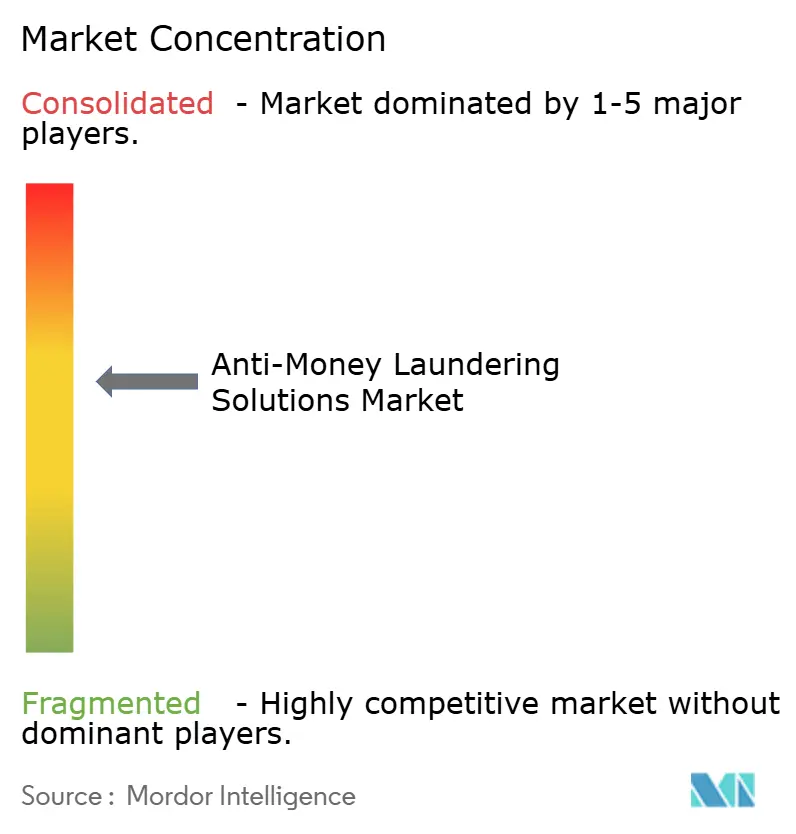
The anti-money laundering solutions market sits at moderate concentration, with legacy platform providers SAS, NICE Actimize and Oracle defending installed bases against niche AI specialists such as Hawk AI and Lucinity. Incumbents are infusing platforms with generative-AI investigation assistants that draft narrative reports and accelerate disposition cycles. Disruptors differentiate through lightweight SaaS footprints and transparent model architectures that satisfy the rising bar for explainability.
Strategic alliances multiply as vendors pair software with curated data feeds, managed-service operators and cloud-infrastructure majors. Mastercard’s Asia-Pacific TRACE launch underscores the value of payment-rail adjacency in winning regional share. Funding momentum is strong: Napier AI’s growth-equity infusion from Marlin Equity is earmarked for global channel build-out and R&D on explainable ML.
Price competition centers on total-cost-of-ownership rather than license rates alone, with buyers valuing platform extensibility, managed-service bundles and pay-per-throughput models. Vendor roadmaps converge on self-configuring risk scenarios that learn from investigator feedback loops—an arms race that places data-science talent at a premium.
Anti-Money Laundering Solutions Industry Leaders
-
SAS Institute, Inc.
-
NICE Actimize (Nice Ltd)
-
LexisNexis Risk Solutions
-
Fair Isaac Corporation (FICO)
-
Oracle Corporation
- *Disclaimer: Major Players sorted in no particular order
Anti-Money Laundering Solutions Market Companies Covered in this Report
- SAS Institute Inc.
- NICE Actimize (NICE Ltd)
- Oracle Corporation
- Refinitiv Ltd (LSEG)
- LexisNexis Risk Solutions
- Fair Isaac Corporation (FICO)
- ACI Worldwide Inc.
- Fiserv Inc.
- BAE Systems plc
- Tata Consultancy Services Ltd
- Temenos AG
- Nasdaq Inc.
- Experian Information Solutions Inc.
- Moody's Analytics, Inc.
- Wolters Kluwer NV
- Intellect Design Arena Ltd
- Jumio Corporation
- Trulioo Information Services Inc.
- Accenture plc
- IBM Corporation
Market Opportunities and Future Outlook
Agentic AI and investigation automation are moving from pilots to procurement items as institutions face higher volumes, tighter response windows, and persistent false-positive costs. In May 2026, FIS announced a collaboration with Anthropic to develop a Financial Crimes AI Agent, with BMO and Amalgamated Bank named as initial pilots. This points to near-term buyer validation for AI-assisted alert investigation and evidence assembly within core banking stacks. In parallel, capital formation is backing AI-native compliance platforms, including TRM Labs raising USD 70 million in February 2026 to scale AI-enabled compliance and investigations for crypto-related financial crime.
Trade-based money laundering controls and cross-border data standardization open additional demand beyond traditional banking transaction monitoring. In July 2026, Ajman Bank implemented Cleareye.ai's ClearTrade to automate TBML screening and trade-finance compliance workflows, reinforcing the case for platforms that connect document, shipment, and payment signals. The EU AML framework also embeds operational deadlines, including AMLA-led technical standards workstreams and the July 10, 2026 milestone linked to beneficial-ownership register provisions. That combination favors solutions that can harmonize onboarding, monitoring, and reporting across entities while accommodating data-residency and governance requirements that shape hybrid and sovereign-cloud deployments.
Recent Industry Developments in Anti-Money Laundering Solutions Market
- June 2026: DNB Bank ASA selected NICE Actimize X-Sight Enterprise to modernize fraud and financial crime operations, covering suspicious activity monitoring and integrated fraud management. The program included implementation support from Infosys, reinforcing the trend toward SaaS and services-led deployments for large institutions consolidating FRAML workflows on a single platform.
- January 2026: NICE Actimize launched the Actimize Insights Network to provide real-time visibility into counterparty risk and emerging threat patterns across its fraud and financial crime network. Networked intelligence aligns with instant-payment monitoring needs by enabling faster risk signal sharing than institution-only models.
- April 2025: NICE Actimize introduced Xceed AI agents for its SaaS-based FRAML solutions to automate AML and fraud detection tasks in human-AI collaborative workflows. The release strengthened vendor roadmaps around investigation automation and alert handling efficiency, a key buying criterion as monitoring volumes increase.
Anti-Money Laundering Solutions Market Report Scope and Research Methodology
Market Definition and Coverage
This market covers spending on anti-money laundering solutions that help organizations detect, monitor, investigate, and report suspicious activity, including software and related services delivered through on-premise, cloud, or hybrid setups.
Scope exclusions: We do not count general cybersecurity tools, core banking platforms, or broad identity management suites unless they are sold and deployed specifically for AML use cases.
Segments Covered in This Report
- By Solution
- Transaction Monitoring Systems
- Know-Your-Customer / Customer Due Diligence (KYC/CDD)
- Sanctions and PEP Screening
- Case and Alert Management
- Currency Transaction and Regulatory Reporting
- Trade-Based AML Analytics
- By Component
- Software
- Services (Managed, Professional)
- By Deployment Model
- On-Premise
- Cloud
- Hybrid
- By Organization Size
- Large Enterprises
- Small and Medium-sized Enterprises
- By End-User Industry
- Banking
- Insurance
- FinTech and Payment Service Providers
- Wealth and Asset Management / Investment Advisers
- Gaming and Gambling Operators
- Cryptocurrency Exchanges and Virtual-Asset Service Providers
- Government and Public Sector
- By Geography
- North America
- United States
- Canada
- Mexico
- South America
- Brazil
- Argentina
- Rest of South America
- Europe
- United Kingdom
- Germany
- France
- Spain
- Nordics
- Rest of Europe
- Asia-Pacific
- China
- Japan
- India
- Southeast Asia
- Australia
- New Zealand
- Rest of Asia-Pacific
- Middle East
- GCC Countries
- Turkey
- Rest of Middle East
- Africa
- South Africa
- Nigeria
- Rest of Africa
- North America
Data Sources, Market Sizing, and Validation
Desk Research
Desk work starts with setting the market boundary and building the demand story, and then checking it against repeatable public signals. We referenced regulatory and policy materials that influence AML adoption, such as FATF guidance, FinCEN releases, and European Banking Authority publications, because these indicate what institutions must implement and how quickly.
To size the addressable base and trend lines, we also used sources such as the World Bank, IMF, and UNODC for macro and financial system indicators, along with annual reports and investor decks for product mix and geographic exposure cues. Where available, peer reviewed papers and patent databases were used to understand feature evolution, such as alert triage, screening logic, and analytics, since these can shift pricing and refresh cycles. For cross checks, we used paid subscriptions for company financial intelligence, news and financials, and patents to validate timelines, product positioning, and major contract announcements. The desk sources mentioned above are illustrative, and many other references were also used to collect data, validate assumptions, and clarify gaps.
Primary Interviews and Surveys
Primary work focused on validating what is actually being purchased and renewed, and how budgeting is shifting across screening, transaction monitoring, case management, and reporting workflows. We spoke with a balanced mix of solution providers, implementation partners, and compliance and risk teams across the Americas, EMEA, and APAC, so assumptions from desk research could be corrected before totals and growth rates were finalized.
Distribution of primary research fieldwork respondents
| Company type | Respondent position | Region |
|---|---|---|
| Top tier: 29% | CXOs: 12% | APAC: 43% |
| Mid tier: 57% | Functional/Unit leaders: 32% | EMEA: 32% |
| Smaller Players: 14% | Managers: 56% | Americas: 25% |
Market-Sizing & Forecasting
Market sizing used top-down and bottom-up approaches, where regional compliance spending pools are reconstructed from the installed base of regulated institutions and AML program intensity, and then translated into solution spend through penetration and replacement cycles. Those totals are then checked using selective bottom-up approximations, including sampled price bands by module, channel checks on implementation effort, and a limited roll up of supplier revenue exposure disclosed in public filings.
Key inputs (illustrative) included counts of regulated financial institutions and high risk non-financial entities, volumes of payment and digital transaction activity, enforcement and reporting intensity, cloud adoption rates in compliance workflows, and module mix shifts between screening, monitoring, and case management. Since data is uneven across regions, gaps were handled using proxy indicators that move with AML demand, such as growth in cross-border payments and new customer onboarding volumes, and then adjusting them based on interview feedback on tool usage and renewal behavior.
Forecasting relied mainly on scenario analysis, since adoption can be influenced by regulation timing, typology shifts, and technology refresh cycles. Under each scenario, pricing progression, cloud migration pace, and alert volumes were varied, and then reconciled back to budgets and procurement cycles described by primary respondents.
Data Validation & Update Cycle
Validation is done through multiple checkpoints so the final number is not driven by a single assumption. Our analysts compare model outputs with independent signals, such as public enforcement actions, reported compliance cost direction, and shifts in vendor revenue mix, and then flag outliers for review.
Before sign-off, variances are tested across regions, deployment models, and solution types, so growth rates line up with explainable drivers rather than one-time spikes. If a large mismatch is found, respondents are re-contacted to confirm whether it is a scope issue, a timing issue, or a pricing and mix issue. Reports are refreshed annually, with interim updates when material events occur, and a final pre-delivery pass so clients receive the latest view.
Mordor Intelligence's Anti Money Laundering Solutions Market Size Versus Other Published Estimates
Published market values for AML can look far apart because the underlying item being counted is not always the same, even when titles sound similar. Differences usually come from how each publisher treats modules versus full platforms, whether services are included, and which industries beyond banking are counted.
Another driver is the way spend is converted into revenue, since some estimates rely on broad IT budget assumptions, aggressive price ramps, or currency timing that does not match procurement cycles. The biggest spread tends to appear when total AML systems spend is mixed with broader financial crime tooling and multi-industry budgets, whereas the figure here stays centered on AML solution revenue tied to screening, monitoring, case management, and regulatory reporting modules, a scope line applied by Mordor Intelligence.
Benchmark comparison
| Source | Market Size | Gaps in Research Methodology |
|---|---|---|
| Mordor Intelligence | USD 4.05 B (2026) | |
| Industry Research Suite A | USD 33.90 B (2025) | Uses total spend on AML systems across a broad set of verticals and budgeting lines, which can include wider platform spend and non-AML compliance tooling, thereby inflating the pool versus a solutions revenue view. |
| Trade Publisher B | USD 28.70 B (2024) | Frames the market as overall AML systems spend with multi-industry coverage, and the spend definition can blend licenses, services, and broader compliance systems, which makes it less comparable to AML solution revenue. |
The table shows that the gap is mainly definitional, since the larger figures reflect a wider spend envelope rather than vendor revenue for AML solutions. When the same demand drivers are kept in view and the scope is held to AML specific modules and related services, results are easier to reproduce and check year to year using consistent steps and inputs.
Key Questions Answered in the Report
How big is the anti-money laundering solutions market in 2026?
The anti-money laundering solutions market size is estimated at USD 4.05 billion in 2026.
What is the projected CAGR for anti-money laundering solutions from 2026 to 2031?
The market is forecast to register an 18.01% CAGR during the 2026-2031 period.
Which solution segment will grow the fastest through 2031?
Trade-based analytics is projected to expand at an 18.91% CAGR, outpacing all other solution segments.
Why are small and medium-sized enterprises adopting anti-money laundering platforms?
New regulations now compel advisers, crowdfunding portals, and similar SMEs to monitor transactions, and SaaS pricing lets them comply without large in-house teams.
Which region will see the highest growth in anti-money laundering spending?
Asia-Pacific is forecast to grow at 19.31% through 2031, propelled by virtual-asset licensing and instant-payment adoption.
How are vendors using artificial intelligence in anti-money laundering systems?
Providers embed agentic AI that drafts investigation narratives, surfaces cross-bank risk signals, and retrains models continuously to cut false positives and investigation times.