
Anti-Graffiti Coatings Market Size and Share
Market Overview
| Study Period | 2020 - 2031 |
|---|---|
| Market Size (2026) | USD 90.55 Million |
| Market Size (2031) | USD 109.45 Million |
| Growth Rate (2026 - 2031) | 3.87 % |
| Fastest Growing Market | Asia Pacific |
| Largest Market | North America |
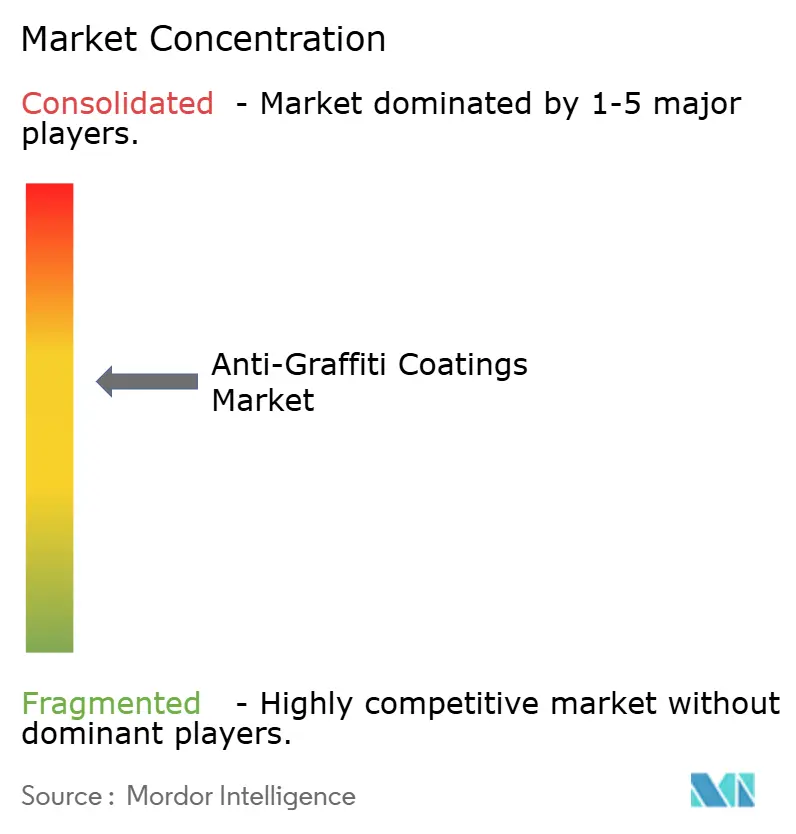
| Market Concentration | Medium |
Major Players *Disclaimer: Major Players sorted in no particular order Image © Mordor Intelligence. Reuse requires attribution under CC BY 4.0. | |
Anti-Graffiti Coatings Market Analysis by Mordor Intelligence
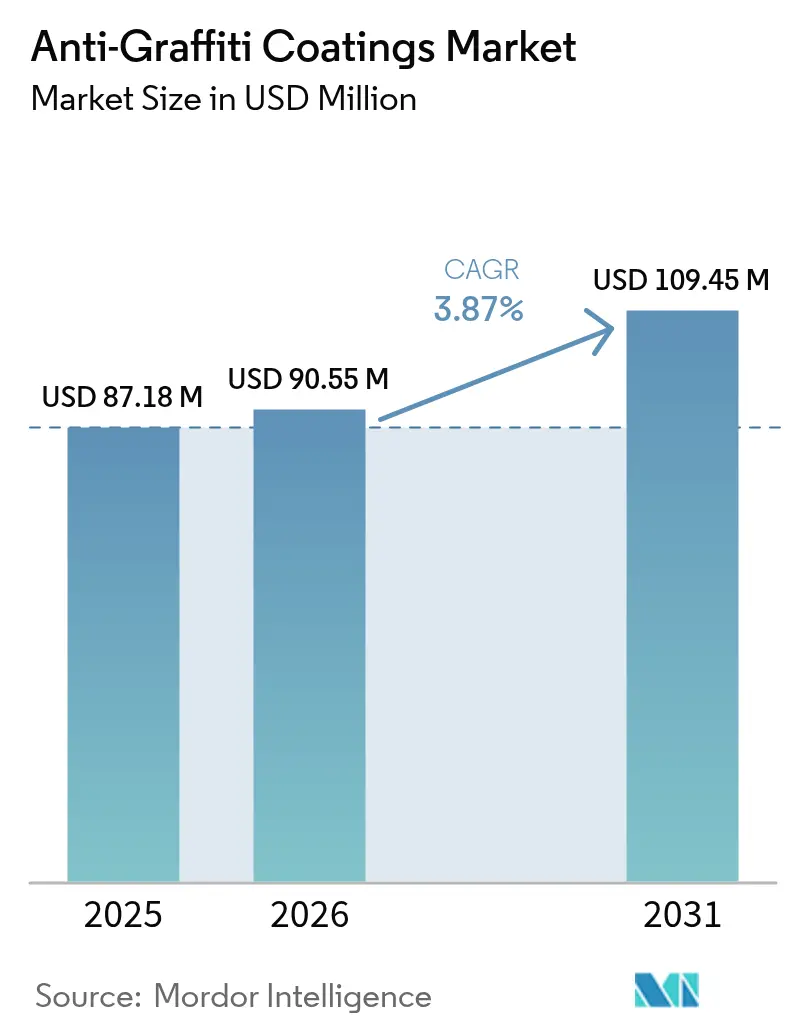
The Anti-Graffiti Coatings market size is expected to grow from USD 87.18 Million in 2025 to USD 90.55 Million in 2026 and is forecast to reach USD 109.45 Million by 2031 at 3.87% CAGR over 2026-2031. Growth is shaped by a decisive pivot toward water-based and silicone-rich chemistries as Per- and polyfluoroalkyl substances (PFAS) phase-outs spread from California to France and Australia. Higher municipal graffiti-removal budgets, brisk infrastructure pipelines in Asia-Pacific, and regulatory crack-downs on Volatile Organic Compounds (VOCs) are sustaining demand for durable, low-emission products across construction and transit assets. Parallel innovation in dual-function and powder formats is broadening competitive opportunities while raw-material cost swings and adhesion challenges on novel substrates temper short-run expansion.
Key Report Takeaways
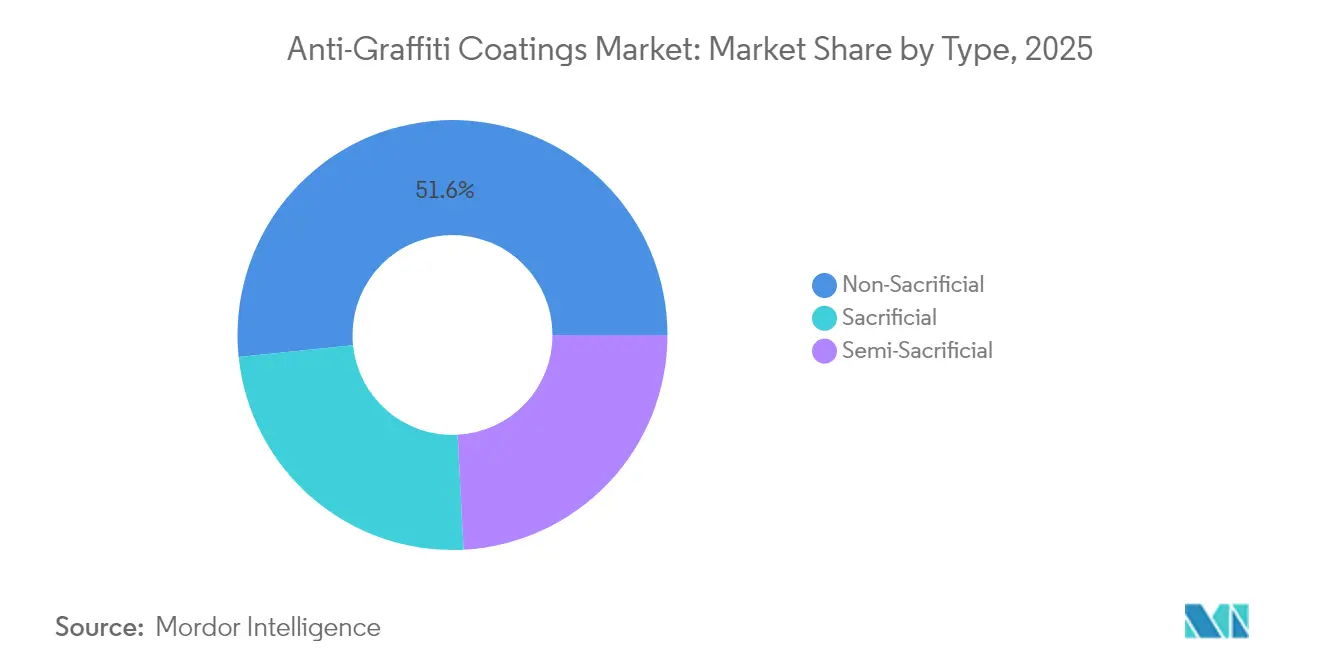
- By type: Non-sacrificial solutions led with 51.63% of Anti-Graffiti Coatings market share in 2025 and are advancing at a 4.42% CAGR through 2031.
- By technology: Water-based chemistries captured 55.10% share of the Anti-Graffiti Coatings market size in 2025 and are expanding at 4.18% CAGR.
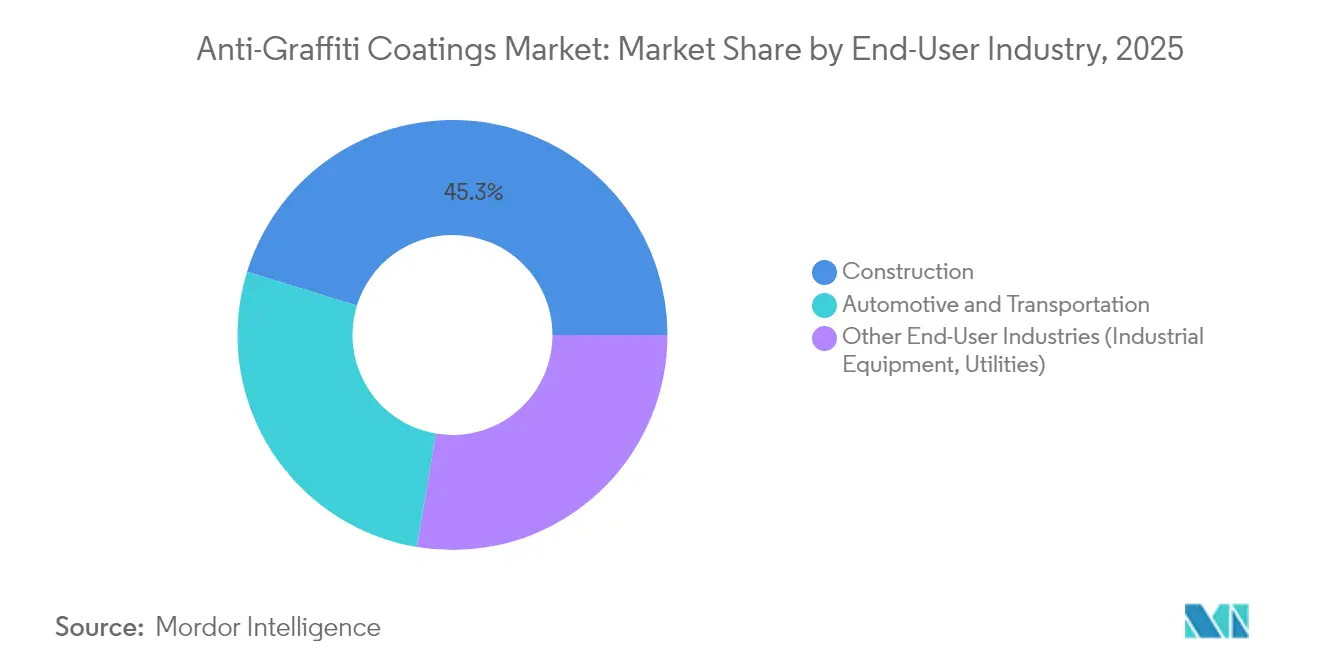
- By end-user industry: Construction accounted for 45.25% of demand in 2025, while utilities and industrial equipment under Other End-User Industries are growing at 4.11% CAGR to 2031.
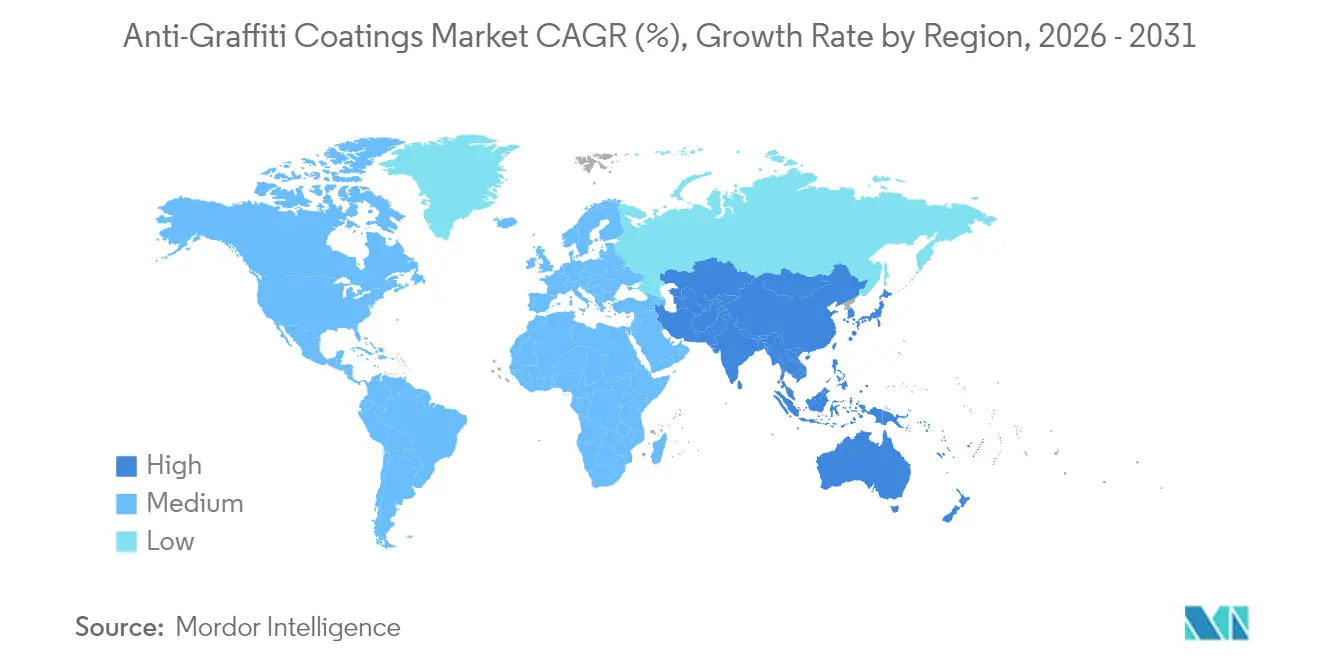
- By geography: North America held a 38.90% share in 2025; Asia-Pacific is the fastest-growing region at 4.14% CAGR through 2031.
Note: Market size and forecast figures in this report are generated using Mordor Intelligence’s proprietary estimation framework, updated with the latest available data and insights as of 2026.
Market Trends and Insights
Drivers Impact Analysis of Anti-Graffiti Coatings Market*
| Driver | (~) % Impact on CAGR Forecast | Geographic Relevance | Impact Timeline |
|---|---|---|---|
| Escalating Municipality Spending on Graffiti Removal | +1.0% | North America & Europe, rising in APAC | Medium term (2-4 years) |
| Rapid Expansion of Public‐infrastructure Construction | +0.8% | APAC core, spill-over to MEA and Latin America | Long term (≥ 4 years) |
| Stricter Volatile Organic Compound (VOC) Norms Accelerating Water-borne Formulations | +0.6% | North America & EU, expanding to APAC | Short term (≤ 2 years) |
| Adoption of Anti-graffiti Powder Coatings for Smart-city Street Furniture | +0.4% | Global urban centers, early gains in developed markets | Medium term (2-4 years) |
| Convergence of Anti-graffiti & Antimicrobial Surfaces in Transit Assets | +0.3% | Global transit systems, faster uptake in post-pandemic markets | Short term (≤ 2 years) |
| Source: Mordor Intelligence | |||
Escalating Municipality Spending on Graffiti Removal
Cities are front-loading budgets to curb soaring vandalism costs that outpace routine maintenance allocations. Portland’s Emergency Ordinance 1099-2024 follows a 586% jump in graffiti complaints between 2020 and 2022, while Wellington City Council ring-fenced USD 7.57 Million for protective programmes through 2025 [1]. Deutsche Bahn’s EUR 8 Million annual outlay on cleanup has pushed the rail operator toward polysilazane barriers that tolerate repeated solvent-free wash cycles. As prevention proves cheaper than serial removal, municipal procurement increasingly favours permanent, low-VOC (Volatile Organic Compound) coatings that preserve urban aesthetics and minimise life-cycle costs. This shift anchors steady volume off-take for the anti-graffiti coatings market in public infrastructure and transit assets, underpinning suppliers’ medium-term revenue visibility.
Rapid Expansion of Public Infrastructure Construction
Asia-Pacific construction booms are boosting baseline demand for surface-protection solutions. China’s 2024 National Development and Reform Commission roadmap highlights “high-quality infrastructure” as a domestic-demand catalyst, accelerating anti-graffiti specification in rail, bridge, and smart-city projects. Parallel smart-mobility corridors in India and Indonesia are embedding permanent coatings into procurement standards to curb future maintenance outlays. Similar funding flows from the United States’ Federal Buy Clean initiative channel more than USD 2 Billion toward low-carbon building materials, tilting preferences to water-based, Volatile Organic Compound (VOC)-compliant offerings. Contractors in emerging hubs, often operating without established cleaning fleets, view durable coatings as an upfront safeguard that lowers whole-life costs, reinforcing long-run uptake across the anti-graffiti coatings market.
Stricter Volatile Organic Compound (VOC) Norms Accelerating Water-borne Formulations
Regulators are closing the window on solvent-heavy chemistries. While the United States Environmental Protection Agency (US EPA) still allows 600 g/L Volatile Organic Compound (VOC) for anti-graffiti products, California’s South Coast Air Quality Management District (AQMD) limits non-sacrificial systems to 100 g/L and sacrificial to 50 g/L. Rule 1151 amendments that enter force in May 2025 further blacklist tert-butyl acetate and p-chlorobenzotrifluoride, prompting companies to redesign formulations well ahead of the 2033 compliance deadline. Europe’s Green Deal roadmap and similar Asia-Pacific (APAC) measures mirror this trajectory, steering procurement toward water-based and powder alternatives. Manufacturers investing in one-coating platforms that satisfy the world’s strictest thresholds are winning preferred-supplier status and consolidating volume in the anti-graffiti coatings market.
Adoption of Anti-graffiti Powder Coatings for Smart-city Street Furniture
Smart-city planners specify powder systems that couple graffiti resistance with UV durability and zero onsite VOCs. Sound Transit’s 2024 Standard Specifications dedicate a full section to graffiti-repellent finishes for street furniture and ticketing kiosks [2]. Polyurethane powder layers outperform liquids in colour retention and mechanical endurance, extending service life and lowering repaint frequency. The format’s single-coat application cycle compresses installation schedules, an advantage for densely programmed urban upgrades. As global cities adopt sensor-embedded benches and digital way-finding panels, powder technology secures a foothold in the anti-graffiti coatings market through its alignment with sustainability and smart-infrastructure criteria.
Restraints Impact Analysis of Anti-Graffiti Coatings Market*
| Restraint | (~) % Impact on CAGR Forecast | Geographic Relevance | Impact Timeline |
|---|---|---|---|
| Volatile Siloxane & Fluoropolymer Raw-material Costs | -0.5% | Global, acute in Asia and Europe manufacturing hubs | Short term (≤ 2 years) |
| Emerging Per- and polyfluoroalkyl substances (PFAS) Restrictions Affecting Fluorinated Coatings | -0.3% | North America & EU, spreading worldwide | Medium term (2-4 years) |
| Adhesion Challenges on Highly Porous 3D-Printed Concrete Facades | -0.2% | Global urban centers, concentrated in developed markets | Long term (≥ 4 years) |
| Source: Mordor Intelligence | |||
Volatile Siloxane and Fluoropolymer Raw-Material Costs
Siloxane and fluoropolymer pricing swings are squeezing producer margins at a time when end-users remain price sensitive. European Chemicals Agency proposals to tighten rules on certain silicon compounds, including Silicon Dioxide (SiO₂), have heightened supply-chain caution and inflated compliance expenditures. Producers are experimenting with hybrid chemistries that trim siloxane loads while safeguarding durability, yet re-engineering hurdles and certification timelines slow roll-outs. Smaller formulators reliant on spot purchases face pronounced cost pass-through risks, restraining near-term output in the anti-graffiti coatings market.
Emerging Per- and polyfluoroalkyl substances (PFAS) Restrictions Affecting Fluorinated Coatings
California’s S.B. 903 bans Per- and polyfluoroalkyl substances (PFAS)-containing coatings from January 2030, France enacted a country-wide prohibition in February 2025, and the European Union (EU)’s 2023 draft could outlaw over 10,000 substances. Manufacturers steeped in fluoropolymer platforms must invest in silicone-rich or bio-based substitutes, redesign production lines, and secure new safety dossiers. Performance parity remains challenging in scenarios demanding extreme hydrophobicity, leading to temporary performance trade-offs and added research and development (R&D) spend that dilute earnings. The regulatory wave caps upside for legacy products in the anti-graffiti coatings market until new chemistries scale.
*Our forecasts treat driver/restraint impacts as directional, not additive. The impact forecasts reflect baseline growth, mix effects, and variable interactions.
Anti-Graffiti Coatings Market Segment Analysis
By Type:
Permanent Solutions Drive Market ConsolidationNon-sacrificial systems held 51.63% of anti-graffiti coatings market share in 2025 and are expanding at a 4.42% CAGR to 2031. Customers favour their one-time application and rinse-repeat cleaning tolerance that shrink life-cycle spend. Semi-sacrificial formats satisfy mid-tier budgets with moderate recoat intervals, while sacrificial films cater to historic preservation or sensitive substrates that cannot host durable polymers.
Higher upfront expenditure on non-sacrificial layers is offset by fewer closures of transit stations or public buildings for re-painting. Case studies on polyurethane-powder barriers show wash-off resilience beyond 1,000 cleaning cycles without gloss loss. These economics reinforce the premium niche, anchoring value concentration within the anti-graffiti coatings market.

By Technology:
Water-Based Formulations Capture Regulatory AdvantageWater-borne products controlled 55.10% of the anti-graffiti coatings market size in 2025 and are forecast at 4.18% CAGR through 2031. Volatile Organic Compound (VOC) ceilings of 100 g/L in California and similar European Union (EU) thresholds give these coatings a compliance edge. Solvent-rich systems persist in niche heavy-duty roles where curing speed or extreme adhesion is paramount, yet their share is sliding under regulatory drag. Powder technology, although currently the smallest slice, secures specification in smart-street furniture and modular equipment requiring factory-applied durability.
Continuous advances in resin cross-linking and nano-particle dispersion have narrowed the historical durability gap between water-based and solvent variants. Suppliers pursuing universal-formula roadmaps that satisfy the strictest global Volatile Organic Compound (VOC) yardsticks are converting sales in North America and Europe and exporting identical Stock Keeping Units (SKUs) to Asia-Pacific (APAC), reinforcing scale benefits across the anti-graffiti coatings market.
By End-User Industry:
Construction Leadership Faces Utility-Sector ChallengeConstruction commanded 45.25% demand in 2025, spanning residential façades, bridge pilings, and commercial retail fronts. Satellite pipeline projects in China, India, and Association of Southeast Asian Nations (ASEAN) are set to widen specification for durable protective layers as cities urbanise. Utilities and industrial equipment, nested under Other End-User Industries, are the fastest-growing cohort at 4.11% CAGR. Operators of electric-distribution boxes, water-treatment tanks, and telecom cabinets view graffiti-proof skins as dual shields against chemical attack and vandalism, protecting both public image and operational continuity.
Transit and automotive fleets remain a steady mid-tier outlet, using clear coats and self-adhesive films on buses, rail cars, and rolling stock interiors. The convergence of anti-graffiti and antimicrobial attributes in this segment promises incremental premium pricing and share gains for innovators, supporting a balanced demand matrix within the anti-graffiti coatings industry.
Geography Analysis
North America Anti-Graffiti Coatings Market
North America retained 38.90% of the Anti-Graffiti Coatings market share in 2025. Portland’s Emergency Ordinance 1099-2024 and similar city mandates integrate protective coatings into annual maintenance budgets, translating to predictable recurrent orders. The region’s Buy Clean clauses funnel federal funds toward low-carbon, water-based layers, pushing compliant suppliers up the preferred-vendor ladder. California’s Air Quality Management District (AQMD) caps of 100 g/L Volatile Organic Compound (VOC) on non-sacrificial coatings continue to spur research and development (R&D) output, influencing product lines shipped worldwide.
APAC Anti-Graffiti Coatings Market
Asia-Pacific is the fastest-expanding territory at 4.14% CAGR through 2031, propelled by China’s infrastructure acceleration and India’s 100-smart-city rollout. Urban councils specifying preventive coatings for metro pillars and pedestrian bridges aim to avoid future cleaning labour spikes. Mature markets such as Japan and South Korea sustain flow by retrofitting existing rail and highway assets with low-VOC layers in line with tightened environmental policies.
EMEA and South America Anti-Graffiti Coatings Market
Europe grows steadily under the weight of progressive environmental regulation. France’s Per- and polyfluoroalkyl substances (PFAS) embargo and the European Union (EU)’s pending wide-spectrum restriction are reshuffling resin choices and fast-tracking silicone and bio-polymer research. Germany’s graffiti damage exceeding EUR 200 Million each year sharpens the financial case for permanent barriers, encouraging municipal consortiums to award long-term maintenance contracts featuring anti-graffiti clauses. South America and the Middle East & Africa, while smaller today, are carving space through rapid metro upgrades in São Paulo and Riyadh, positioning the anti-graffiti coatings market for multi-regional breadth.
Value Chain Analysis
The value chain begins with feedstocks and specialty inputs, including petrochemical-derived resins and additives (silanes/siloxanes, polyurethane and epoxy building blocks, waxes), pigments and fillers, and fluorinated raw materials where they are still used. These inputs are processed by resin and additive suppliers, then converted by coatings and film manufacturers into sacrificial, semi-sacrificial, and non-sacrificial anti-graffiti systems across water-based, solvent-based, and powder formats. Compliance and performance validation are built into upstream and midstream activities, since suppliers and formulators must design to emissions limits (for example, the US EPA VOC limit of 600 g/L for anti-graffiti coatings) and substantiate graffiti resistance using tests such as ASTM D6578/D6578M-13 for coated metal panels.
Manufacturing and formulation are followed by packaging and route-to-market through protective coatings distributors, OEM/factory-application channels (notably for powder), and direct sales to contractors and municipal maintenance teams. End users include construction facades, transit assets, and utilities and industrial equipment, where procurement often bundles coating supply with surface preparation, application services, and ongoing cleaning systems. Key switching costs and bottlenecks center on raw-material price volatility for silicone-rich chemistries, reformulation cycles to remove PFAS content, and field-performance risks such as adhesion on newer substrates, including highly porous, additively manufactured concrete. Product innovation also reshapes partnerships in the chain, for instance Evonik commercializing PFAS-free facade protection under Protectosil ECO-TRETE ANTIGRAFFITI and CCM GmbH’s launch of 646 Permanent Protect (ceramic-based), which expands substrate coverage and affects applicator and distributor stocking decisions.
Competitive Landscape
The Anti-Graffiti Coatings market is moderately consolidated. Global multiproduct players, such as PPG Industries Inc., The Sherwin-Williams Company, AkzoNobel N.V., and 3M channel Environmental, Social, and Governance (ESG) budgets into PFAS-free launches and plant decarbonisation. PPG Industries Inc. reported 44% of 2024 revenue from sustainably advantaged lines while trimming operational greenhouse gases by 10%. 3M leverages film technology to ride the dual-function trend in transit interiors, offering bundle solutions that improve procurement economics for fleet operators. Private equity funds are scooping smaller niche formulators to forge scale platforms, betting on tighter regulation favoring capital-intensive compliance capacity.
Anti-Graffiti Coatings Industry Leaders
-
The Sherwin-Williams Company
-
3M
-
AkzoNobel N.V.
-
Axalta Coating Systems, LLC
-
PPG Industries Inc.
- *Disclaimer: Major Players sorted in no particular order
Anti-Graffiti Coatings Market Companies Covered in this Report
- 3M
- AkzoNobel N.V.
- Axalta Coating Systems LLC
- BASF
- CSL Silicones Inc.
- Dulux
- Hempel A/S
- Hydron Protective Coatings Ltd
- IFS Coatings
- IGP Pulvertechnik AG
- Nano-Care Deutschland AG
- Nukote Coating Systems International
- PPG Industries Inc.
- Saint-Gobain
- Teknos Group
- The Sherwin-Williams Company
- Urban Hygiene Ltd
- W.R.Meadows, Inc.
- Wacker Chemie AG
Market Opportunities and Future Outlook
PFAS phase-outs and tightening VOC requirements create whitespace for PFAS-free, low-VOC platforms that maintain high cleanability and durability across common public-asset substrates, such as mineral facades, coated metals, plastics, and glass. One clear signal is Evonik’s March 2026 launch of Protectosil ECO-TRETE ANTIGRAFFITI, a silane-based system formulated without intentionally added PFAS for building facades, which shows suppliers productizing compliant alternatives rather than relying on exemptions for legacy fluorinated chemistries. This supports opportunities for reformulated non-sacrificial and semi-sacrificial systems, and for powder solutions specified for smart-city street furniture, where zero on-site VOCs and factory-applied durability align with public procurement requirements.
Opportunities also show up in multi-function coatings and nano-modified waterborne chemistries aimed at faster cleanup, reduced downtime, and broader protection benefits for exposed infrastructure. Published R&D from 2025 to 2026, including nano-silica and POSS-modified waterborne polyurethane systems and hybrid resin approaches reported in peer-reviewed journals, points to active pathways to improve hardness, stain resistance, and anti-smudge performance while staying within low-emission constraints. In commercial terms, this underpins opportunities in transit and municipal maintenance programs that value repeatable cleaning cycles and SKU standardization across regions, particularly where infrastructure owners are tightening material specifications to reduce lifecycle cleaning costs and prevent extended service interruptions.
Recent Industry Developments in Anti-Graffiti Coatings Market
- July 2026: The Sherwin-Williams Company refreshed market-facing materials for its anti-graffiti siloxane coating positioned as a one-component, non-sacrificial, ready-to-use system that cures via atmospheric moisture. The focus on simplified application and permanent protection aligns with municipal and infrastructure buyers that prioritize rapid turnaround and repeat-cleaning durability rather than recoat-heavy sacrificial approaches.
- August 2025: The Sherwin-Williams Company issued a revised technical datasheet for its 2K Waterbased Anti-Graffiti Coating, describing a two-component, hydrophobic polyurethane system with VOC content under 100 g/L for assets such as bridge abutments, schools, and transit stations. Updated technical documentation supports specification-driven projects and reinforces the shift toward water-based, low-VOC products that fit stricter regional limits.
- April 2024: Nano-Care Deutschland AG introduced its Nanoflex Barrier range, including a permanent anti-graffiti coating for absorbent mineral surfaces as well as coated metals and wood. Broader substrate compatibility and easy-clean positioning support adoption in construction renovation and public-space maintenance, where mixed materials are common.
Anti-Graffiti Coatings Market Report Scope and Research Methodology
Market Definition and Coverage
This market covers coatings applied on surfaces to prevent graffiti from sticking strongly and to make cleaning easier. Revenues are counted as the value of anti-graffiti coating products sold in a year across major regions.
Scope exclusions: Excludes graffiti removers and cleaners that are not sold as protective coatings, along with general-purpose paints that do not claim anti-graffiti performance.
Segments Covered in This Report
- By Type
- Sacrificial
- Semi-Sacrificial
- Non-Sacrificial
- By Technology
- Water-Based
- Solvent-Based
- Powder Coating
- By End-User Industry
- Automotive and Transportation
- Construction
- Other End-User Industries (Industrial Equipment, Utilities)
- By Geography
- Asia-Pacific
- China
- Japan
- India
- South Korea
- ASEAN Countries
- Rest of Asia-Pacific
- North America
- United States
- Canada
- Mexico
- Europe
- Germany
- United Kingdom
- France
- Italy
- Spain
- Russia
- NORDIC Countries
- Rest of Europe
- South America
- Brazil
- Argentina
- Rest of South America
- Middle East and Africa
- Saudi Arabia
- South Africa
- Rest of Middle East and Africa
- Asia-Pacific
Data Sources, Market Sizing, and Validation
Desk Research
Desk work was used to set the industry boundary and to collect stable, repeatable inputs that can be checked externally. References included US EPA and state VOC rule updates, European Chemicals Agency chemical restriction notes, UN Comtrade trade statistics for coatings-linked HS codes, World Bank and national statistics for construction and infrastructure spending, and standards guidance from bodies such as ASTM.
To link these inputs to demand, we also reviewed company annual reports, investor decks, product technical data sheets, and public tender notices for transit assets and municipal maintenance. Where needed, paid subscriptions were used for company financials and news screening, patent databases for technology direction, and shipment-level import and export checks to sanity test regional flows. These sources are not exhaustive, and other public documents were reviewed to fill gaps, validate assumptions, and clarify definitions.
Primary Interviews and Surveys
Primary discussions were held with coating manufacturers, raw material suppliers, applicators, distributors, and asset owners that manage transport and public infrastructure. This helped confirm pricing bands and real adoption levels by surface type. Since demand is global, inputs were checked across APAC, EMEA, and the Americas so regional regulations, procurement cycles, and maintenance practices could be reflected before finalizing the model.
Distribution of primary research fieldwork respondents
| Company type | Respondent position | Region |
|---|---|---|
| Top tier: 31% | CXOs: 17% | APAC: 41% |
| Mid tier: 52% | Functional/Unit leaders: 24% | EMEA: 36% |
| Smaller Players: 17% | Managers: 59% | Americas: 23% |
Market-Sizing & Forecasting
Sizing starts with a top-down build in which coatings demand is reconstructed from construction and infrastructure activity, public-asset maintenance intensity, and the practical penetration of anti-graffiti protection by region. To keep totals realistic, the model is corroborated with selective bottom-up checks, including supplier revenue splits where available, distributor channel feedback, and sampled price per liter multiplied by estimated volumes for a few high-usage use cases.
Key inputs used in the model include the installed base of graffiti-prone assets (transit, public buildings, utilities), repaint and maintenance cycles, shifts between water-based and solvent-based technologies due to VOC rules, typical coverage rates and recoat frequency by coating type (sacrificial, semi-sacrificial, non-sacrificial), and observed price movements tied to resin and additive costs. Forecasts use scenario analysis with a light multivariate regression layer, where construction spending outlook, urban transit expansion, and regulation-driven technology shifts are used as the main drivers, then tuned using expert expectations from interviews. Where bottom-up signals were incomplete in smaller countries, gaps were handled by proxying from comparable markets using urbanization and infrastructure intensity, and then rechecked against trade and pricing cues.
Data Validation & Update Cycle
Outputs are checked through multiple passes so final totals align with independent signals, including regional coatings demand indicators, trade directionality, and realistic pricing bands. If unusual jumps appear, assumptions are revisited and respondents are re-contacted if needed to confirm whether the change is a true shift or a data artifact.
Before sign-off, another analyst reviews the math, scope logic, and year-to-year movements to confirm they are explainable with the drivers used. The report is refreshed annually, and interim updates are made when material events occur, including major regulatory changes or sharp raw material price swings. Right before delivery, a fresh check is run so clients receive the most current view available.
Mordor Intelligence's Anti Graffiti Coatings Market Estimate Compared With Other Published Estimates
Published market sizes for anti-graffiti coatings often vary because groups do not always apply the same product boundary, base year, and pricing logic, even when describing a similar end use. Differences also emerge when one estimate relies more heavily on demand signals from construction activity, while another emphasizes supplier shipments or stated capacity.
The table indicates a broad spread in the stated 2024 to 2026 values, which is usually driven by what is treated as an anti-graffiti coating versus a broader protective coating, and by assumptions on how fast average selling prices move under regulation and raw material cost swings. The spread can also come from whether powder coating formats are included consistently, whether end users such as utilities and industrial equipment are counted in full, and how currency conversion timing is handled when rolling up regional totals.
Benchmark comparison
| Source | Market Size | Gaps in Research Methodology |
|---|---|---|
| Mordor Intelligence | USD 90.55 M (2026) | |
| Global Consultancy A | USD 144.60 M (2024) | Uses an earlier base year and appears to apply a wider coating scope that can pull in adjacent protective coating demand, which lifts the total even when end-use language looks similar. |
| Industry Publisher B | USD 94.70 M (2025) | Relies on a different time window and limited public detail on regional roll-ups, which can change how penetration and pricing are applied across construction and transport assets. |
The main gap is scope width and base-year choice. In Mordor Intelligence's model, the value is tied to anti-graffiti coating types and technologies (including water-based, solvent-based, and powder coating) rather than counting broader protective coatings that may be used for other performance needs. When the market is anchored to clear adoption drivers like asset maintenance cycles and regulation-driven technology shifts, the result is easier to trace and re-run as new data is added each year.
Key Questions Answered in the Report
What is the current size of the anti-graffiti coatings market?
The anti-graffiti coatings market size stands at USD 90.55 Million in 2026 and is forecast to reach USD 109.45 Million by 2031.
Which coating type holds the largest revenue share?
Non-sacrificial coatings lead with 51.63% share and exhibit the highest growth at 4.42% CAGR.
Why are water-based formulations gaining popularity?
Tightening Volatile Organic Compound (VOC) rules, especially California’s 100 g/L limit, and parallel European Union (EU) policies favour water-based chemistries that meet strict emissions caps.
Which region is growing fastest?
Asia-Pacific is the fastest-expanding region, registering a 4.14% CAGR thanks to large-scale infrastructure investment in China, India, and ASEAN.
How are Per- and polyfluoroalkyl substances (PFAS) bans influencing product development?
Upcoming Per- and polyfluoroalkyl substances (PFAS) prohibitions in California, France, and the European Union (EU) are accelerating research and development (R&D) into silicone, bio-based, and graphene-enhanced alternatives to maintain water-repellent performance without restricted substances.