
Analytical Instrumentation In Life Science Market Size and Share
Market Overview
| Study Period | 2020 - 2031 |
|---|---|
| Market Size (2026) | USD 22.01 Billion |
| Market Size (2031) | USD 31.72 Billion |
| Growth Rate (2026 - 2031) | 7.60 % |
| Fastest Growing Market | Asia Pacific |
| Largest Market | North America |
| Market Concentration | Medium |
Major Players *Disclaimer: Major Players sorted in no particular order Image © Mordor Intelligence. Reuse requires attribution under CC BY 4.0. | |
Analytical Instrumentation In Life Science Market Analysis by Mordor Intelligence
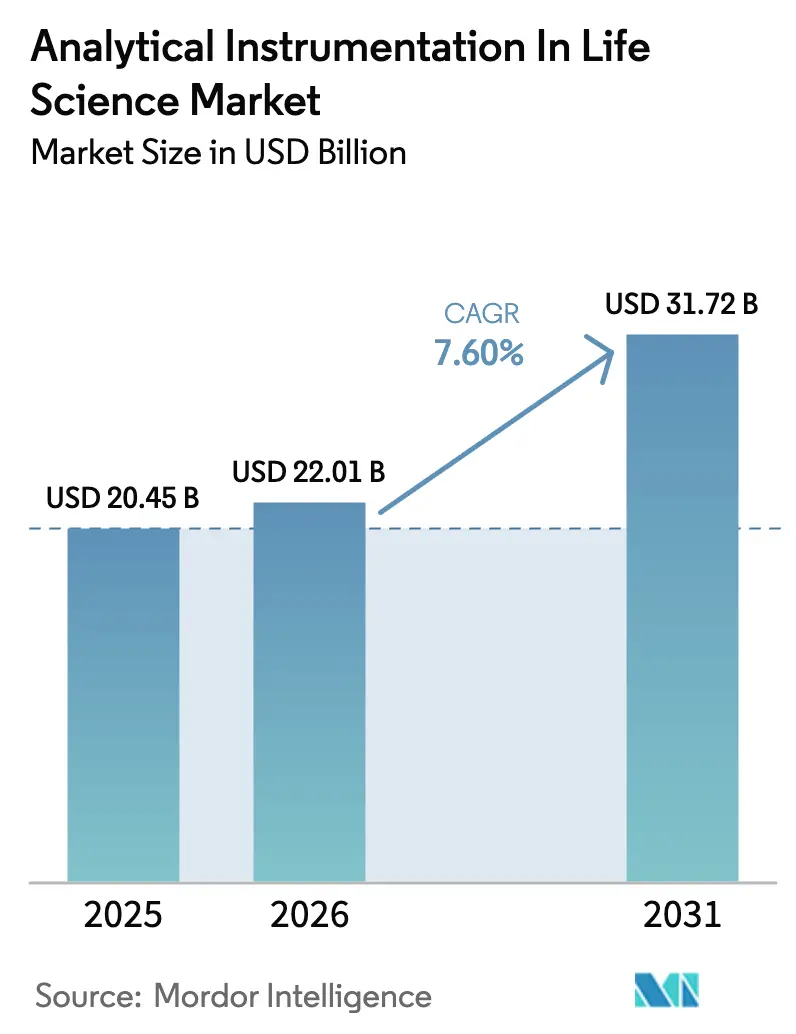
The analytical instrumentation in life science market size is expected to grow from USD 20.45 billion in 2025 to USD 22.01 billion in 2026 and is forecast to reach USD 31.72 billion by 2031 at 7.60% CAGR over 2026-2031. Heightened biologics development, stricter regulatory expectations for real-time process control, and accelerating precision-medicine programs are the primary engines behind this expansion.[1] Growing demand for high-resolution mass spectrometry, chromatography innovations that support continuous manufacturing, and artificial-intelligence-powered data analytics continue to widen the application scope of next-generation instruments. Asia-Pacific records the fastest uptake as regional CDMOs standardize high-throughput screening, while North America capitalizes on its established R&D infrastructure to maintain value leadership.[2] Competitive activity is typified by scale-building acquisitions that bundle instruments, software, and consumables into integrated workflow solutions.
Key Report Takeaways
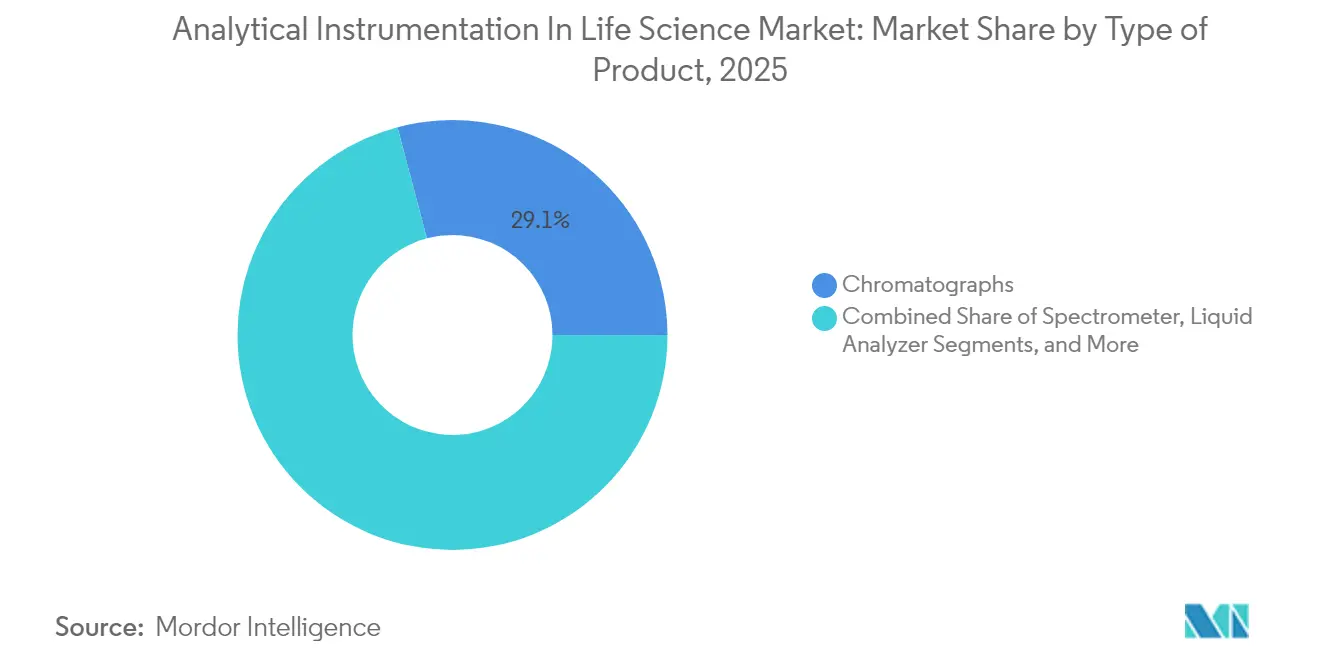
- By product type, chromatographs led with 29.12% revenue share in 2025, while spectrometers are tracking the highest 8.06% CAGR through 2031.
- By end-user, the pharmaceutical segment held 59.35% of the analytical instrumentation in life science market share in 2025; biopharmaceutical and nutraceutical applications are advancing at a 8.74% CAGR.
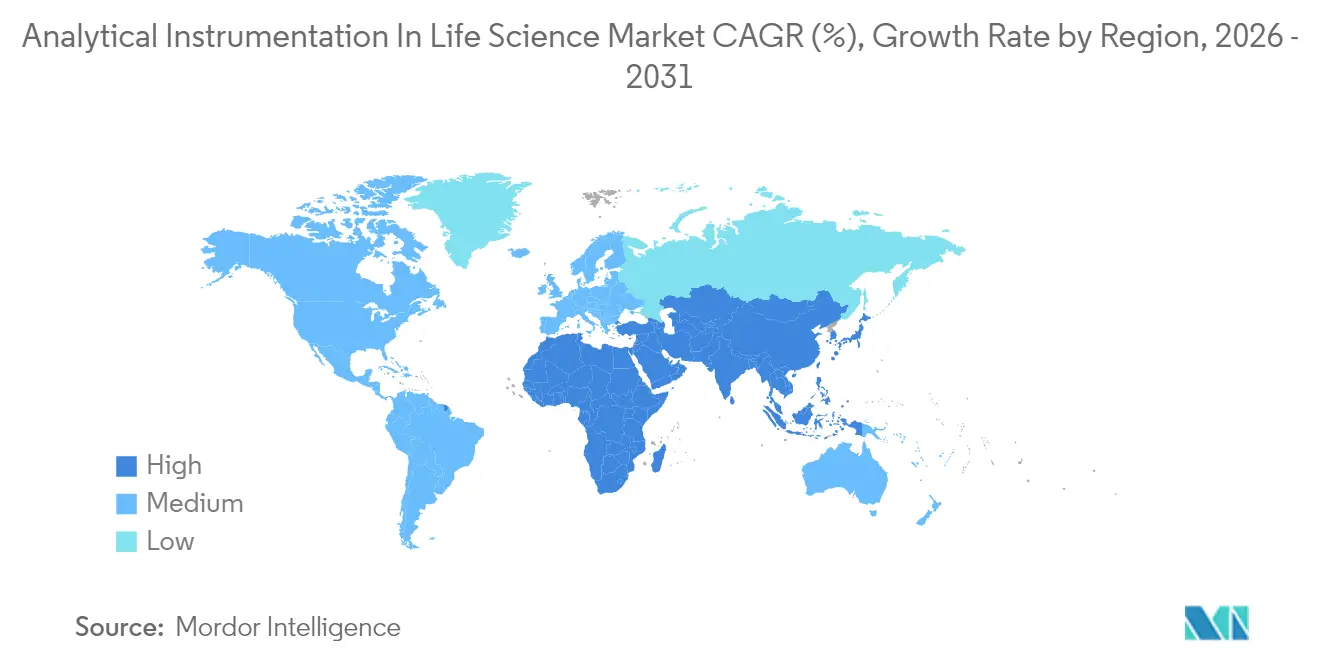
- By geography, North America commanded 38.95% revenue in 2025, whereas Asia-Pacific is projected to expand at a 9.03% CAGR to 2031.
Note: Market size and forecast figures in this report are generated using Mordor Intelligence’s proprietary estimation framework, updated with the latest available data and insights as of 2026.
Market Trends and Insights
Drivers Impact Analysis of Analytical Instrumentation In Life Science Market*
| Driver | (~) % Impact on CAGR Forecast | Geographic Relevance | Impact Timeline |
|---|---|---|---|
| Surge in Demand of Analytical Instrumentation in Pharmaceutical Industry | +1.8% | Global, with concentration in North America & EU | Medium term (2-4 years) |
| Expansion of Cell and Gene Therapy Pipeline Necessitating High-Resolution Characterization | +1.5% | North America & EU core, expanding to APAC | Long term (≥ 4 years) |
| Regulatory Push for In-Line Process Analytical Technology (PAT) in Continuous Manufacturing | +1.2% | Global, led by FDA and EMA jurisdictions | Medium term (2-4 years) |
| Growing Public-Private Funding in Omics and Biomarker Research | +1.0% | North America & EU, emerging in APAC | Long term (≥ 4 years) |
| Rising Potency of Novel Drug Modalities Requiring Ultra-Sensitive Detection | +0.9% | Global, concentrated in major pharma hubs | Medium term (2-4 years) |
| Accelerated Adoption of High-Throughput Screening by Asian CDMOs | +0.7% | APAC core, spill-over to global supply chains | Short term (≤ 2 years) |
| Source: Mordor Intelligence | |||
Surge in demand for analytical instrumentation in pharmaceutical manufacturing
The FDA’s 2025 update to 21 CFR 211.110 formalizes expectations for continuous processing, elevating process-analytical-technology (PAT) systems from optional enhancements to essential control tools. Harmonized ICH Q2(R2) and Q14 guidelines allow platform methods to be validated across multiple products, shrinking timelines and creating sustained pull for multi-attribute chromatography and mass-spectrometry solutions. Manufacturers now rely on real-time attribute measurements to release batches in hours rather than days, a shift that materially increases the installed base of high-performance instruments across development and commercial sites.
Expansion of cell and gene therapy pipeline
Regulators now highlight empty-capsid control and post-translational-modification monitoring as critical quality attributes for viral vectors, pushing biopharma firms toward orbitrap-class mass spectrometry and high-resolution chromatography.[3] Samsung Biologics reduced protein variant analysis from 6-8 weeks to 1-2 weeks by integrating LC-MS/MS with multiplexed workflows, demonstrating the productivity gains attached to next-generation platforms. As global gene-therapy trials multiply, demand for sensitive, high-throughput characterization tools cements spectrometers as pivotal growth engines in the analytical instrumentation in life science market.
Regulatory push for in-line PAT in continuous manufacturing
Quality-by-design paradigms require real-time parameter monitoring; magnetic-sector MS and Raman spectroscopy are being embedded into bioreactors and solvent-recovery loops to guide instantaneous feedback control. Europe’s PIC/S alignment is now mirrored by Singapore and South Korea, enabling vendors to deliver standardized PAT suites across multiple jurisdictions, accelerating global market penetration.
Growing public-private funding in omics and biomarker research
Thermo Fisher’s USD 3.1 billion Olink acquisition underscores the commercial weight of high-throughput proteomics in precision medicine. AI-driven Raman spectroscopy maps tumor-immune microenvironments with single-cell resolution, confirming how machine learning augments instrument value and widens clinical utility. Robust funding pipelines drive labs to invest in multiplexed mass-spectrometry and imaging platforms that accommodate integrated genomics–proteomics workflows, reinforcing long-term equipment outlays.[4]
Restraints Impact Analysis of Analytical Instrumentation In Life Science Market*
| Restraint | (~) % Impact on CAGR Forecast | Geographic Relevance | Impact Timeline |
|---|---|---|---|
| High Initial Cost | -1.4% | Global, particularly impacting emerging markets | Medium term (2-4 years) |
| Shortage of Skilled Analytical Chemists and Data Scientists | -1.1% | Global, acute in North America & EU | Long term (≥ 4 years) |
| Data Integrity and Validation Compliance Burden (ALCOA+ requirements) | -0.8% | Global, concentrated in regulated markets | Medium term (2-4 years) |
| Complex Preventive Maintenance Leading to Higher Downtime Costs | -0.6% | Global, affecting high-throughput facilities | Short term (≤ 2 years) |
| Source: Mordor Intelligence | |||
High initial cost
Capital budgets remain tightly controlled; 64% of laboratories report difficulty approving new instrument purchases, and consumables can consume up to 80% of lifetime costs. Instrument-as-a-service models and shared-facility consortia are emerging to offset cash-flow barriers, while miniaturized handheld spectrometers projected to reach USD 4 billion by 2030 offer tailored, lower-priced alternatives for niche assays.[5]
Shortage of skilled analytical chemists and data scientists
The fusion of AI with analytical workflows demands hybrid skills that remain scarce; universities underutilize advanced mass-spectrometry equipment, leaving graduates underprepared for industry roles. Median analytical-chemist salaries stalled at USD 105,000 in 2024, prompting talent migration toward higher-paying tech sectors and sustaining a structural labor deficit. Vendors are countering with intuitive software and remote-support platforms, yet complex data interpretation still requires expert oversight, prolonging the skills bottleneck.
*Our forecasts treat driver/restraint impacts as directional, not additive. The impact forecasts reflect baseline growth, mix effects, and variable interactions.
Analytical Instrumentation In Life Science Market Segment Analysis
By Type of Product:
Spectrometers drive innovation beyond traditional boundariesThe spectrometer category contributed USD 7.1 billion to the analytical instrumentation in life science market size in 2025 and is set to grow at an 8.06% CAGR through 2031. Liquid chromatographs preserved a 66.85% slice of chromatography revenue, but ion chromatographs now register 8.1% growth on the back of trace-impurity testing mandates. Orbitrap Astral Zoom debuted in 2025 with 35% faster scan rates, enabling real-time peptide-mapping of complex biologics and cementing high-resolution MS as the preferred platform for cell-therapy analytics. Gas-chromatography vendors respond to helium shortages by integrating hydrogen-safety interlocks and nitrogen-switch kits, limiting carrier-gas costs for QC labs. Micro-XRF instruments gain traction for non-destructive elemental mapping in controlled-release tablet coatings, extending their reach beyond traditional materials science. Novel gas analyzers oriented toward bioprocess monitoring now post 8.92% annual growth, reflecting the shift toward continuous biomanufacturing workflows that rely on in-line CO₂ and O₂ analytics.
Second-generation spectrometers further reduce acquisition costs per data point, widening adoption in mid-tier firms without diluting analytical power. As instrument throughput rises, consumable vendors bundle ultralow-void columns and high-capacity trapping cartridges, creating a holistic ecosystem that enhances vendor lock-in. The analytical instrumentation in life science market therefore benefits from hardware, software, and reagent co-development that optimizes complete workflows rather than isolated instrument performance.

By End User Vertical:
Biopharmaceuticals reshape analytical requirementsThe pharmaceutical segment captured 59.35% revenue in 2025, but biopharmaceutical manufacturing is projected to outpace it, expanding at 8.74% CAGR and lifting the collective analytical instrumentation in life science market size for biologics to USD 13.42 billion by 2031. API producers still account for 63.15% of pharmaceutical purchases, yet outsourcing to contract development and manufacturing organizations (CDMOs) is accelerating at 9.68%, creating distributed demand across North American and Asian service hubs.
WuXi Biologics expanded Worcester capacity to 36,000 liters, underlining the scale of analytical demand embedded in multiproduct biologics sites. Samsung Biologics’ 784,000-liter campus exemplifies how mega-facilities integrate hundreds of chromatography, spectroscopy, and in-line PAT stations to maintain consistent viral-vector output. Nutraceutical producers increasingly adopt pharmaceutical-grade validation, leveraging mid-range LC-MS and FT-IR instruments for ingredient authentication and micro-contaminant surveillance. The convergence of end-user requirements encourages platform instrument designs that deliver compliance flexibility across a spectrum of therapeutic and wellness products.
Geography Analysis
North America Analytical Instrumentation in Life Science Market
North America retained 38.95% of 2025 revenue behind its advanced biomanufacturing infrastructure and earliest adoption of continuous-processing guidance. The region’s regulatory rigor drives consistent upgrades to high-resolution instruments, and domestic stimulus packages direct USD-scale investments toward on-shore manufacturing resilience.
APAC Analytical Instrumentation in Life Science Market
Asia-Pacific is the fastest-growing territory, operating at a 9.03% CAGR to 2031 as CDMOs scale capacity and governments offer tax incentives for single-use bioreactors and PAT equipment. India’s generics sector and Singapore’s biologics corridor draw multinational firms that demand standardized QC platforms compatible with global filings, lifting the analytical instrumentation in life science market across the region. China’s CRO industry exceeded CNY 64.77 billion in 2023 and continues to import premium LC-MS and UHPLC systems to service complex molecule pipelines.
EMEA and South America Analytical Instrumentation in Life Science Market
Europe holds steady growth as PIC/S alignment simplifies multinational instrument validation. Waters’ USD 45 million Longbridge plant triples local orbitrap component capacity, underscoring sustained European demand for precision manufacturing inputs. South America is an emerging buyer base; Shimadzu’s Mexico subsidiary seeks 150% sales growth by 2028, signalling regional appetite for tier-one instruments. Middle East and Africa remain early-stage but attract pilot-scale investments tied to vaccine self-sufficiency programs, foreshadowing incremental instrument shipments aligned to GMP facility buildouts.
Regulatory Landscape
Regulation for analytical instrumentation in life sciences is shaped by method validation, quality-system expectations, and accreditation frameworks that govern how data are generated and defended in regulated submissions and official controls. In 2026, the FDA Laboratory Manual of Quality Policies reinforced laboratory quality expectations tied to 21 CFR and ISO/IEC 17025:2017, keeping data-integrity and traceability requirements central for instruments, software, and documentation used in GMP and official testing environments.
Across Europe, 2026 implementing acts added specificity to analytical requirements used for compliance decisions. Commission Implementing Regulation (EU) 2026/765 (April 2026) codified rules for sampling, analysis, and interpretation of pesticide residues in food and feed, which increases the importance of validated multi-residue workflows, often LC-MS and GC-MS, in official control laboratories. Commission Implementing Regulation (EU) 2026/977 (May 2026) also tightened uniform quality management expectations for conformity assessment in medical devices and IVDs under (EU) 2017/745 and 2017/746, reinforcing validated analytical methods and auditable software controls in regulated lab operations. In India, FSSAI issued a May 2026 notice approving technical specifications for high-end equipment such as LC/EA-IRMS, supporting harmonized performance benchmarks for advanced analytical systems used in official food safety testing.
Value Chain Analysis
The value chain spans component and subsystem suppliers (vacuum systems, detectors, lasers, high-voltage electronics, ion sources), OEM instrument manufacturing (chromatography, mass spectrometry, spectroscopy, and gas/liquid analyzers), and downstream workflow enablement through software, consumables, and services. Major OEMs including Thermo Fisher Scientific, Agilent Technologies, Waters Corporation, Bruker Corporation, and Shimadzu commonly use a razor-and-blade approach, with recurring revenues from columns, reagents, sample-prep kits, service contracts, and validated software environments complementing capital equipment sales for regulated laboratories.
Distribution and deployment typically flow through direct sales for strategic biopharma and large CRO/CDMO accounts, and through regional channel partners for academic, clinical, and mid-tier industrial laboratories. After installation, buyers generally rely on installation qualification/operational qualification support, application method development, and ongoing preventive maintenance. Supply-side risk is concentrated in constrained commodities and specialized inputs, for example helium availability affecting GC workflows, and rare earth-related dependencies relevant to certain high-field analytical systems. On the demand side, switching costs increasingly sit in digital layers such as proprietary CDS/LIMS integrations and data governance practices. Regulatory and accreditation anchors, including ISO/IEC 17025:2017 and compendial methods (USP/NF/AOAC for official methods in relevant settings), reinforce traceable consumables, software validation, and service documentation as core value-capture points beyond instrument hardware itself.
Competitive Landscape
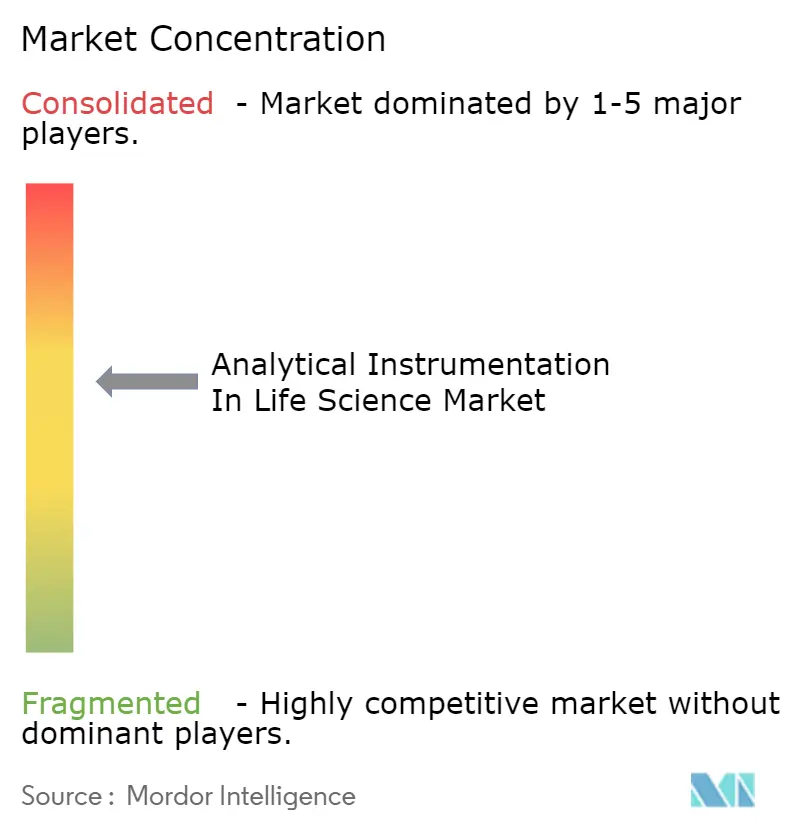
The analytical instrumentation in life science market is moderately consolidated; the top five suppliers control 49% of 2024 global revenue, with Thermo Fisher holding 23%. Multi-year acquisition pipelines aim to secure integrated software, consumables, and services that elevate switching costs. Thermo Fisher’s USD 4.1 billion purchase of Solventum’s purification unit extends its downstream-processing footprint and reinforces cross-selling of chromatography and filtration consumables. Agilent’s USD 925 million BioVectra buy-out strengthens the firm’s RNA-based therapeutics service offering, pairing sample-prep instrumentation with custom manufacturing capacity.
Waters, Danaher, and Bruker focus on differentiated high-resolution MS, GC-MS, and FT-IR systems, embedding AI-driven analytics to boost operator productivity. Waters’ BioResolve Protein A column achieves 7× sensitivity gains, underscoring how consumables innovation supports hardware competitiveness. Bruker integrates DART ionization for faster therapeutic-drug monitoring, broadening clinical applicability of its timsTOF platform. Medium-sized specialists leverage modular designs to serve niche workflows such as in-line gas analysis and mini-XRF food testing, cultivating defensible positions despite scale disadvantages.
Platform-level digital ecosystems emerge as the next battleground. Vendors that couple secure cloud data lakes with predictive-maintenance algorithms create visible ROI for labs facing skilled-labor shortages. Continuous expansion of subscription-based software revenue shields margin in an environment where instrument hardware is incrementally commoditizing.
Analytical Instrumentation In Life Science Industry Leaders
-
Agilent Technologies
-
Thermo Fisher Scientific
-
Waters Corporation
-
Bruker Corporation
-
Shimadzu Scientific
- *Disclaimer: Major Players sorted in no particular order
Analytical Instrumentation In Life Science Market Companies Covered in this Report
- Thermo Fisher Scientific Inc.
- Agilent Technologies Inc.
- Waters Corporation
- Shimadzu Corporation
- Bruker Corporation
- Danaher Corporation (SCIEX and Pall)
- PerkinElmer Inc.
- Mettler Toledo International Inc.
- Sartorius AG
- Merck KGaA (MilliporeSigma)
- Bio-Rad Laboratories Inc.
- Malvern Panalytical Ltd.
- Metrohm AG
- JASCO Corporation
- JEOL Ltd.
- LECO Corporation
- Anton Paar GmbH
- HORIBA Ltd.
- Tecan Group Ltd.
- Hitachi High-Tech Corporation
Read Analysis of Analytical Instrumentation In Life Science Companies
Market Opportunities and Future Outlook
White space is expanding as regulators and accrediting bodies formalize performance and quality expectations that favor standardized, auditable, high-sensitivity workflows. Examples include FSSAI (May 2026) publishing approved technical specifications for high-end equipment such as LC/EA-IRMS, and the EU updating official control method rules through Commission Implementing Regulation (EU) 2026/765 (April 2026) for pesticide-residue sampling and analysis. Both developments support investment in high-resolution, validated analytical stacks across public labs, contract labs, and manufacturer QC.
That setting creates room for vendors and service providers to package instrument qualification, method transfer, and ISO/IEC 17025-aligned documentation into deployable templates for multi-site networks. Another opportunity area is workflow automation and software-led productivity that addresses skilled-labor constraints while meeting ALCOA+ expectations, pushing buyers toward integrated instrument-software-consumable ecosystems. Recent company actions reinforce this direction: Thermo Fisher Scientific introduced next-generation Orbitrap platforms at ASMS 2026, Waters launched new mobility-enabled MS systems, and Bruker advanced 4D proteomics performance, which are tied to demand for higher throughput and richer structural information per sample in biopharma and omics. Large-scale life science manufacturing investments also expand the installed base of regulated labs that typically require standardized chromatography, MS, spectroscopy, and PAT-adjacent analytics for development, tech transfer, and routine release testing, including Merck building a USD 3 billion Center of Excellence in Elkton, Virginia announced in October 2025, and AbbVie announcing an approximately USD 1.4 billion R&D and manufacturing facility commitment in April 2026.
Recent Industry Developments in Analytical Instrumentation In Life Science Market
- June 2026: Thermo Fisher Scientific unveiled the Orbitrap Tribrid Apex and Orbitrap Excedion mass spectrometers at ASMS 2026. The launch expands pharma and biotech workflows with next-gen MS platforms, strengthening downstream-processing and multi-omics capabilities; expands high-end MS leadership.
- June 2026: Bruker Corporation launched the timsMRMS system and announced a partnership with Integrated Protein Technologies for high-throughput sample prep. The timsMRMS enables rapid, high-resolution proteomics, enhancing throughput and ecosystem integration for proteomics workflows.
- June 2026: Waters Corporation launched the Xevo MRT P10 and Cyclic IMS P20 mass spectrometers. The next-gen MS with ion mobility enables analysis of complex samples, broadening Waters’ high-end MS portfolio with mobility-enabled platforms.
Analytical Instrumentation In Life Science Market Report Scope and Research Methodology
Market Definition and Coverage
This market covers the revenue generated from analytical instruments used in life sciences work, including research, development, quality control, and routine testing activities in pharma and biopharma settings.
Scope exclusions: We do not count general lab consumables, standalone reagents, or broad lab services that are not directly tied to analytical instrument sales value.
Segments Covered in This Report
- By Type of Product
- Chromatographs
- Gas Chromatographs (GC)
- Liquid Chromatographs (HPLC, UHPLC)
- Ion Chromatographs
- Spectrometer (Mass, Elemental Analysis and Molecular Analysis)
- Mass Spectrometry
- LC-MS
- GC-MS
- MALDI-TOF
- Elemental Analysis
- ICP-MS
- ICP-OES
- Molecular Analysis
- FT-IR
- Raman
- UV-Vis
- Mass Spectrometry
- Gas Analyzer
- Laser-Based Gas Analyzers
- Electrochemical Gas Analyzers
- Photoacoustic Gas Analyzers
- Liquid Analyzer
- pH/ORP Analyzers
- Dissolved Oxygen (DO) Analyzers
- Conductivity and Total Organic Carbon (TOC) Analyzers
- Analytical X-ray Instrumentation and Analytical Microscopes
- X-ray Diffraction (XRD)
- X-ray Fluorescence (XRF)
- Electron Microscopes (SEM, TEM)
- Atomic Force Microscopes (AFM)
- Chromatographs
- By End User Vertical
- Biopharmaceutical and Nutraceutical
- Biologics Manufacturers
- Nutraceutical Producers
- Pharmaceutical
- Active Pharmaceutical Ingredient (API) Manufacturers
- Contract Research and Manufacturing Organizations (CROs/CDMOs)
- Biopharmaceutical and Nutraceutical
- By Geography
- North America
- United States
- Canada
- Mexico
- Europe
- Germany
- United Kingdom
- France
- Nordics
- Rest of Europe
- South America
- Brazil
- Rest of South America
- Asia-Pacific
- China
- Japan
- India
- South-East Asia
- Rest of Asia-Pacific
- Middle East and Africa
- Middle East
- Gulf Cooperation Council Countries
- Turkey
- Rest of Middle East
- Africa
- South Africa
- Rest of Africa
- Middle East
- North America
Data Sources, Market Sizing, and Validation
Desk Research
Desk research started with building a clean view of the life sciences demand base and the installed lab footprint, so instrument demand could be tied to actual activity levels. Public sources such as the US FDA and EMA databases, the US NIH and OECD R&D statistics, and the World Bank macro series were used to understand funding, approvals, and lab activity trends that shape instrument purchasing cycles.
To convert activity into a sizing-ready model, we also reviewed sources such as UN Comtrade for trade flows of relevant instrument classes, USP and ICH guidelines for quality expectations, and peer-reviewed journals for method adoption patterns in chromatography, spectroscopy, and microscopy. Company filings, investor presentations, and trusted press were used to map product revenue mix and end-market exposure, and patent databases were used as a check on where innovation intensity is moving. Where needed, paid subscriptions covering company financials, news and financials, and patent databases were used to reduce gaps in financial splits and cross-check timelines. The desk research sources listed above are illustrative only, and many other public and paid sources were also referred to for data collection, validation, and clarification.
Primary Interviews and Surveys
Primary work was used to confirm which instruments are actually being bought in life sciences labs and what drives replacement versus expansion purchases. We spoke with a mix of instrument OEMs, distributors, lab procurement teams, and lab managers across key geographies so we could check pricing bands, utilization levels, and regulatory-driven upgrades, then use those inputs to tune assumptions. Feedback was also used to validate which end users are growing faster (for example, biopharma process analytics versus academic research) and to pressure-test the forecast drivers.
Distribution of primary research fieldwork respondents
| Company type | Respondent position | Region |
|---|---|---|
| Top tier: 29% | CXOs: 14% | APAC: 47% |
| Mid tier: 53% | Functional/Unit leaders: 27% | EMEA: 35% |
| Smaller Players: 18% | Managers: 59% | Americas: 18% |
Market-Sizing & Forecasting
The sizing model uses a top-down build that starts from life sciences lab activity and spending signals, then reconstructs instrument demand through penetration and replacement logic by major technology families used in regulated and research workflows. Once the demand pool was built, totals were corroborated with selective bottom-up checks such as sampled ASP x unit volumes for common systems, channel feedback on order momentum, and public revenue mix clues from suppliers, which were then used to adjust any overstatements.
Inputs tracked include R&D spending direction in pharma and biotech, the pace of drug and biologics approvals that pull testing volumes, method adoption for chromatography and mass spectrometry in QC and characterization, and procurement lead times that affect booking timing. We also used trade flow direction for relevant instrument categories as a reasonableness check, and then stress-tested assumptions on pricing progression and replacement cycles.
Forecasting was done using scenario analysis supported by multivariate regression where historical relationships were stable, followed by expert validation of the key drivers. When country level detail was thin, gaps were handled by proxying with lab intensity indicators and import trends, and then rechecked through interview feedback before totals were finalized.
Data Validation & Update Cycle
Validation was done through triangulation across desk signals, interview feedback, and cross-checks against independent metrics such as trade movement and reported life sciences spending direction. Outliers were investigated at the country and instrument family level, and assumptions were revisited when the variance could not be explained by timing, currency effects, or one-off buying cycles. Before sign-off, the model goes through a multi-step review where calculations, inputs, and logic are checked by another analyst and then tightened for internal consistency.
Reports are refreshed annually, and interim updates are made when material events shift demand, pricing, or supply availability. Before delivery, a fresh pass is completed to ensure the latest public releases and interview learnings are reflected in the final numbers.
Mordor Intelligence's Lifesciences Analytical Instrumentation Market Size Compared With Other Published Estimates
Published market sizes for analytical instrumentation in life sciences can vary because groups do not always count the same instrument families, end users, or revenue components, and some also anchor on different base years. Differences also show up when pricing is modeled with a simple inflation uplift versus being adjusted using real procurement feedback and product mix movement.
Import export movement for key instrument classes, reported R&D direction in pharma and biotech, and the pace of regulated testing needs are the checks that keep Mordor Intelligence's estimate tied to the life sciences instrument demand pool, instead of a wider lab equipment basket that can inflate totals.
Benchmark comparison
| Source | Market Size | Gaps in Research Methodology |
|---|---|---|
| Mordor Intelligence | USD 22.01 B (2026) | |
| Industry Publisher A | USD 28.60 B (2025) | Uses a broader life sciences definition that blends more end uses and a longer forecast window, and the base year choice shifts the reported level versus a 2026 starting point. |
| Trade Media B | USD 56.56 B (2024) | Appears to group life science instruments with a wider analytical instruments set and adjacent lab systems, which expands scope beyond the analytical instrument revenue counted in this study. |
The spread mainly comes from scope boundaries and base year selection, and then from how pricing and mix are carried through the forecast. By keeping the instrument set and end use boundary clear, and by rechecking with activity signals and interview inputs, the final total stays repeatable and easier to trace back to practical demand drivers.
Key Questions Answered in the Report
What is the current size of the analytical instrumentation in life science market?
The analytical instrumentation in life science market reached USD 22.01 billion in 2026 and is projected to expand to USD 31.72 billion by 2031.
Which region is growing the fastest?
Asia-Pacific is the fastest-growing region, posting a 9.03% CAGR through 2031 due to expanding CDMO capacity and government incentives.
Which product segment shows the highest growth?
Spectrometers, particularly high-resolution mass-spectrometry platforms, are forecast to grow at an 8.06% CAGR through 2031 as biologics characterization needs intensify.
Who are the leading companies in this market?
Thermo Fisher Scientific leads with 23% revenue share, followed by Agilent Technologies, Waters Corporation, Danaher, and Bruker.
How is regulation influencing instrument demand?
Stricter FDA and EMA guidance on continuous manufacturing and PAT drives real-time analytical adoption, boosting demand for in-line chromatography and mass-spectrometry systems.
What key challenge could slow market growth?
High capital expenditure and a shortage of skilled analytical chemists remain significant barriers, potentially curbing instrument deployment in resource-constrained settings.