
India Plastic Industry Size and Share
Market Overview
| Study Period | 2020 - 2031 |
|---|---|
| Forecast Data Period | 2026 - 2031 |
| Base Year Market Size (2025) | USD 44.28 Billion |
| Market Size (2026) | USD 47.04 Billion |
| Market Size (2031) | USD 63.69 Billion |
| Growth Rate (2026 - 2031) | 6.24 % |
| Market Concentration | Medium |
Major Players *Disclaimer: Major Players sorted in no particular order Image © Mordor Intelligence. Reuse requires attribution under CC BY 4.0. | |
India Plastic Industry Analysis by Mordor Intelligence
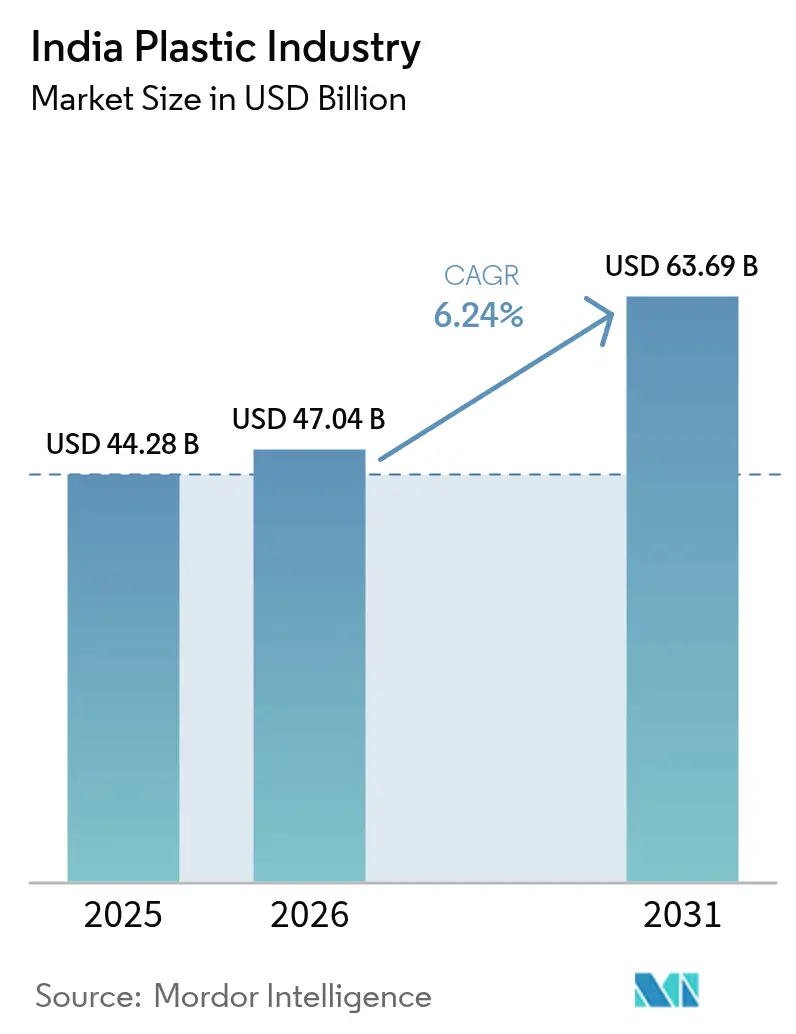
The India Plastic Industry size is projected to be USD 44.28 billion in 2025, USD 47.04 billion in 2026, and reach USD 63.69 billion by 2031, growing at a CAGR of 6.24% from 2026 to 2031. Strong public-sector incentives such as the Production-Linked Incentive scheme, large-scale infrastructure programs and accelerating consumer demand across packaging, construction and mobility are sustaining this double-digit trajectory. Western India remains the consumption epicenter, powered by Gujarat’s and Maharashtra’s dense petrochemical clusters, while specialty grades are gaining share as brands look for lightweighting and recyclability. Supply-side additions in polyolefins and PVC, amplified by recent brownfield and greenfield investments, are easing the country’s long-standing dependence on imports. Meanwhile, rising waste-management regulations, volatile feedstock costs and rapid adoption of digital production controls are shaping a sharper focus on operational efficiency and circularity.
Key Report Takeaways
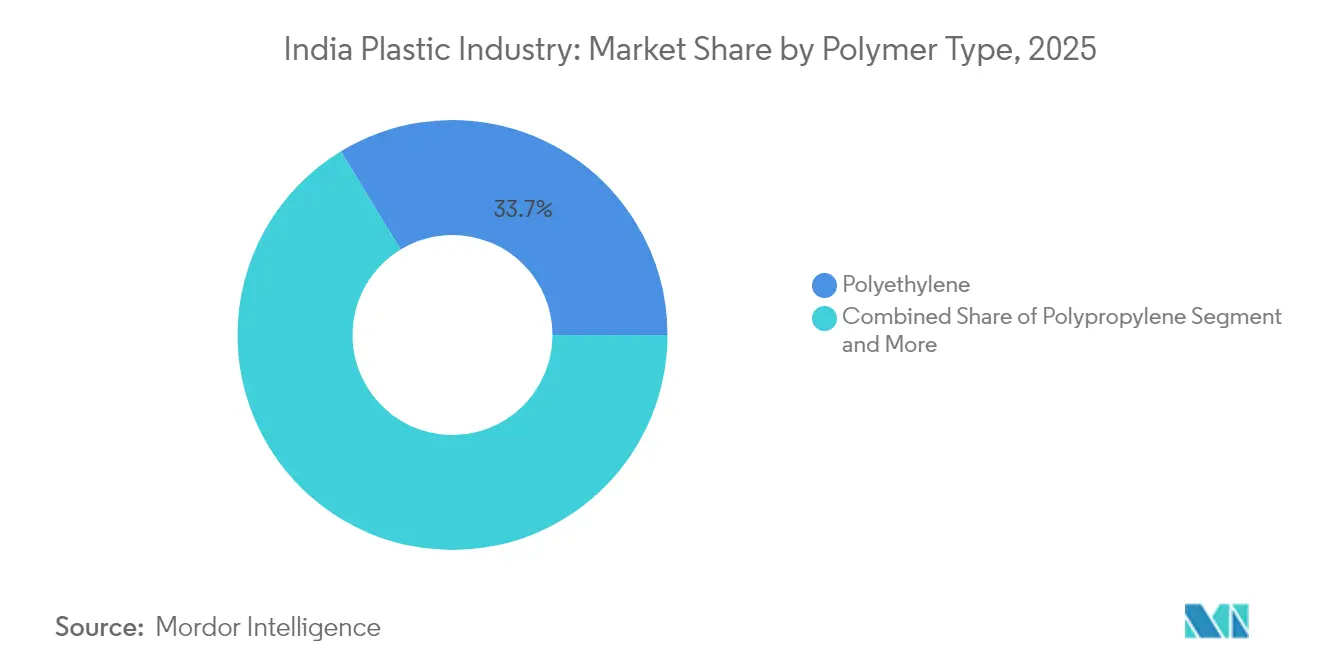
- By polymer type, polyethylene led with 33.68% of the India plastic industry market share in 2025; biodegradable/bio-plastics are projected to advance at a 6.82% CAGR to 2031.
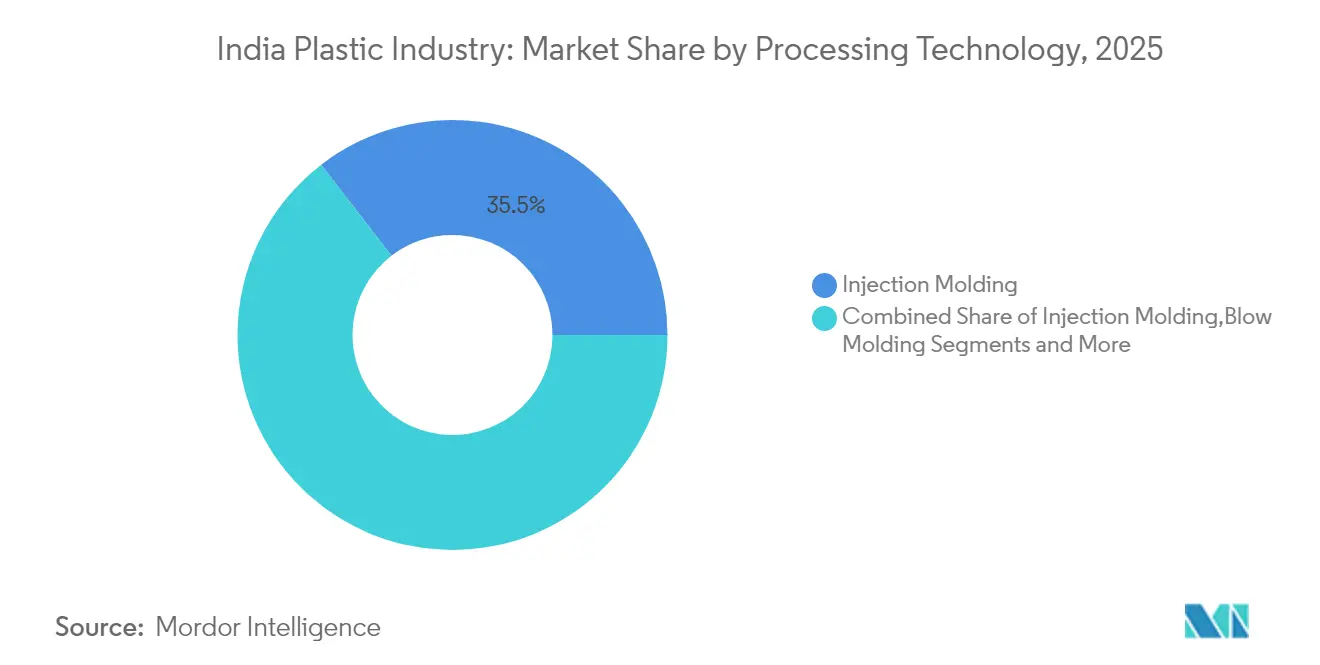
- By processing technology, injection molding commanded 35.45% share of the India plastic industry market size in 2025, while blow molding is poised for a 6.65% CAGR through 2031.
- By specialty and bioplastics type, the segment accounted for approximately USD 2.6–2.9 billion of the India plastics market size in 2025, with demand projected to grow at a 9.5–11.0% CAGR during 2025–2031.
- By application, packaging accounted for 41.62% of the India plastic industry market size in 2025 and is expanding at a 6.44% CAGR through 2031; healthcare and pharmaceuticals post the fastest segment CAGR at 6.56%.
- By region, Western India captured 46.55% revenue share in 2025; South India is forecast to grow at an 7.05% CAGR to 2031.
Note: Market size and forecast figures in this report are generated using Mordor Intelligence’s proprietary estimation framework, updated with the latest available data and insights as of 2026.
India Plastic Industry Trends and Insights
Drivers Impact Analysis*
| DRIVER | (~) % IMPACT ON CAGR FORECAST | GEOGRAPHIC RELEVANCE | IMPACT TIMELINE |
|---|---|---|---|
| Government PLI scheme catalyzing polymer capacity in Gujarat | +2.1% | Western India with nationwide spillovers | Medium term (2–4 years) |
| Quick-commerce demand for high-rigidity food containers | +1.7% | Tier-I urban centers | Short term (≤ 2 years) |
| Swachh Bharat Phase II spurring HDPE pipe upgrades | +1.4% | Water-stressed urban clusters | Medium term (2–4 years) |
| EV lightweighting pushing engineering plastics in two-wheelers | +1.2% | Western and Southern hubs | Medium term (2–4 years) |
| Pharma export surge lifting medical-grade resin offtake | +0.9% | Gujarat and Maharashtra | Short term (≤ 2 years) |
| Tier-II mall construction raising PVC profiles demand | +0.8% | Nationwide Tier-II cities | Medium term (2–4 years) |
| Source: Mordor Intelligence | |||
Government PLI Scheme Accelerating Polymer Capacity Expansions in Gujarat
Investment incentives under the PLI program are funneling unprecedented capital into Gujarat’s Jamnagar-Dahej petrochemical corridor. Projects such as Reliance Industries’ 1.5 MTPA PVC complex and Adani’s 2 MTPA PVC build-out are expected to narrow the 2.5 million-tonne local supply gap by 2027.[1]Manufacturing Today India, “Adani Group Resumes USD 4 Billion PVC Plant Project for 2026 Completion,” manufacturingtodayindia.com Alongside output gains, firms are deploying chemical-recycling technologies that convert mixed plastic waste into ISCC-Plus certified resins, positioning Gujarat as a regional circular-economy hub. Allied logistics upgrades, including dedicated polymer rail corridors, further strengthen the material flow from western coast ports to inland processors.
Quick-Commerce Boom Driving Demand for High-Rigidity Food Containers
Same-hour grocery delivery is reshaping rigid packaging specifications. Operators require containers that resist impact, maintain barrier integrity under rapid temperature swings and stack efficiently in micro-fulfilment centers. Injection-grade polypropylene and clarified random copolymers dominate current supply, but brand owners are piloting mono-material designs to comply with 2026 recyclability targets. Major rigid packaging converters have announced capacity additions in Maharashtra and Telangana to address forecast container demand growth above 15% annually.[2]Syed Ali, “Packaging Plastic Waste from E-commerce Sector,” ScienceDirect, sciencedirect.com
Swachh Bharat Phase II Fueling Urban HDPE Pipe Replacement
Municipal water boards are mandating corrosion-resistant HDPE piping for new sewerage lines and rehabilitation projects. Standard-dimension ratio (SDR) 11 and SDR 17 grades are preferred, given their strength-to-weight balance and leak-free butt-fusion joints. Pipe makers are ramping three-layer co-extrusion lines that embed recycled polymer in the middle layer while keeping virgin HDPE on outer surfaces to satisfy both cost and quality metrics. With 500+ towns set for upgrades by 2028, domestic pipe demand is forecast to exceed 1.2 million tonnes per year.[3]Central Pollution Control Board, “Standard Operating Procedure for Assessment & Characterization of Plastic Waste,” cpcb. nic. in
EV Lightweighting Strategy Boosting Engineering Plastics in Two-Wheelers
Electric scooter OEMs target a vehicle kerb-weight ceiling of 110 kg to meet customer range expectations. Glass-fiber-reinforced polypropylene, PA6/66 and PC-ABS blends now replace stamped steel in battery enclosures, side panels and subframes. Partnership models between resin suppliers and Tier-1 molders speed application development; cycle times of under 35 seconds are being achieved on multi-cavity molds outfitted with servo-electric drives. Southern clusters around Hosur and Krishnagiri host several of these dedicated engineering-plastic lines.
Restraints Impact Analysis*
| RESTRAINTS | (~) % IMPACT ON CAGR FORECAST | GEOGRAPHIC RELEVANCE | IMPACT TIMELINE |
|---|---|---|---|
| Single-Use Plastic Ban Escalating Compliance Costs for FMCG Packagers | -1.3% | Nationwide, with higher impact in urban centers | Short term (≤ 2 years) |
| Volatile Naphtha Feedstock Prices from Middle-East Tensions | -1.1% | Nationwide, with concentrated impact on manufacturing hubs | Short term (≤ 2 years) |
| Inter-State Waste Rules Causing Logistic Bottlenecks and Capacity Under-Utilization | -0.8% | Cross-state borders, particularly affecting recycling supply chains | Medium term (2-4 years) |
| Consumer Backlash on Microplastics in Packaged Drinking Water | -0.6% | Urban centers, particularly among higher-income demographics | Medium term (2-4 years) |
| Source: Mordor Intelligence | |||
Single-Use Plastic Ban Escalating Compliance Costs for FMCG Packagers
Ban enforcement has removed 19 disposable items from legal circulation, forcing brands to pivot toward paper laminates, biodegradable films or thicker reusable formats. Substitute materials cost at least 40% more than legacy LDPE flexibles, squeezing price-sensitive categories such as condiments and on-the-go beverages. Smaller converters report capital-expenditure hurdles in retrofitting extrusion-coating and lamination lines for alternative substrates.
Volatile Naphtha Feedstock Prices from Middle-East Tensions
Spot naphtha jumped 28% between April 2024 and March 2025, eroding ethylene cracker margins. To hedge exposure, Haldia Petrochemicals inked a decade-long supply deal with QatarEnergy for up to 2 million tonnes annually [economictimes.com]. Several producers are evaluating propane dehydrogenation and ethane imports as diversification strategies, but port constraints and refrigerant limitations temper near-term relief.
*Our forecasts treat driver/restraint impacts as directional, not additive. The impact forecasts reflect baseline growth, mix effects, and variable interactions.
Segment Analysis
By Polymer Type: Polyethylene Dominates Amid Bio-Shift
Polyethylene retained a 33.68% slice of the India plastic industry market in 2025, anchored by film and blow-molded container demand. High-density grades grew faster than low-density grades owing to pipe, cap and closure applications. The India plastic industry market size for biodegradable/bio-plastics is projected to widen at a 6.82% CAGR, as brands adopt PLA, PBS and PHA blends in serviceware and personal-care packaging. Polypropylene remains intrinsic to woven sacks, appliance housings and automotive trim, while PVC’s future hinges on the timely start-up of domestic chlor-alkali expansions.
Circularity gains momentum through mechanical and chemical recycling. India’s PET bottle stream already touches a 95% recovery rate, supported by well-organized informal collection networks. New depolymerization ventures in Gujarat intend to close the loop on polyester textiles, signalling a shift from export-oriented bottle flakes toward domestic resin circularity.


By Specialty and Bioplastics Type: Sustainability Drives Innovation
Biodegradable grades capture most venture attention, yet bio-based drop-in resins such as bio-PE and bio-PET are scaling faster in beverage and personal-care lines because they slot into existing molds without process change. Local compounders are experimenting with lignin-filled PLA and starch-grafted PBAT to cut cost premiums below 70% versus fossil-based equivalents. Certification schemes under the India Plastics Pact require 50% recycled content or biogenic feedstock in rigid packaging by 2030, pushing brand owners to lock in forward supply contracts.
Pilot‐scale projects in Karnataka and Tamil Nadu demonstrate enzymatic recycling of multilayer films into feedstock monomers. Although volumes remain small, successful commercialization would open pathways to recover up to 2 million tonnes of composite waste annually, mitigating landfill pressure.
By Processing Technology: Injection Molding Leads Transformation
Injection molding represented 35.45% of installed processing capacity in 2025, driven by automotive, appliance and consumer-goods tooling. High-cavitation machines above 450 tons are increasingly fitted with all-electric clamping systems that trim energy use by 20% and meet OEM sustainability scorecards. Blow molding grew at 6.65% CAGR on the back of single-serve beverage bottles and household cleaners. The India plastic industry market share for injection-molded parts will hold steady around one-third through 2031, while blow molding gains incremental points in personal-care and pharmaceutical packaging.
Extrusion lines for pipe and film benefit from multi-layer die heads that integrate recycled pellets in core layers without sacrificing outer surface aesthetics. Thermoforming, rotational molding and compression molding together form a niche but resilient 10% slice of capacity, serving ice-cream tubs, water tanks and melamine tableware respectively. Additive manufacturing shows promise for custom orthopedic devices and low-volume aerospace ducts, though material qualification remains a hurdle.
By Application: Packaging Dominates Amid Healthcare Surge
Packaging consumed 41.62% of polymer demand in 2025, equivalent to nearly 10 million tonnes. Rigorous e-commerce speed requirements elevate impact-resistant PP copolymers and clear PET. Flexible multilayer pouches still dominate salty snacks and confectionery, but mono-material PE-PE laminates grow fast as converters test EVOH-free oxygen barriers.
Healthcare uses absorb around 1 million tonnes of high-purity resins, rising at 6.56% CAGR to 2031. Syringe barrels, IV bags and diagnostic housings increasingly specify cyclic olefin copolymers and radiation-sterilizable PP. Construction remains PVC-heavy, while automotive embraces glass-filled PA and PC-ABS for weight savings. Electrical/electronics demand tracks upward with domestic television and refrigerator output.
Geography Analysis
Western India, anchored by Gujarat and Maharashtra, held 46.55% of polymer consumption in 2025, reflecting the co-location of refineries, crackers and downstream processors. The India plastic industry market size for this region is forecast to reach USD 30.55 billion by 2031 at a 6.79% CAGR, bolstered by coastal logistics and duty-free feedstock zones. Proximity to raw materials shortens pipeline supply chains and lowers conversion costs, allowing processors to price competitively in export bids.
South India follows as the fastest growing geography, projected to expand at an 7.05% CAGR through 2031. States such as Tamil Nadu, Telangana and Karnataka attract investment in engineering plastics, medical devices and electronics assembly, underpinning resin uptake. SEZ incentives around Chennai and Krishnagiri further boost the region’s pull for auto-component molders and EV start-ups.
North and East India record moderate but steady growth. Uttar Pradesh’s smart-city programs and Bihar’s irrigation upgrades maintain demand for PVC and HDPE pipe, while Odisha’s emerging petrochemical complex at Paradip may shift feedstock availability eastward, closing logistic gaps for processors in Kolkata’s hinterland. Across rural belts, micro-irrigation and affordable housing continue to generate baseline consumption, tempering regional volatility.
Regulatory Landscape
India's plastics and petrochemicals policy environment is shaped by the Department of Chemicals and Petrochemicals (Ministry of Chemicals and Fertilizers) through sector schemes and by environmental rules administered under the Environment (Protection) Act, 1986. Plastic Waste Management Rules, 2016 (as amended, including the 2024 amendment notified in the Gazette as G.S.R. 201(E) dated March 14, 2024) keep tightening waste handling, EPR-linked obligations, and specifications for packaging and recovered plastics.
On product quality and conformance, the Bureau of Indian Standards (BIS) is expanding mandatory compliance via Quality Control Orders (QCOs) for select polymers and plastic products, and by updating Indian Standards, for example IS 9738:2025 for polyethylene bags for general purposes. In parallel, the Department of Chemicals and Petrochemicals runs the Plastic Park Scheme to consolidate downstream processing clusters, with government grant support for common infrastructure capped at 50% of project cost (subject to a ceiling of INR 40 crore), aimed at improving compliance readiness, testing access, and scale-up for SMEs.
Value Chain Analysis
The India plastics value chain runs from upstream feedstocks (naphtha and gas-based crackers and aromatics) to polymerization (polyolefins, PVC, PET intermediates), compounding, and then to a highly fragmented conversion base across injection molding, blow molding, and extrusion. Western India (Gujarat and Maharashtra) anchors much of the upstream and midstream activity, and acts as a distribution springboard for inland processors through coastal logistics, ports, and rail-linked corridors, while end-use pull is concentrated in packaging, construction (PVC and HDPE pipes), mobility (engineering plastics), and healthcare-grade applications.
Circularity and compliance are increasingly built into core value-chain steps rather than treated as add-ons. In March 2026, the Plastic Waste Management (Amendment) Rules, 2026 (G.S.R. 237(E)) formalized minimum recycled-content obligations and reuse targets for rigid packaging, with controlled flexibility through carry-forward provisions for early-year shortfalls. This lifts the strategic role of organized recyclers, testing labs, and traceability systems in resin sourcing. The same period also highlighted operational fragility when polymer price spikes disrupted processing economics in parts of the country, reinforcing the importance of feedstock hedging, domestic capacity additions, and steady access to compliant recycled material, including BIS-aligned requirements such as IS 14534:2023 for recycled plastics used in products.
Competitive Landscape
Upstream supply is moderately consolidated. Reliance Industries, GAIL and Indian Oil collectively own about 55% of domestic polyolefin nameplate capacity. Reliance also pioneers chemical recycling, launching CircuRepol™ and CircuRelene branded resins certified by ISCC-Plus [indianchemicalnews.com]. Midstream PVC capacity is poised for shake-up as Adani’s 2 MTPA Mundra complex starts phasing in from 2026, while Reliance readies a 1.5 MTPA dual-site expansion.
Downstream conversion remains fragmented with over 30,000 mostly micro-small units. Supreme Industries leads organized pipe systems and is investing INR 11 billion to push annual capacity beyond 1 million tonnes by FY 2026 [tickertape.in]. Time Technoplast is scaling composite cylinder output and intermediate bulk containers to tap medium-haul logistics growth. Digitalisation differentiates larger processors; industry leaders report 95% forecast accuracy from AI-driven pricing and inventory models.
Entry barriers in specialty bio-resins and high-modulus engineering compounds are rising due to proprietary technology and certification costs. Global players entering with local partners—such as Loop Industries with Ester Industries—highlight collaboration as a pathway to scale novel chemistries under India’s cost constraints.
India Plastic Market Leaders
Reliance Industries Ltd
Indian Oil Corporation Ltd
GAIL (India) Ltd
Supreme Industries Ltd
Nilkamal Ltd
- *Disclaimer: Major Players sorted in no particular order


Market Opportunities and Future Outlook
Mandatory recycled-content and reuse targets under the Plastic Waste Management (Amendment) Rules, 2026 are narrowing the gap between demand and supply for food-grade, traceable recycled polymers, particularly for packaging where converters need consistent quality, certification, and reliable bale-to-pellet inputs. Investments also provide concrete scaling signals: Srichakra Polyplast announced an INR 425 crore program to expand food-grade rPET capacity (from 90,000 tonnes to more than 113,000 tonnes by 2026), while Rajshree Polypack commissioned additional injection molding and sleeving capacity to support high-throughput food and beverage packaging.
On the virgin-resin side, import substitution in PVC and CPVC remains a near-term whitespace linked to construction and infrastructure demand, with named projects moving from intent to execution. Examples include Lubrizol partnering with Grasim Industries for an integrated CPVC resin facility at Vilayat, Gujarat (100,000 tonnes; part of a USD 150 million investment), alongside large domestic PVC capacity builds referenced by Reliance Industries and Adani to address the structural domestic supply gap. These moves also expand adjacent opportunities in compounding, stabilizers and additives, testing and certification services, and downstream fabrication (pipes, profiles, and fittings) that must meet evolving BIS/QCO and packaging compliance requirements.
Recent Industry Developments
- February 2026: GAIL (India) Ltd commissioned a 60 KTPA polypropylene unit at its Pata Petrochemical Complex in Uttar Pradesh. The start-up adds incremental domestic PP supply for injection molding and packaging applications and strengthens GAIL's downstream integration at an established petrochemical site.
- April 2025: Indian Oil Corporation Ltd signed an MoU with the Government of Odisha to invest INR 61,077 crore in a mega petrochemical complex at Paradip, including a 1.5 MMTPA dual-feed naphtha cracker. The project deepens east-coast petrochemical integration and improves regional resin availability for processors that currently depend heavily on long-haul supply and imports.
- August 2024: Reliance Industries Ltd confirmed plans for integrated PVC and CPVC facilities at Dahej and Nagothane with targeted commissioning in 2026-27. The build-out targets import substitution in a deficit segment and supports downstream growth in pipes, profiles, and construction-related applications.


Research Methodology Framework and Report Scope
Market Definition and Coverage
For this study, the India plastic industry market is defined as the total value of plastics sold in India across common polymer families and the main conversion routes, counted where final demand is created across end-use activities.
Scope exclusions: The sizing excludes recycling and waste-management service revenues and any non-plastic substitute materials sold outside the plastics value chain.
Segmentation Overview
- By Polymer Type
- Polyethylene (LDPE, LLDPE, HDPE)
- Polypropylene
- Polyvinyl Chloride
- Polyethylene Terephthalate (PET)
- Polystyrene and EPS
- Acrylonitrile Butadiene Styrene (ABS)
- Polycarbonate
- Others (PMMA, POM, etc.)
- By Specialty and Bioplastics Type
- Biodegradable Bioplastics (PLA, PHA, Starch Blends)
- Bio-Based Non-Biodegradable Plastics (Bio-PE, Bio-PET)
- By Processing Technology
- Injection Molding
- Blow Molding
- Extrusion
- Thermoforming
- Rotational Molding
- Compression Molding
- Additive Manufacturing (3D Printing)
- By Application
- Packaging
- Rigid Packaging
- Flexible Packaging
- Building and Construction
- Automotive and Transportation
- Electrical and Electronics
- Agriculture and Irrigation
- Healthcare and Pharmaceuticals
- Consumer Goods and Housewares
- Furniture and Bedding
- Others (Textiles, Sports and Leisure)
- Packaging
- By Region (India)
- West India (Gujarat, Maharashtra, Goa)
- North India (Delhi-NCR, Uttar Pradesh, Punjab, Haryana, Rajasthan)
- South India (Tamil Nadu, Karnataka, Telangana, Andhra Pradesh, Kerala)
- East and North-East India (West Bengal, Odisha, Bihar, Assam and NE States)
Data Sources, Market Sizing, and Validation
Desk Research
Desk research was used to map India demand patterns, conversion capacity signals, and trade movements, then to set realistic guardrails on pricing and volume assumptions. Sources we leaned on include official government statistics and releases such as the Ministry of Chemicals and Fertilizers (Department of Chemicals and Petrochemicals), the Ministry of Commerce and Industry trade data, and national standards and policy notes that affect plastic usage and compliance.
To keep the model grounded in practical market signals, we also reviewed trade-body publications, including plastics export promotion councils, customs and port updates for import and export mix, and peer-reviewed journals that track polymer and processing trends. Company annual reports, investor presentations, and credible press were used to understand capacity additions, utilization commentary, and end-market demand sentiment. For cross-checking financial splits and patent activity, we selectively used paid database subscriptions for company financials, news and financials, patent databases, plastics and polymers pricing references, and shipment-level import and export data. The sources listed here are illustrative only, and many other public references were also checked for data collection, validation, and clarification.
Primary Interviews and Surveys
Primary interviews and surveys were used to convert general indicators into usable sizing inputs, with a focus on India-specific conversion economics and application demand splits. We spoke with polymer producers, converters, distributors, and large buying functions across packaging, construction, automotive, and electrical uses. Their inputs were used to confirm assumptions on utilization, average pricing logic, and mix shifts by processing route.
Distribution of primary research fieldwork respondents
| Company type | Respondent position |
|---|---|
| Top tier: 33% | CXOs: 14% |
| Mid tier: 53% | Functional/Unit leaders: 41% |
| Smaller Players: 14% | Managers: 45% |
Market-Sizing & Forecasting
The model starts with a top-down build where India polymer and plastic conversion demand is reconstructed from application-level demand pools, trade flows, and conversion capacity and utilization signals, and then translated into market value using consistent price and mix logic. After that, totals are checked using selective bottom-up approximations, such as sampled converter throughput times typical realized pricing by polymer family and distributor channel checks on volume movement, so the final value does not depend on any single data stream.
Key inputs used (illustrative) include polymer price trends for major resins, import dependence and export intensity by broad plastic product groups, capacity additions and utilization commentary from industry disclosures, downstream demand indicators from packaging, construction, and automotive activity, and shifts in processing mix across extrusion, injection molding, and blow molding. Where bottom-up checks had gaps, missing pieces were handled using conservative mix proxies anchored to capacity share and trade intensity, and then re-tested with primary feedback.
Forecasts were developed using scenario analysis, starting with a base case that links resin pricing and demand growth to macro and end-use indicators, followed by sensitivity cases for faster packaging growth or slower construction cycles. Assumptions on mix changes and price progression were reviewed with industry respondents so the forward path stays realistic even when short-term prices are volatile.
Data Validation & Update Cycle
Validation is done in layers so the final numbers stay consistent with real market signals. We triangulate the market value against independent indicators such as trade values, resin price bands, and conversion capacity utilization. If the market value diverges from any of these signposts, we investigate the driver until the cause is clear, for example a temporary export spike or a one-time price jump.
Before sign-off, the work is reviewed through multiple analyst checks, including variance checks versus prior editions and consistency tests across applications and processing routes. Reports are refreshed annually, and interim updates are triggered when material events occur, such as major capacity announcements, policy shifts affecting plastic use, or sharp moves in feedstock pricing. Right before delivery, a fresh pass is done so clients receive an updated view based on the latest available public and primary inputs.
Mordor Intelligence's India Analysis of Plastic Market Size Versus Other Published Estimates
Published market sizes for the India plastic industry can look different because each publisher defines scope differently and also uses a different price basis and timing. In plastics, resin price swings and product-mix shifts can change value even when tonnage is broadly stable.
The main gap comes from how each publisher treats plastics exports, and Mordor Intelligence uses exports mainly as a cross-check on demand strength and product mix while counting the full India plastic industry value across polymer types, processing technologies, and applications.
Benchmark comparison
| Source | Market Size | Gaps in Research Methodology |
|---|---|---|
| Mordor Intelligence | USD 44.28 B (2025) | |
| Industry Promotion Body A | USD 26.61 B (2025) | This figure is presented as an overall industry value in a narrative that also mixes in export reporting, and it is not clearly tied to full coverage across polymer families, processing routes, and applications, which can understate domestic conversion demand. |
| Industry Promotion Body B | USD 12.50 B (2025) | This number reflects plastics export value for a fiscal year, so it measures only cross-border sales and excludes domestic consumption across packaging, construction, automotive, and other uses. |
The spread in the table is largely explained by whether the estimate measures exports, a partial industry view, or the full domestic plastics value across applications. By keeping scope, currency timing, and price-mix logic explicit, the resulting market size stays traceable to clear inputs and can be reproduced and updated without hidden adjustments.


Key Questions Answered in the Report
What is the current size of the India plastic industry?
The market is worth USD 47.04 billion in 2026 and is projected to hit USD 63.69 billion by 2031.
Which segment holds the largest India plastic industry share?
Packaging leads with 41.62% share in 2025, driven by e-commerce and food-service growth.
How fast are biodegradable plastics growing in India?
Biodegradable and bio-based plastics are expanding at a 6.82% CAGR through 2031.
Which region in India consumes the most plastic?
Western India accounts for 46.55% of national consumption, anchored by Gujarat and Maharashtra.
What is driving investment in domestic PVC capacity?
A persistent supply deficit of 2.5 million tonnes per year is prompting large-scale projects by Reliance and Adani.
How are feedstock price swings affecting manufacturers?
Volatile naphtha prices compress margins, leading firms to secure long-term contracts and explore alternative feedstocks such as propane and ethane. Continue Research
Page last updated on:


 Your data is secure and never sold or shared.


