
Mexico Fruits And Vegetables Market Analysis by Mordor Intelligence
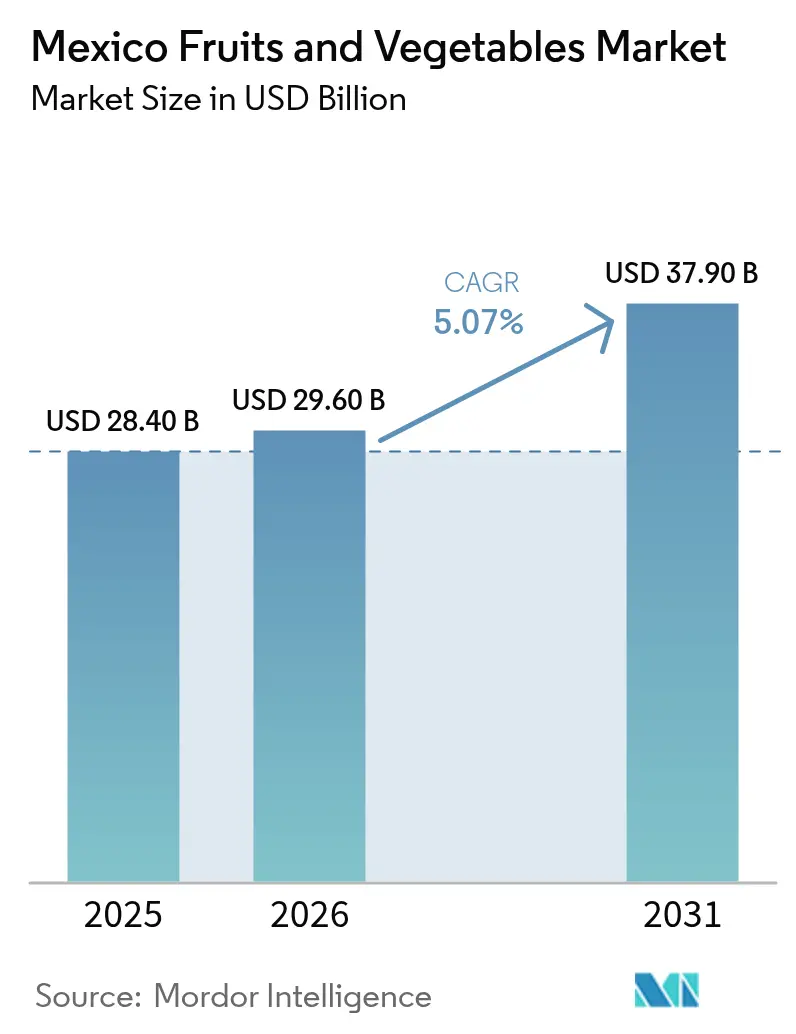
The Mexico fruits and vegetables market size is projected to expand from USD 28.4 billion in 2025 and USD 29.6 billion in 2026 to USD 37.9 billion by 2031, registering a 5.07% CAGR between 2026 and 2031. Liberalized trade under the United States–Mexico–Canada Agreement has made Mexico the principal winter-window supplier to North American retailers, creating stronger price signals for greenhouse tomatoes, bell peppers, and cucumbers. Simultaneously, domestic shoppers are buying more washed and cut vegetables along with premium berries, a shift that channels capital toward high-tech packing houses near large cities. Export-led berry plantings in Jalisco and Michoacán are growing 4 times faster than acreage for domestic staples, and cold-chain start-ups are compressing post-harvest losses to 19%, thereby raising delivered quality and extending shelf life. Competitive intensity remains low with the top five players accounting for a limited share of Mexico fruits and vegetables market size, leaving mid-tier cooperatives and technology-oriented newcomers room to scale through crop specialization and automation.
Key Report Takeaways
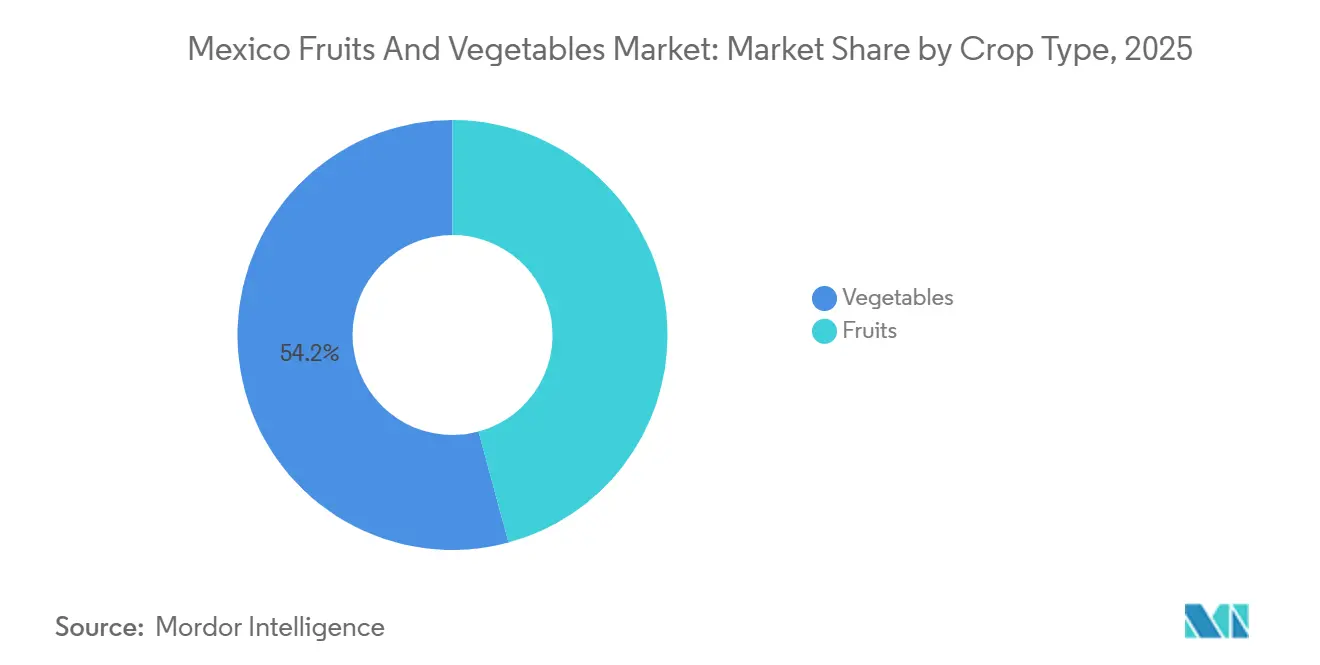
- By crop type, vegetables led with 54.2% of Mexico fruits and vegetables market share in 2025, while fruits are forecast to post the fastest growth at a 6.0% CAGR through 2031.
Note: Market size and forecast figures in this report are generated using Mordor Intelligence’s proprietary estimation framework, updated with the latest available data and insights as of 2026.
Mexico Fruits And Vegetables Market Trends and Insights
Drivers Impact Analysis*
| Driver | (~) % Impact on CAGR Forecast | Geographic Relevance | Impact Timeline |
|---|---|---|---|
| Rising United States import demand post-United States-Mexico-Canada Agreement (USMCA) | +1.2% | Sinaloa, Sonora, Baja California, Jalisco, and Michoacán | Medium term (2–4 years) |
| Expansion of greenhouse/protected cultivation acreage | +1.0% | Bajío, Northwest, and Zacatecas | Long term (≥ 4 years) |
| Government production-linked subsidies and social-program purchases | +0.7% | Oaxaca, Chiapas, and Puebla | Short term (≤ 2 years) |
| Cold-chain logistics start-ups lowering post-harvest losses | +0.5% | Export corridors to Nogales, and Laredo, McAllen | Medium term (2–4 years) |
| Export-oriented berry acreage boom | +0.9% | Jalisco, Michoacan, and Baja California | Medium term (2–4 years) |
| Niche growth of organic banana clusters in Chiapas and Tabasco | +0.3% | Chiapas and Tabasco | Long term (≥ 4 years) |
| Source: Mordor Intelligence | |||
Rising United States Import Demand Post-United States–Mexico–Canada Agreement (USMCA)
While the United States–Mexico–Canada Agreement (USMCA) maintained duty-free access under the North American Free Trade Agreement (NAFTA), Mexican horticultural imports accounted for 34% of U.S. agricultural imports from Mexico in 2024, underlining the Mexico fruits and vegetables market’s reliance on cross-border demand. The 25% universal tariff imposed in early 2025, along with the end of the Tomato Suspension Agreement, has disrupted these trade flows [1]Source: USDA Economic Research Service, “U.S.–Mexico Fruit and Vegetable Trade 2025,” ers.usda.gov. In 2025, from November to April, Mexican growers supply 90% of U.S. fresh tomato imports, so any tariff shock quickly ripples through the Mexico fruits and vegetables market’s winter-window revenue. The July 2025 termination of the Tomato Suspension Agreement and a 17.09% anti-dumping duty have reduced seasonal pricing leverage, leading to a 25% drop in 2026 plantings in regions like Sinaloa. Rules-of-origin clauses preferentially treat Mexican produce over Central American re-exports, steering North American retailers toward direct contracts. Trade policy certainty is therefore catalyzing greenhouse investment and reshaping regional cropping patterns, with long-run implications for the Mexico fruits and vegetables market’s capacity mix.
Expansion of Greenhouse and Protected Cultivation Acreage
By 2025, Mexico's protected agriculture sector is set to reach nearly 78,000 hectares, with the Bajío region and states like Sinaloa and Jalisco as key hubs for this USD 8 billion industry [2]Source: Servicio de Información Agroalimentaria y Pesquera, “Mexico Agricultural Production Statistics 2025,” gob.mx, a footprint that directly enlarges the Mexico fruits and vegetables market. Netafim precision irrigation enables high-tech greenhouses to produce 250-600 metric tons of tomatoes per hectare, a 6- to 10-fold increase over traditional open-field yields of 37-75 metric tons. The adoption of Netafim precision irrigation systems in advanced greenhouses plays a critical role in the Mexican fruit and vegetable market's efforts to address climate variability and sustain its position as the world's seventh-largest agricultural exporter. Israeli irrigation suppliers and Dutch climate-control firms are partnering with Mexican cooperatives to install sensor networks that adjust fertigation in real time. Year-round output smooths pack-house utilization, reducing idle months and stabilizing labor demand, which ultimately supports supply consistency inside the Mexico fruits and vegetables market. The resulting margin lift encourages smaller growers to lease land to greenhouse operators, gradually bifurcating the supply base while expanding total marketable volume.
Government Production-Linked Subsidies and Social-Program Purchases
In 2025, the Agriculture and Rural Development Secretariat (SADER) launched the Fertilizers for Wellbeing program, allocating 23.8% of its MXN 74.5 billion (USD 4.32 billion) budget to distribute 1 million tons of free fertilizer to over 2 million smallholders across 3.3 million hectares, bolstering cost structures within the Mexico fruits and vegetables market. Food-bank procurement under Sembrando Vida absorbed 340,000 metric tons of produce, granting growers a reliable off-take at administered prices. These transfers shield ejido cooperatives in Oaxaca and Chiapas from commodity price swings, allowing them to continue planting during downturns. Traceability clauses tied to subsidies push small farms toward formal record-keeping, which serves as a stepping stone toward export certification and wider market access. Critics fear that blanket incentives may induce overproduction of low-value crops, yet political momentum makes program rollback unlikely before 2031, suggesting continued government influence on market supply dynamics.
Export-Oriented Berry Acreage Boom
Between 2020 and 2025, Mexican berry acreage stabilized at 48,000 to 50,000 hectares as the industry adopted high-yield genetics, maintaining a sizable fruit platform inside the Mexico fruits and vegetables market. Blueberries and raspberries drove growth, with raspberry planted area reaching 11,220 hectares in 2025 [3]Source: USDA Foreign Agricultural Service, “Mexico Fresh Fruit and Vegetable Annual Report 2025,” fas.usda.gov. Jalisco alone planted 7,200 new hectares, financed by retailer contracts that guarantee USD 8.50 per kilogram for certified organic fruit. International buyers are seeking to diversify away from drought-stricken California, so high-altitude Michoacán orchards that require less irrigation are attracting capital. Multi-year agreements from Driscoll’s and Hortifrut de-risk the three-year maturation lag for blueberry bushes, spurring rapid conversion of vegetable plots. Overlapping harvest windows for blueberries and raspberries have tightened seasonal labor, pushing wages 40% higher and accelerating interest in mechanized pickers that help sustain export reliability, a critical pillar of the Mexico fruits and vegetables market.
Restraints Impact Analysis*
| Restraint | (~) % Impact on CAGR Forecast | Geographic Relevance | Impact Timeline |
|---|---|---|---|
| Farm-labor shortages and rising rural wages | -0.8% | Sinaloa, Sonora, and Jalisco | Short term (≤ 2 years) |
| Climate volatility prolonged droughts and hurricanes | -0.6% | Northwest and Pacific Coast | Medium term (2–4 years) |
| Strong peso compressing exporter margins | -0.5% | Sinaloa, Michoacan, Jalisco, and Baja California | Short term (≤ 2 years) |
| Tomato Brown Rugose Fruit Virus recurrence in Sonora and Sinaloa | -0.3% | Sonora and Sinaloa greenhouses | Medium term (2–4 years) |
| Source: Mordor Intelligence | |||
Climate Volatility, Droughts, and Hurricanes
Severe drought in Sinaloa during 2024 reduced reservoir levels to as low as 3% by mid-year, cutting 2025 vegetable production forecasts by 3% and driving a shift to protected agriculture to counter open-field yield losses that threaten overall supply for the Mexico fruits and vegetables market. After Hurricane Otis in 2023 damaged over 20,000 hectares of crops in Guerrero, Mexican growers are adopting drought-tolerant agave as an alternative to traditional staples. However, the high costs of climate-adaptive infrastructure, such as wind-resistant systems, remain a challenge for small-scale farmers. Mexico's sovereign parametric insurance program, scaled from a 10,000-farmer pilot, aims to cover 200,000 smallholders by 2026. Despite premiums of 4.5% of insured value, its automated payouts for rainfall and wind events are narrowing the climate protection gap. Climatic extremes, therefore, introduce revenue volatility that can deter long-term investment, constraining capacity expansion in the Mexico fruits and vegetables market.
Strong Peso Compressing Exporter Margins
Between January 2025 and early 2026, the Mexican peso appreciated from 20.59 to 17.20 per U.S. dollar, reducing peso-denominated receipts for agricultural exporters by narrowing the currency conversion margin, a direct profitability squeeze on the Mexico fruits and vegetables market’s export segment. A metric ton of tomatoes that sold for MXN 20,160 (USD 1,167.81) in 2025, down from MXN 21,840 (USD 1,265.12) two years earlier. While dollar-denominated debt costs declined, most growers pay wages and inputs in pesos, so net margins narrow. Hedging tools such as forward contracts remain inaccessible to small cooperatives unfamiliar with derivatives markets. Persistent strength in the peso could accelerate a shift toward organic or specialty crops that command foreign-currency premiums, partially offsetting margin pressure but also reshaping product mix in the Mexico fruits and vegetables market.
*Our forecasts treat driver/restraint impacts as directional, not additive. The impact forecasts reflect baseline growth, mix effects, and variable interactions.
Segment Analysis
By Crop Type: Diverging Momentum Between Vegetables and Berries
Vegetables led Mexico fruits and vegetables market share with 54.2% in 2025, owing to year-round greenhouse output of tomatoes, bell peppers, and cucumbers. In contrast, fruits are the fastest-growing segment, advancing at a 6.0% CAGR to 2031 on the strength of blueberry and raspberry plantings in Jalisco and Michoacán. Robust U.S. demand during winter months sustains premium pricing for greenhouse vegetables, while multi-year retailer contracts lock in volume for organic berries. Together, these dynamics show how protected cultivation and export agreements shape both the dominant share leader and the highest-growth category.
Tomatoes continue to dominate individual crop rankings but face compliance costs tied to Tomato Brown Rugose Fruit Virus testing, which erode margins for open-field growers. Bell peppers and cucumbers benefit from lighter trade scrutiny, and their mini-cucumber niche is expanding in organic aisles across the United States. Avocado exports remain sizable but are growing only 2.1% annually because land and security constraints slow new orchard development in Michoacán. Persian limes from Veracruz and Colima fill a supply gap left by Florida citrus greening, yet their overall contribution remains smaller than berries, underscoring the crop-mix shift toward higher-margin fruit clusters.


Geography Analysis
West-Central Mexico accounted for significant share of national revenue in 2026, driven by Jalisco berries and Michoacan avocados. Proximity to the Port of Manzanillo and direct highways to Laredo shortens transit times and raises delivered freshness. The Bajío region is the fastest-growing territory, projected to expand at a rapid CAGR through 2031 as new greenhouses multiply in Guanajuato and Querétaro. Investors favor Bajío sites because central geography cuts freight costs to both Mexico City and northern border crossings, improving margins for year-round shipments.
Northwest Mexico, anchored by Sinaloa and Sonora, remains the winter vegetable hub that supplies United States stores from November to April. Drought in 2024 and virus protocols have trimmed tomato yields, but greenhouse clusters near Hermosillo continue to upgrade climate control to stabilize output. Southern states such as Chiapas and Oaxaca focus on organic bananas and heirloom tomatoes that win premiums in the European Union. Veracruz and Colima sustain steady lime exports, capitalizing on Florida citrus disease to keep packhouses operating at near capacity.
West-Central cooperatives are installing drip irrigation and shade nets that lower water use and protect berries from heat spikes. Bajío operators deploy sensor-guided fertigation to boost greenhouse yields and meet the demands of premium grocers for uniform produce. Northwest growers are adding controlled-atmosphere storage near Culiacan to offset climatic shocks and extend shelf life for Midwest deliveries. Progress across these corridors shows that logistics and technology upgrades will keep regional output climbing and widen Mexico's fruit and vegetable market reach through 2031.
Regulatory Landscape
Mexico's fruits and vegetables regulatory framework is anchored by Servicio Nacional de Sanidad, Inocuidad y Calidad Agroalimentaria (SENASICA), which sets and enforces phytosanitary and food-safety requirements for domestic movement, imports, and exports. Import and market-access conditions for fresh produce are operationalized through Normas Oficiales Mexicanas (NOMs) and administered via SENASICA's Módulo de Consulta de Requisitos Fitosanitarios, which exporters and importers use to verify commodity- and origin-specific requirements.
Trade and tariff administration also affects compliance priorities alongside sanitary rules. In March 2026, Mexico updated its tariff schedule (LIGIE), and in May 2026, the modernization track of the EU-Mexico agreement advanced with immediate tariff elimination for a large share of agri-food goods. That change increases the focus on traceability and protected-origin products for exporters looking to diversify beyond North America.
Value Chain Analysis
The Mexico fruits and vegetables value chain covers inputs (seeds, fertilizers, crop protection, irrigation and greenhouse technologies), farm production (open field and protected cultivation), aggregation and packing (grading, washing, fresh-cut operations), cold storage and transport, and wholesale and retail distribution across domestic and export channels. Export-oriented clusters in Sinaloa, Sonora, Bajio, Jalisco, and Michoacan rely on packhouses with sorting and quality-control capabilities, supported by cross-border logistics corridors serving the United States.
Cold-chain capacity and temperature-controlled transport are recurring value-chain bottlenecks for exporters shipping berries and greenhouse vegetables. Industry reporting in 2026 put Mexico's cold-storage footprint at roughly 15 million cubic meters versus about 130 million in the United States, and estimated temperature-control logistics at 15% to 20% of product value. Coordination among producers and exporters is also shaped by associations such as Consejo Nacional Agropecuario (CNA) and Aneberries, which help standardize practices and support market access; CNA's June 2026 agreement with Messe Berlin Americas to promote Mexican fresh produce internationally provides an organized route for buyer engagement and export promotion.
Competitive Landscape
By company concentration, the top five players together accounted for a decent share Mexico fruits and vegetables market in 2025. Result of Hortifrut México, Lineage Logistics, and Grupo Alt. Grupo Driscoll’s de México and Wonderful Citrus are the two largest branded exporters, which together account for a decent share of Mexico fruits and vegetables market, driven by proprietary berry genetics and large-scale lime estates, respectively. Both firms leverage multi-year retailer contracts that guarantee floor prices in exchange for exclusive supply, stabilizing cash flows and funding continuous research and development. Their packing facilities integrate optical sorters and near-infrared sensors to enforce the uniformity demanded by premium grocers. As a result, these firms set quality benchmarks that smaller growers must meet to enter club-store channels.
Hortifrut has accelerated blueberry plantings in Jalisco and Michoacán, while Lineage captures value through fee-based controlled-atmosphere storage rather than owning farmland. Grupo Alta is converting 600 hectares of Sonoran table grapes to organic protocols, targeting the European Union, and differentiating through sustainability labels. None of these firms spans every crop, reinforcing a structure where scale advantage remains crop-specific rather than market-wide. Competition is evolving along two axes, including technological sophistication and certification depth.
Large growers integrate robotics and machine vision to offset labor shortages, whereas mid-tier cooperatives pursue Fair Trade, Rainforest Alliance, and organic seals to reach high-margin niches. Cold-chain specialists plan additional ammonia-based warehouses in Baja California to serve the Nogales corridor, a move that could lock up logistics capacity and raise entry barriers. Private equity interest in protected agriculture and infrastructure signals an approaching consolidation wave that may lift the market concentration score modestly by 2031.
Market Opportunities and Future Outlook
Protected cultivation and high-tech greenhouse investment are key opportunities for stabilizing yields and delivering consistent quality in the face of drought and labor pressures, particularly for tomatoes, peppers, cucumbers, and leafy vegetables. A concrete example is the May 2026 announcement of a USD 200 million automated greenhouse project in Galeana, Nuevo Leon (with an initial USD 70 million phase) to grow lettuce and other vegetables, which reflects ongoing capital formation around controlled-environment production and modern packout requirements.
Export diversification and traceability-led commercialization also offer room for growth, especially for cooperatives and mid-tier exporters that can meet phytosanitary and documentation standards from new destinations. In July 2026, a Sembrando Vida-linked cooperative in Papantla, Veracruz completed a first export shipment of Persian lime to Russia, illustrating how aligned compliance and logistics can open non-traditional markets. At the same time, digital and marketplace tools are gaining attention as a way to reduce intermediation and improve price discovery for smaller growers, supporting more formalized off-take relationships that can be paired with certification, cold-chain access, and contract farming structures.
Recent Industry Developments
- July 2026: Colibri Fruit expanded its commercial footprint by establishing a dedicated company in the United States to manage direct sales of its mango and avocado offerings to retail chains. The shift increases value-chain control in the sales and customer-service layer and supports tighter alignment between Mexico-origin supply programs and U.S. retail specifications.
- September 2025: IDB Invest arranged USD 130 million in financing for Dinvertech to develop 50 hectares of high-tech greenhouses for mini-pepper production, with most volumes targeted for export. The funding backs protected-cultivation scaling in water-scarce Bajio zones and supports year-round supply programs that depend on climate-smart fertigation and standardized packout.
- December 2024: SL Produce disclosed a 2025 expansion plan that increases vegetable acreage and adds packing and cold-storage lines for its Tenderland-branded products serving U.S. customers. The announced capacity additions target post-harvest handling constraints and improve the ability to meet tighter freshness and grading requirements in export channels.


Research Methodology Framework and Report Scope
Market Definition and Coverage
For this report, the market is defined as the value of fruits and vegetables supplied within Mexico across the main crop cycle, covering the flows that link production to domestic availability and trade, and then to pricing and consumption patterns.
Scope exclusions: We exclude packaged and shelf-stable processed foods (such as canned, frozen, and ready meals) even if they are fruit or vegetable based.
Segmentation Overview
- By Crop Type
- Fruits
- Production Analysis
- Production Volume
- Area Harvested and Yield
- Consumption Analysis (Value and Volume)
- Trade Analysis (Value and Volume)
- Import Market Analysis
- Import Value and Volume
- Key Supplying Markets
- Export Market Analysis
- Export Value and Volume
- Key Destinations Markets
- Import Market Analysis
- Wholesale Price Trend Analysis and Forecast
- Seasonality Analysis
- Production Analysis
- Vegetables
- Production Analysis
- Production Volume
- Area Harvested and Yield
- Consumption Analysis (Value and Volume)
- Trade Analysis (Value and Volume)
- Import Market Analysis
- Import Value and Volume
- Key Supplying Markets
- Export Market Analysis
- Export Value and Volume
- Key Destinations Markets
- Import Market Analysis
- Wholesale Price Trend Analysis and Forecast
- Seasonality Analysis
- Production Analysis
- Fruits
Data Sources, Market Sizing, and Validation
Desk Research
Desk work started with building a clean fact base for Mexico on crop output, harvested area, yields, and trade movement, since those items anchor the supply picture before any market math is done. We relied on public statistical sources and official references such as FAOSTAT, UN Comtrade, Mexico government agriculture statistics, and customs and tariff publications to understand export and import volumes and unit values.
After that, we reviewed supporting material to interpret value shifts, including wholesale price series, seasonal availability, and crop-specific notes from agriculture extension bodies and peer reviewed papers. We also used company filings, investor decks, association websites, and reputed press to map product focus and channel dynamics. In addition, we used a paid subscription for company financials and for shipment level import export checks when public totals were not detailed enough. These desk sources are illustrative and not exhaustive, and many other public and paid references were used to collect, cross check, and clarify the final inputs.
Primary Interviews and Surveys
Primary work focused on verifying how value forms across the chain, including farmgate versus wholesale price build ups, typical loss rates, and how export grades affect the realized price. We spoke with growers, packers, traders, distributors, and large buyers so assumptions on volumes, pricing spreads, and seasonality were checked from more than one angle across Mexico.
Distribution of primary research fieldwork respondents
| Company type | Respondent position |
|---|---|
| Top tier: 26% | CXOs: 14% |
| Mid tier: 55% | Functional/Unit leaders: 26% |
| Smaller Players: 19% | Managers: 60% |
Market-Sizing & Forecasting
The core sizing uses a top-down build that reconstructs market value from Mexico production and trade balance signals, which are then tied to observed price series to translate volumes into USD. We also corroborated results using selective bottom-up approximations, such as sampled crop level volume multiplied by average realized prices, plus channel checks for the split between domestic supply and export oriented volumes.
In this market, the most practical inputs are harvested area and yield trends for major crops, the export share and destination mix, wholesale price movement by season, post harvest loss assumptions, and the share of premium grades that earn higher pricing. When a variable was weak in public datasets, gaps were handled using bounded ranges from interviews and then stress tested so totals did not drift away from visible trade and production constraints. For forecasting, scenario analysis was used, since weather variability, planting economics, and export demand can swing outcomes, and the final forward path was aligned to the consensus ranges shared by market participants.
Data Validation & Update Cycle
Outputs were validated by comparing model totals against independent signals like production volumes, net trade direction, and implied unit values, and then checking for breaks that did not match known seasonality or crop cycle realities. When a variance appeared, the assumptions were reopened, and follow up calls were triggered to recheck the specific driver, typically prices, losses, or export grade mix.
Before sign off, the work goes through multi step internal reviews where another analyst replicates the logic and checks arithmetic, unit, and currency consistency. Reports are refreshed annually, and interim updates are made when a material event changes supply, pricing, or trade patterns. Right before delivery, a fresh pass is completed so clients receive the latest updated view based on the newest available data.
Mordor Intelligence's Mexico Analysis of Fruits and Vegetables Sector Market Estimate Compared With Other Published Estimates
Published market sizes for Mexico fruits and vegetables often do not line up, and the main reasons are usually differences in what is counted, where in the value chain the pricing is taken, and which year and currency timing are used.
Trade balances, production volumes, and wholesale price series are the evidence used to keep Mordor Intelligence's estimate tied to Mexico's domestic availability and trade flows, which reduces inflation that can happen when retail markups or broader fresh food baskets get mixed in.
Benchmark comparison
| Source | Market Size | Gaps in Research Methodology |
|---|---|---|
| Mordor Intelligence | USD 28.40 B (2025) | |
| Global Consultancy A | USD 13.74 B (2024) | This figure is scoped to fresh fruits and vegetables revenue and can sit closer to a consumer market view, which typically excludes export value capture and can reflect a different price point than wholesale level series. |
| Industry Analytics B | USD 13.82 B (2025) | This approach is organized around organic versus non organic and online versus offline channels, and it may size only the traded and retailed portion rather than linking totals back to production plus net trade constraints. |
Across the three figures, the spread mainly comes from scope boundaries and the pricing point used to convert volumes into value, followed by base year selection. By anchoring the model to observable Mexico supply and trade signals and then testing the price and loss assumptions through interviews, the final number stays traceable to clear steps that can be repeated during each refresh.


Key Questions Answered in the Report
How fast is the Mexico fruits and vegetables market growing through 2031?
It is projected to register a 5.07% CAGR between 2026 and 2031, rising from USD 29.6 billion in 2026 to USD 37.9 billion by 2031.
Which segment leads revenue within the Mexico fruits and vegetables market?
Vegetables, anchored by tomatoes, bell peppers, and cucumbers, accounted for 54.2% of revenue in 2025.
Which crop group is expanding the quickest?
Fruits, especially blueberries and raspberries, are advancing at a 6.0% CAGR to 2031 on the back of export contracts with U.S. retailers.
What is the biggest operational risk facing growers?
Labor shortages that lifted daily harvest wages by 40% between 2023 and 2025, prompting investment in robotic pickers.
How concentrated is the competitive landscape?
The top five grower-exporters together control about a descent of revenue, reflecting moderate fragmentation and opportunities for mergers.
Page last updated on:


 Your data is secure and never sold or shared.


