
Market Overview
| Study Period | 2020 - 2031 |
|---|---|
| Forecast Data Period | 2026 - 2031 |
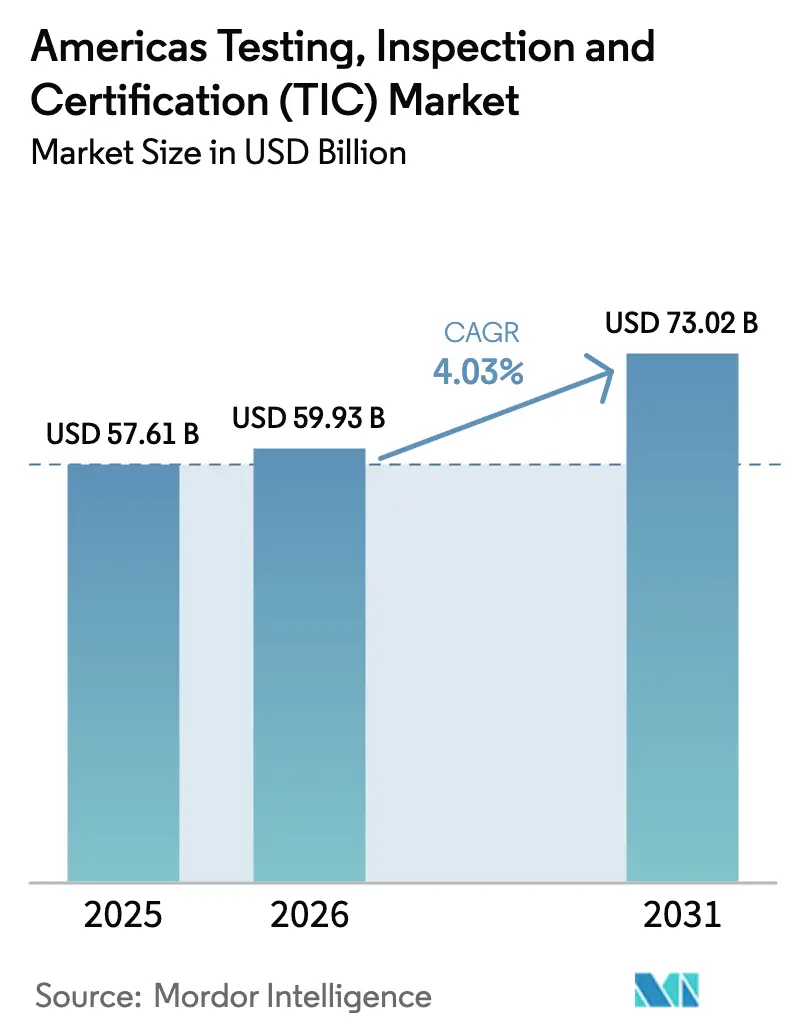
| Base Year Market Size (2025) | USD 57.61 Billion |
| Market Size (2026) | USD 59.93 Billion |
| Market Size (2031) | USD 73.02 Billion |
| Growth Rate (2026 - 2031) | 4.03 % |
| Market Concentration | Medium |
Major Players *Disclaimer: Major Players sorted in no particular order Image © Mordor Intelligence. Reuse requires attribution under CC BY 4.0. | |
Americas Testing, Inspection And Certification (TIC) Market Analysis by Mordor Intelligence
The Americas TIC market size is expected to grow from USD 57.61 billion in 2025 to USD 59.93 billion in 2026 and is forecast to reach USD 73.02 billion by 2031 at 4.03% CAGR over 2026-2031. The near-shoring wave that pulls production from Asia to the Americas fuels steady demand for local compliance testing, while stricter ESG disclosure rules issued by the U.S. SEC and the Canadian CSA elevate verification volumes. North America retains clear primacy because its mature regulatory environment, deep manufacturing base, and robust capital expenditure on advanced testing infrastructure sustain high ticket engagements. South America is recording the quickest growth as governments modernize industrial policy and multinational firms invest in fresh capacity, especially in Brazil and Mexico. Across every geography, the convergence of AI-enabled inspection, digital reporting platforms, and reciprocal certification agreements between aviation regulators compresses project timelines and lifts the overall value proposition of third-party providers.
Key Report Takeaways
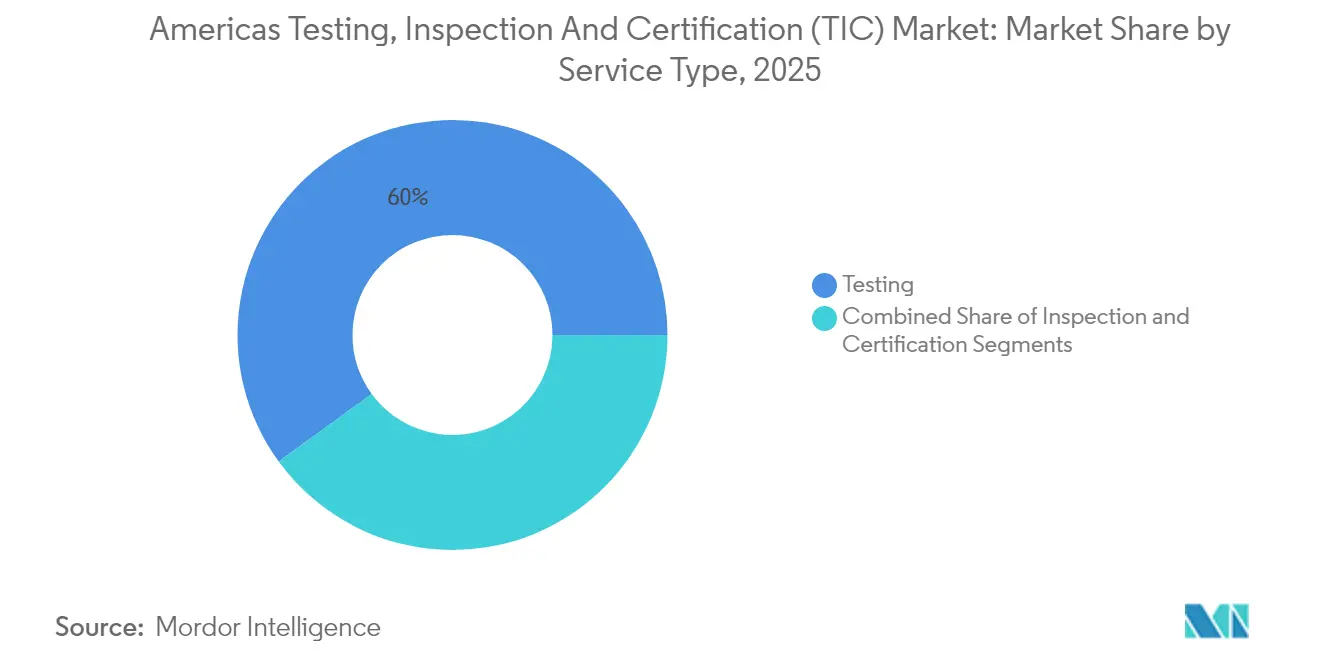
- By service type, testing services held 60.02% of the Americas TIC market share in 2025, while certification services are expanding at a 4.74% CAGR through 2031.
- By sourcing model, the outsourced segment controlled 68.72% of the Americas TIC market size in 2025 and is projected to grow at a 4.55% CAGR to 2031.
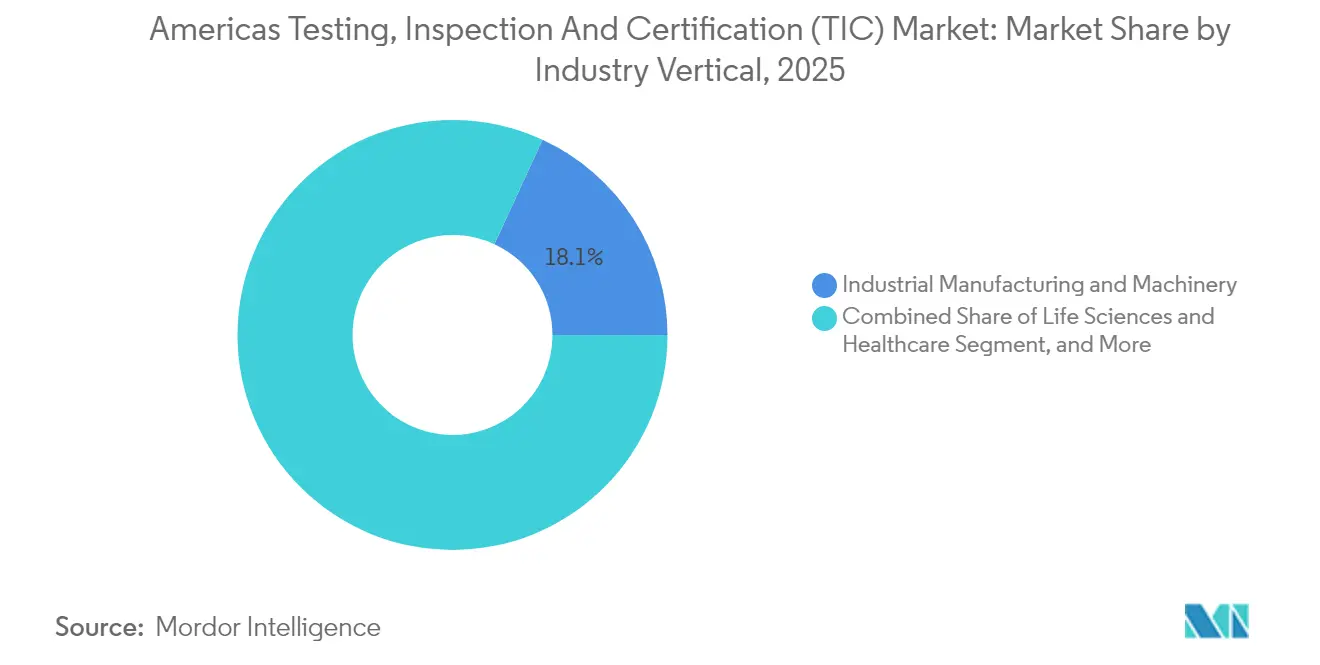
- By industry vertical, life sciences and healthcare are forecast to post the fastest 5.18% CAGR to 2031, whereas industrial manufacturing and machinery retained the largest revenue share at 18.12% in 2025 of the Americas TIC market.
- By mode of service delivery, on-site service delivery captured 47.96% revenue in 2025 of the Americas TIC market, but remote and digital inspection solutions are projected to advance at a 4.93% CAGR through 2031.
- By region, South America is set to register a 5.29% CAGR between 2026 and 2031, outpacing all other sub-regions of the Americas TIC market, whereas North America retained the largest revenue share at 64.62% in 2025.
Note: Market size and forecast figures in this report are generated using Mordor Intelligence’s proprietary estimation framework, updated with the latest available data and insights as of 2026.
Americas Testing, Inspection And Certification (TIC) Market Trends and Insights
Drivers Impact Analysis*
| Driver | (~) % Impact on CAGR Forecast | Geographic Relevance | Impact Timeline |
|---|---|---|---|
| Rising near-shoring drives demand for local compliance testing | +0.8% | North America and Mexico, spillover to Central America | Medium term (2-4 years) |
| Stricter ESG auditing mandates by U.S. SEC and Canadian CSA | +0.6% | North America, extending to South American subsidiaries | Short term (≤ 2 years) |
| Accelerated 5G / 6G roll-outs require new radio-equipment certification | +0.5% | Global, with early deployment in major metropolitan areas | Medium term (2-4 years) |
| Surging Li-ion battery gigafactories in Mexico and Brazil | +0.4% | Mexico, Brazil, with supply-chain effects across Americas | Long term (≥ 4 years) |
| Digital traceability legislation in food supply chains | +0.3% | United States, Canada, with harmonization pressure on LATAM | Short term (≤ 2 years) |
| Insurance underwriters tightening loss-control inspection clauses | +0.2% | North America, selective adoption in South American markets | Medium term (2-4 years) |
| Source: Mordor Intelligence | |||
Near-shoring compliance testing surge reshapes market dynamics
Local production shifts accelerated after pandemic-era supply chain disruptions, prompting new factories in Mexico’s border states to commission extensive safety, environmental, and quality audits before products may enter the United States. Companies report that 70% of open technical roles remain unfilled, which obliges heavier reliance on outsourced providers to satisfy ISO 17025 and sector-specific standards.[1] Spillover benefits reach logistics firms that require verification of warehouse automation systems, as well as financial service centers tasked with regional compliance oversight. The Americas TIC market enlarges as near-shoring also extends to consumer electronics, automotive drivetrains, and precision machinery that demand complex multi-discipline testing.
ESG auditing mandates create new revenue streams
The U.S. SEC rule, effective for 2025 large accelerated filers, obliges third-party assurance of Scope 1 and Scope 2 emissions, while the Canadian CSA implements parallel disclosure guidelines. The extraterritorial reach means subsidiaries across Latin America must submit verified carbon inventories, leading to cross-border engagements for established TIC firms. Insurers add weight by requesting ESG compliance certificates before underwriting property and casualty coverage. In response, providers launch carbon accounting, supply-chain transparency, and social-impact audit services, stimulating premium-rate contracts that lift overall Americas TIC market growth.
5G / 6G equipment certification drives technical innovation
Rapid 5G rollout across urban corridors compels handset makers, network equipment vendors, and private-network operators to meet new FCC and ISED protocols that cover millimeter-wave bands and massive MIMO antenna arrays.[2] Capital-heavy RF chambers priced around USD 10–15 million per site set a high entry barrier, thus reinforcing the competitive edge of incumbents. Preparations for 6G prototypes due after 2028 spawn advance bookings for reliability and coexistence testing. Mutual recognition agreements cut duplicate testing burdens, yet national spectrum allocations still diverge, ensuring steady advisory revenue.
Li-ion battery gigafactory expansion fuels specialized testing
BMW’s USD 1.7 billion plant in Mexico represents a broader battery manufacturing wave that also touches Brazil, where government incentives catalyze new capacity. Comprehensive protocols such as UL 2580 demand abuse, thermal runaway, and cycle-life analysis, activities that rely on purpose-built chambers and chem-analysis labs unavailable to most in-house teams. Suppliers of cathode, anode, and electrolyte materials enter the compliance queue, multiplying addressable spend for service providers with electrochemical expertise.
Restraints Impact Analysis*
| Restraint | (~) % Impact on CAGR Forecast | Geographic Relevance | Impact Timeline |
|---|---|---|---|
| Shortage of qualified lab technicians across LATAM | -0.4% | Latin America, spillover effects to North American operations | Long term (≥ 4 years) |
| Fragmented regulatory regimes between Mercosur and USMCA | -0.3% | Cross-border operations between North and South America | Medium term (2-4 years) |
| High capex for AI-driven remote inspection hardware | -0.2% | Global, with slower adoption in cost-sensitive LATAM markets | Short term (≤ 2 years) |
| Rising in-house testing capabilities by mega OEMs | -0.2% | North America primarily, selective adoption by large South American manufacturers | Medium term (2-4 years) |
| Source: Mordor Intelligence | |||
Technician shortage constrains market expansion
UNESCO warns that regional technical education shortfalls leave 70% of Mexican technology firms scrambling to source qualified workers.[3] Specialized domains such as RF characterization, chemical analytics, and advanced materials see persistent vacancy rates, forcing providers to build intensive training pipelines that extend payback periods. Wage inflation for scarce skill sets compresses margins, especially for commoditized assays. Cross-border relocation of senior experts mitigates bottlenecks but adds visa and relocation costs.
Regulatory fragmentation increases compliance costs
Despite reciprocal aviation agreements, notable divergences linger between USMCA and Mercosur frameworks for food safety, automotive components, and telecommunication devices. Multinationals navigating both blocs must often repeat entire test batteries, prolonging time-to-market and inflating budgets. Large TIC firms leverage multi-jurisdiction labs to centralize program management, whereas smaller specialists face barriers to continental expansion.
*Our forecasts treat driver/restraint impacts as directional, not additive. The impact forecasts reflect baseline growth, mix effects, and variable interactions.
Segment Analysis
By Service Type: Testing retains lead while certification accelerates
Testing solutions delivered 60.02% of 2025 revenue, underlining their foundational role in product validation across every vertical. Certification, though smaller, is set to grow at a 4.74% CAGR because ESG audits, cybersecurity seals, and functional-safety endorsements carry increasing regulatory weight. Inspection services occupy the median niche, sustaining infrastructure integrity projects and preventive maintenance programs. Battery safety initiatives illustrate how demand migrates toward high-complexity assays where expert judgment and purpose-built chambers matter. The Americas TIC market size for certification services is projected to widen in tandem with mandates that require audited disclosures.
Competitive positioning shifts as labs pursue ISO 17025 baseline accreditation before layering sector-specific endorsements such as UL 2580 or IATF 16949. UL Solutions expanded its electric-vehicle battery test line to capture premium assignments, signaling a pivot toward high-value niches. Smaller firms without capital latitude gravitate to subcontract models under network partners, reinforcing the outsourced ecosystem. Automation and data analytics permeate routine tests, freeing skilled personnel to focus on interpretive tasks, yet staff shortages in advanced disciplines temper volume scalability.

By Sourcing Type: Outsourced dominance persists
Corporations continued to channel 68.72% of verification budgets to external partners in 2025, a pattern projected to hold with a 4.55% CAGR through 2031. Risk mitigation, regulator preference for independent sign-off, and ever-broadening standard catalogs underpin the outsourced share. The Americas TIC market share for outsourced activities benefits from cross-border manufacturing that complicates single-entity compliance.
Digital transformation amplifies this appeal. Providers embed real-time dashboards, seamless data feeds, and audit-ready report generators, reducing internal administrative loads. Mega-OEMs that have built captive labs still require impartial attestations before product launch. Consequently, the outsourced model remains integral, while hybrid arrangements surface in which corporate labs run pre-screens and external partners supply conformance certificates.
By Industry Vertical: Manufacturing leads, healthcare outpaces
Industrial manufacturing and machinery accounted for an 18.12% slice of 2025 turnover as capital goods producers validated equipment for regional plants. The Americas TIC market size for life sciences and healthcare is poised to climb fastest at 5.18% CAGR because post-pandemic regulatory scrutiny reinforces sterility, efficacy, and supply-chain integrity norms.
Consumer goods and retail maintain baseline volume through safety and labeling checks, while ICT and telecom ride the 5G/6G deployment cycle. Automotive ventures into electrification and autonomy necessitate fresh test suites for batteries and perception systems. Oil, gas, and petrochemical operators adhere to pipeline integrity standards under PHMSA jurisdiction. Renewable energy uptake expands demand for blade inspection, inverter certification, and grid compliance. Aerospace firms leverage reciprocal certification pacts to expedite cross-border approvals, and construction material labs benefit from rising infrastructure spend across Brazil, Mexico, and Chile.
By Mode of Service Delivery: Digital uptake accelerates
On-site engagements maintained 47.96% revenue in 2025 as heavy equipment and infrastructure still require physical examination. Remote and digital methodologies posted a 4.93% CAGR, leveraging AI vision, drones, and IoT sensors to perform continuous or periodic checks without travel. Off-site laboratories remain essential for activities such as destructive testing, chemical analytics, and climatic stress cycles.
Pandemic-era constraints triggered rapid remote adoption; the model persists because clients appreciate cost, speed, and carbon footprint savings. Yet regulatory acceptance varies, prompting blended models where remote sensing delivers raw data and periodic field visits serve as quality anchors. Providers invest in interoperability layers that integrate sensor outputs into secure cloud dashboards detailed enough for auditors.
Geography Analysis
North America’s outsized 64.62% share derives from comprehensive legislation that spans health, environment, and technology. The Americas TIC market share split favors the United States because its multi-agency oversight places mandatory tests on pharmaceuticals, electronics, and agriculture. Canada amplifies activity through mining core assays and oil sands environmental audits, while Mexico’s border expansion funnels automotive driveline and consumer electronics checks into nearby accredited labs. USMCA has aligned many technical requirements, yet implementation lags in niche domains, sustaining advisory opportunities.
South America posts the sharpest growth, forecast at 5.29% CAGR to 2031, as Brazil injects capital into transport corridors and power grids. Federal programs require certified concrete, steel, and composite materials, widening the Americas TIC market size devoted to civil engineering verification. Argentina leverages lithium and copper resource expansion, prompting specialized spectroscopy and metallurgical services. Chile’s renewables boom requires IEC-compatible turbine and solar panel validation, while Peru and Colombia demand pipeline inspections aligned with U.S. integrity protocols.
Cross-border manufacturers encounter dual testing when USMCA and Mercosur rules diverge in food additives limits, vehicle emissions, and cellular handset SAR thresholds. Larger TIC players capitalize on regional lab footprints that streamline sample logistics and coordinate multi-standard test plans. Emerging mutual recognition talks promise long-range efficiency gains yet are unlikely to erase all local certification layers within the forecast window.
Regulatory Landscape
Regulation in the Americas TIC market is multi-agency and sector-specific, spanning supplier self-declaration of conformity to mandatory third-party testing, inspection, or certification depending on the product and regulator. In the United States, bodies such as the FCC (equipment authorization for RF devices) and OSHA (Nationally Recognized Testing Laboratory recognition, including scope expansions granted to entities such as TUV SUD America) shape demand for accredited labs and on-site inspections. U.S. Customs and Border Protection accreditation for laboratories and commercial gaugers adds a separate compliance lane tied to cross-border trade flows.
Across Latin America, shifting institutional frameworks and device-approval regimes add complexity for manufacturers operating across USMCA and Mercosur. Chile SUBTELs Exempt Resolution No. 737, effective February 22, 2026, moved many short-range device certifications from government certificates toward manufacturer self-declaration with QR-code based documentation. Argentinas ENACOM Resolution 57/2026 set a new telecom equipment registration framework effective September 1, 2026. Industry coordination bodies such as TIC Council Americas continue engagement with national regulators, reinforcing the role of third-party conformity assessment and aligned standards, including cybersecurity references such as IEC 62443, in high-scrutiny verticals.
Value Chain Analysis
The Americas TIC value chain starts with client demand definition and regulatory mapping, often supported by regulatory intelligence on enforcement and evolving requirements. It then moves into test plan design, sample logistics and chain-of-custody management, and execution across on-site inspections and off-site laboratory testing. Outputs flow into evaluation and certification or attestation steps aligned to the applicable conformity route, from self-declaration support to third-party certification, followed by surveillance audits, recertification cycles, and corrective action management. Providers also layer technical consulting and training, particularly when new standards or regulator processes change the evidence required for market access.
Supporting nodes include accreditation and recognition bodies and industry associations that influence accepted methods and auditor competence, along with equipment and software suppliers that enable advanced inspection and digital reporting. High-capex assets such as specialized RF environments and digitally enabled inspection toolchains act as bottlenecks, while talent availability in specialized disciplines limits throughput and increases subcontracting within provider networks. As remote and digital inspection expands, secure data capture, interoperability, and audit-ready documentation become the connective tissue between field data collection and certification decisions accepted by regulators or customers.
Competitive Landscape
The Americas TIC market remains moderately fragmented, though M&A accelerates as providers pursue scale and niche expertise. The abandoned USD 30–35 billion SGS-Bureau Veritas merger in January 2025 shows antitrust sensitivity at mega-deal levels. Instead, acquisitive activity pivots toward bolt-ons: Bureau Veritas paid CAD 650 million (USD 481 million) for Maxxam Analytics to bolster Canadian environmental coverage, while SGS integrated Accutest Laboratories to deepen U.S. soil and water portfolios.
Strategic themes concentrate on electrification, ESG audits, and digital inspection. Intertek’s USD 15 million Electrification Centre of Excellence near Detroit exemplifies capital deployment toward high-growth verticals. TÜV Rheinland’s Mexico cybersecurity lab positions the company for rising automotive connectivity demands. Mérieux NutriSciences purchased Bureau Veritas’ food unit for EUR 350 million (USD 378 million) to craft a continental network that targets farm-to-fork traceability validations. Providers that command comprehensive accreditations across multiple domains and regions gain pricing power, whereas commodity assays experience competitive rate squeezing.
Digital capabilities serve as new differentiators. Firms deploy AI for anomaly detection, predictive analytics, and virtual witness solutions. Early adopters secure multi-year master service agreements that bundle traditional checks with data services. Smaller specialists preserve relevance by focusing on single-discipline expertise and servicing subcontract flow from prime contractors.
Americas Testing, Inspection And Certification (TIC) Industry Leaders
-
Bureau Veritas SA
-
SGS SA
-
Intertek Group plc
-
TÜV SÜD AG
-
TÜV Rheinland AG
- *Disclaimer: Major Players sorted in no particular order

Market Opportunities and Future Outlook
Near-shoring, cross-border trade compliance, and expanding assurance requirements around ESG, product safety, and connectivity are creating whitespace for providers that can combine multi-country regulatory know-how with accredited lab capacity across the Americas. SGSs February 2026 acquisition of Murray-Brown Laboratories to expand food safety and nutraceutical testing capacity in North America is a concrete market signal, pointing to continued investment in regulated consumables testing where traceability and documentation intensity support higher-value engagements.
A second opportunity area is digital trust, connectivity validation, and workforce enablement services that complement traditional testing and inspection. The integration of Quality Support Group Inc. by TUV Rheinland (February 2026) to expand technical consulting and training in the United States supports demand for competence-building and implementation support as standards catalogs widen, and as acceptance of digital inspection data varies by regulator and vertical. With regional regulatory regimes still fragmented between blocs, providers with strong program management, recognized accreditations, and the ability to run multi-standard test plans across North and South America have a defined lane to win projects where time-to-market and evidence completeness drive supplier selection.
Recent Industry Developments
- May 2026: SGS SA opened a new Bicycle, eMobility and Transit Packaging testing laboratory in Bentonville, Arkansas, to support North American suppliers. The expansion increases direct TIC testing capacity in the region for high growth eMobility and transit packaging sectors. It expands SGS's service footprint and strengthens pricing power in the Americas TIC market.
- May 2026: TÜV SÜD AG launched POWER 2030 strategy focusing on profitable growth in digitalization, cybersecurity, AI, and industrial transformation. The program advances digital testing capabilities and expands TIC adjacent services in the market. It could elevate competitive dynamics and drive demand for AI enabled inspection capabilities.
- March 2026: SGS SA completed the acquisition of Granite River Labs Services GRL to scale digital solutions and high speed wired data connection validation capabilities. The acquisition expands SGSs footprint in digital infrastructure testing, aligning with AI/IoT and data center demand within the Americas TIC market.
Research Methodology Framework and Report Scope
Market Definition and Coverage
This market covers third-party revenues earned from testing, inspection, and certification work delivered to customers across the Americas, where the service output is a compliance, quality, or safety assurance result supported by documented procedures.
Scope exclusions: It does not count in-house internal QA/QC cost centers when no external service revenue is generated.
Segmentation Overview
- By Service Type
- Testing
- Inspection
- Certification
- By Sourcing Type
- In-house
- Outsourced
- By Industry Vertical
- Consumer Goods and Retail
- ICT and Telecom
- Automotive and Transportation
- Aerospace and Defense
- Oil, Gas and Petrochemicals
- Energy and Utilities
- Industrial Manufacturing and Machinery
- Chemicals and Materials
- Construction and Infrastructure
- Life Sciences and Healthcare
- Food, Agriculture and Beverage
- Other Industry Verticals (Environment, Sustainability, etc.)
- By Mode of Service Delivery
- On-site
- Off-site / Laboratory
- Remote / Digital
- By Region
- North America
- United States
- Canada
- Mexico
- South America
- Brazil
- Argentina
- Chile
- Rest of South America
- North America
Data Sources, Market Sizing, and Validation
Desk Research
Desk work starts with building the compliance and demand map that drives TIC spending, and then translating it into measurable activity signals. We used public and official sources such as US FDA compliance and recall actions, US Department of Transportation and FAA safety directives, OSHA standards and enforcement releases, and EPA rulemakings that trigger new test methods and audit cycles. Cross-border trade and manufacturing activity were taken from sources such as USITC data, UN Comtrade, and national statistics agencies in the region, which helps us understand where inspection volumes and laboratory needs typically concentrate.
After the public baseline was built, the model was anchored using company filings, investor presentations, and accreditation body information that clarifies service lines and lab footprints. In parallel, a paid subscription for company financials and intelligence was used to normalize revenue splits where reporting was not detailed, and a paid patent database was checked to spot where new test protocols and instrument adoption were accelerating. The desk sources mentioned here are illustrative only, and many other public documents and datasets were also reviewed for data collection, cross-checking, and clarification.
Primary Interviews and Surveys
Primary work was used to pressure-test the desk assumptions around outsourcing appetite, pricing movement, and how often recertification and audit cycles are actually executed in different industries. We spoke with a mix of service providers, lab managers, auditors, procurement teams, and quality leaders across North America and South America so that gaps in public reporting could be filled and the final assumptions could be triangulated.
Distribution of primary research fieldwork respondents
| Company type | Respondent position |
|---|---|
| Top tier: 31% | CXOs: 13% |
| Mid tier: 53% | Functional/Unit leaders: 41% |
| Smaller Players: 16% | Managers: 46% |
Market-Sizing & Forecasting
Sizing is built mainly through a top-down approach where industry activity and regulatory triggers are translated into a demand pool for TIC services, and then converted to value using typical service mix and pricing levels. For this market, the demand pool is reconstructed using indicators such as manufacturing output and trade flows, the number of regulated facilities and audit cadence, infrastructure project activity that requires materials testing, and the pace of new or revised standards that expand test panels. Inputs are then adjusted by outsourcing penetration, utilization of accredited labs, and the share of on-site versus laboratory delivery, since these factors move average contract values.
To keep the totals realistic, we corroborated the results with selective bottom-up approximations, such as sampled provider revenue splits by service type and industry vertical, plus simple volume times ASP checks for common testing categories where ranges are well understood by practitioners. When a bottom-up view cannot be cleanly built for smaller countries or niche service lines, the gap is handled using proxy indicators like sector output and accredited capacity presence, followed by interview-based sanity checks.
Forecasting relies on scenario analysis supported by a light multivariate regression, where future market value is linked to macro and sector drivers like industrial production, construction spending, trade intensity, and expected regulatory enforcement focus, and then validated through expert views on pricing and outsourcing trends. Where signals conflict, we keep assumptions conservative and document the variable that caused the change so the model stays repeatable.
Data Validation & Update Cycle
Validation is done through stepwise triangulation across independent signals, and then reviewed for outliers before final sign-off. We compare the modeled totals against checks such as reported service revenue direction in public filings, observed changes in accreditation activity, and shifts in regulated testing requirements, and then investigate variances that do not match the operating story shared in interviews. When anomalies persist, follow-up outreach is triggered with the same respondent types so assumptions can be revisited and documented.
Reports are refreshed annually, with interim updates made when material events can change near-term demand or pricing (for example, a major rule change or a sharp swing in industrial activity). Before delivery, the model and key inputs receive a fresh pass so clients get the most current view available at that time.
Mordor Intelligence's Americas Testing Inspection and Certification Market Size Compared With Other Published Estimates
Published market sizes for TIC in the Americas often differ, even when they look like they cover the same service set, because the boundaries and counting rules are not uniform. The spread usually comes from what is treated as external service revenue versus internal cost, which countries are grouped into the region, and whether remote and digital delivery is counted consistently.
Key gap drivers also include how outsourcing penetration is assumed by industry, how fast pricing is allowed to move with wage and instrument costs, and whether numbers are reported in a base case versus a more aggressive scenario. Currency timing and refresh cadence matter too, since a model updated after major regulatory changes or demand shocks will land on a different current-year value.
Benchmark comparison
| Source | Market Size | Gaps in Research Methodology |
|---|---|---|
| Mordor Intelligence | USD 57.61 B (2025) | |
| Regional Consultancy A | USD 54.20 B (2025) | Uses a narrower counted spend that leans heavily on laboratory testing revenue and excludes a larger share of on-site inspection and recurring certification renewals, which compresses the total. |
| Industry Association B | USD 61.80 B (2025) | Applies a broader definition that can blend captive in-house quality programs and adjacent technical services into the revenue pool, and it often assumes faster pricing progression without re-validating mix shifts. |
The table shows a tight but meaningful range around the 2025 value, and the biggest differences come from what is counted as third-party service revenue versus internal programs. In Mordor Intelligence's model, value is counted only when testing, inspection, or certification is delivered as an external service across North America and South America, which avoids inflating totals with captive QA budgets while still capturing recurring compliance work. With this structure, our estimate stays traceable to clear demand drivers and can be re-run with the same steps as new rules and industry activity data are released.
Key Questions Answered in the Report
How large is the Americas TIC market in 2026?
It is valued at USD 59.93 billion and is projected to reach USD 73.02 billion by 2031 at a 4.03% CAGR.
Which region is expanding fastest within testing and inspection services?
South America is forecast to grow at 5.29% CAGR through 2031, driven by industrial development and regulatory modernization.
Why are ESG mandates boosting TIC demand?
The U.S. SEC and Canadian CSA require third-party assurance of emissions data starting in 2025, pushing companies to contract certified auditors.
What service type leads the Americas TIC market?
Testing services hold 60.02% revenue share, reflecting their foundational role in product and process validation.
How is digital inspection changing the landscape?
AI-enabled remote solutions are growing at 4.93% CAGR, reducing field costs and enabling continuous monitoring while still requiring periodic on-site validation.
Which industry shows the fastest projected growth?
Life sciences and healthcare is expected to grow at 5.18% CAGR because post-pandemic regulations demand rigorous compliance checks.