
Americas Sensor Market Size and Share
Market Overview
| Study Period | 2020 - 2031 |
|---|---|
| Forecast Data Period | 2026 - 2031 |
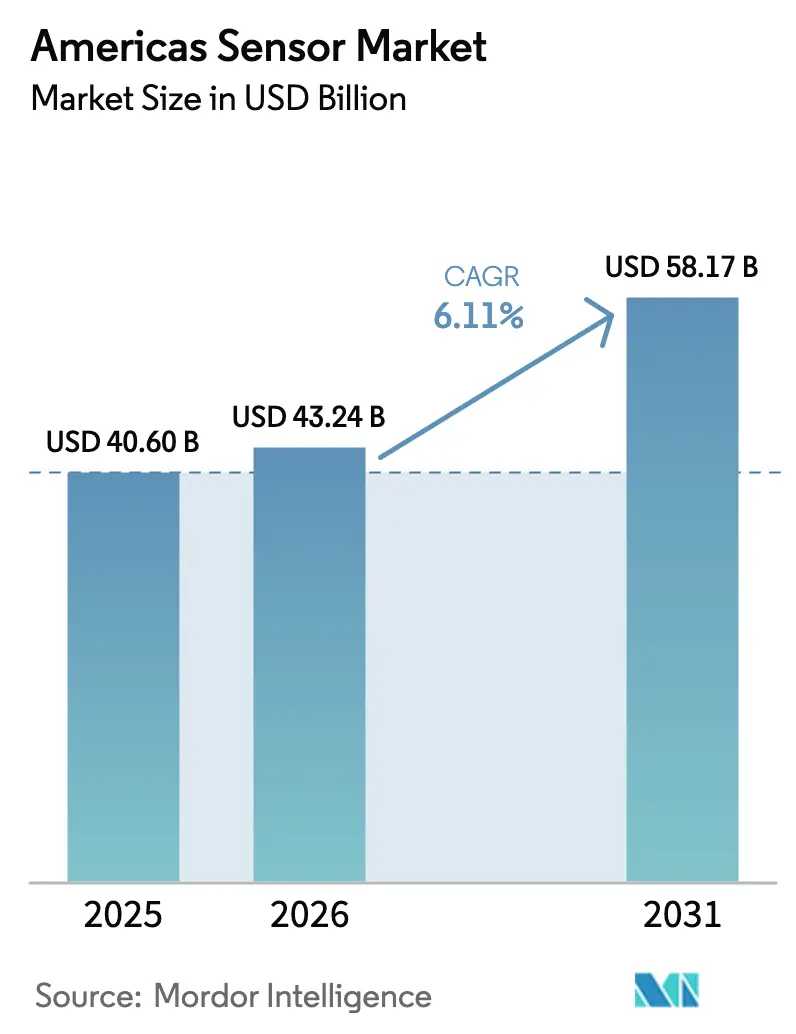
| Base Year Market Size (2025) | USD 40.60 Billion |
| Market Size (2026) | USD 43.24 Billion |
| Market Size (2031) | USD 58.17 Billion |
| Growth Rate (2026 - 2031) | 6.11% CAGR |
| Market Concentration | Medium |
Major Players *Disclaimer: Major Players sorted in no particular order Image © Mordor Intelligence. Reuse requires attribution under CC BY 4.0. | |
Americas Sensor Market Analysis by Mordor Intelligence
The Americas sensor market size is expected to grow from USD 40.60 billion in 2025 to USD 43.24 billion in 2026 and is forecast to reach USD 58.17 billion by 2031 at 6.11% CAGR over 2026-2031. Accelerating adoption of edge-computing architectures is steering investment toward on-device inference, reducing cloud latency and supporting sovereign-AI mandates across North and South America. Momentum around LiDAR-equipped autonomous fleets and the rapid scale-up of electric vehicles is amplifying demand for multi-modal sensing suites. Fabrication economies of scale in micro-electro-mechanical systems (MEMS) are lowering average selling prices, encouraging substitution for bulk-silicon alternatives. Simultaneously, stricter environmental regulations are widening the commercial runway for chemical and environmental sensors while biodegradable prototypes attract sustainability-focused buyers.
Key Report Takeaways
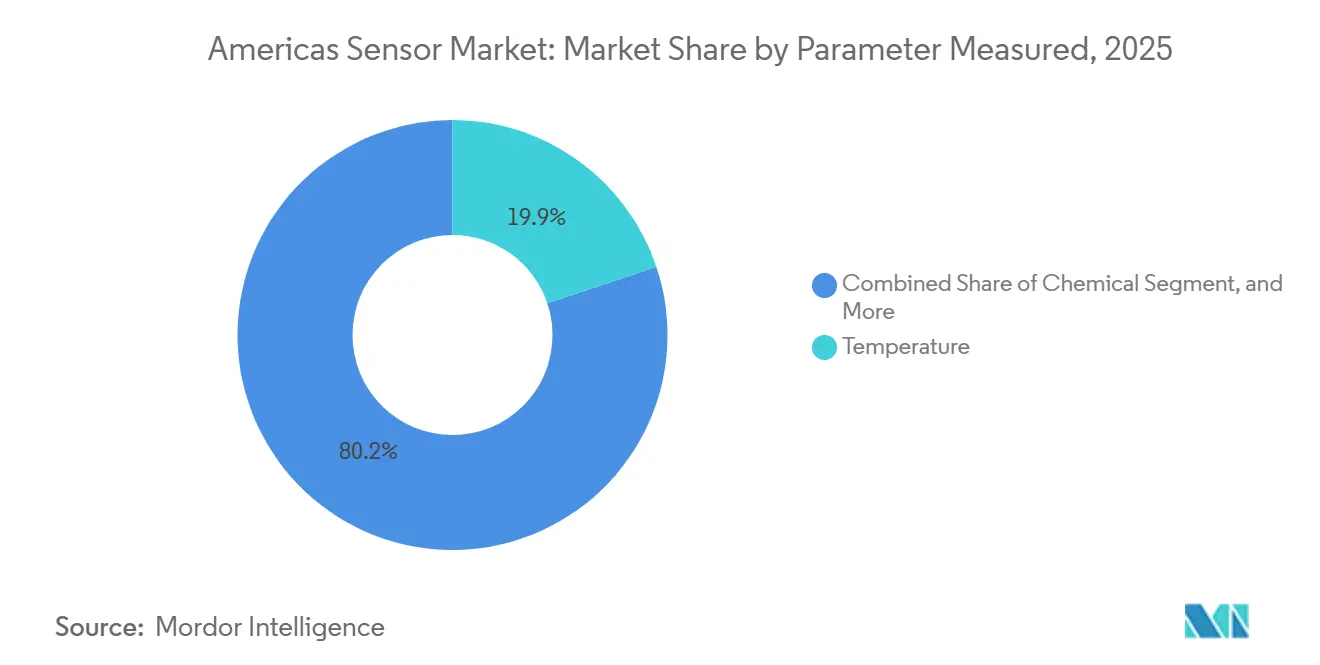
- By parameter measured, temperature devices led with 19.85% of the Americas sensor market share in 2025, whereas chemical sensors are projected to expand at a 6.59% CAGR through 2031.
- By mode of operation, optical sensing commanded 23.43% revenue in 2025, while LiDAR is forecast to grow fastest at 6.96% CAGR between 2026-2031.
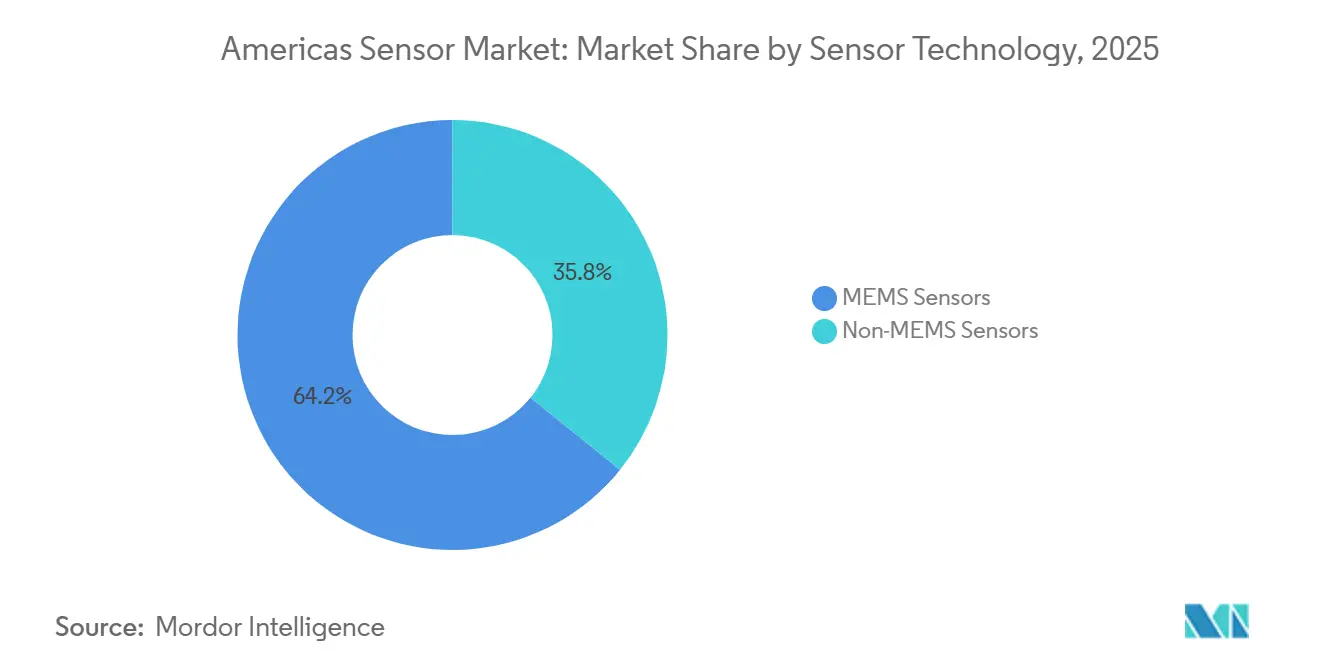
- By technology, MEMS devices accounted for 64.21% of the Americas sensor market size in 2025 and are anticipated to advance at a 7.11% CAGR during the forecast period.
- By end-user industry, automotive applications captured 26.17% revenue in 2025, but medical and wellness end-users are expected to record the highest 7.23% CAGR to 2031.
- By geography, the United States represented 38.34% of 2025 revenue, yet Brazil is predicted to grow at 7.15% CAGR on the back of the MOVER investment program.
Note: Market size and forecast figures in this report are generated using Mordor Intelligence’s proprietary estimation framework, updated with the latest available data and insights as of 2026.
Americas Sensor Market Trends and Insights
Drivers Impact Analysis*
| Driver | (~) % Impact on CAGR Forecast | Geographic Relevance | Impact Timeline |
|---|---|---|---|
| Rapid Proliferation of Consumer IoT Devices | +1.20% | North America, with spillover to urban centers in Brazil and Mexico | Medium term (2-4 years) |
| Rising Automation Investments in North and South American Manufacturing | +1.50% | United States, Canada, Mexico manufacturing corridors; São Paulo industrial belt | Long term (≥ 4 years) |
| Government Incentives for Smart-Infrastructure Retrofits | +0.90% | United States (SMART grants), Canada (Infrastructure Bank), Brazil (PAC program) | Medium term (2-4 years) |
| Expansion of Electric and Autonomous Vehicles Requiring Multi-Sensor Suites | +1.80% | United States, Canada; emerging in Brazil, Mexico under MOVER and ProMéxico initiatives | Long term (≥ 4 years) |
| Emergence of Low-Power Edge AI Enabling On-Sensor Analytics | +1.10% | Global, with early adoption in United States tech hubs and Canadian AI research clusters | Short term (≤ 2 years) |
| Growing Demand for Biodegradable Eco-Sensors to Meet ESG Targets | +0.40% | California, European Union subsidiaries in Americas; pilot projects in Chile agriculture | Long term (≥ 4 years) |
| Source: Mordor Intelligence | |||
Rapid Proliferation of Consumer IoT Devices
North American shipments reached 1.2 billion units in 2025, embedding temperature, proximity, and inertial components in wearables and home-automation systems.[1]Consumer Technology Association, “2025 North American IoT Shipments,” cta.tech Retailer mandates around the Matter protocol are pushing vendors to preload Bluetooth Low Energy 5.4 and Thread radios inside MEMS packages, trimming external component counts by 40%. Brazil’s ANATEL streamlined certification under Resolution 715, cutting local launch cycles to three months. These regulatory wins, paired with battery-life expectations beyond five years, are elevating ultra-low-power design to a core purchasing criterion. Retrofit gateways translating Zigbee traffic into Matter added USD 380 million in 2025 revenue, reflecting an interim interoperability opportunity.
Rising Automation Investments in Manufacturing
Industrial robot installations in the United States climbed 12% to 44,303 units during 2024, with force-torque, proximity, and vision sensors enabling safe human-robot collaboration.[2]Association for Advancing Automation, “Robot Installations 2024,” automate.org Sensor content per robot rose 28% in Mexico as vibration-monitoring systems cut unplanned downtime by 35%. Eighty percent of surveyed manufacturers now channel at least one-fifth of capital budgets into smart-factory assets where sensing hardware eclipses software on the priority list. Brazil’s Rota 2030 incentives, offering accelerated depreciation for sensor-equipped machinery, fuel retrofits of pre-2015 production lines.[3]Brazilian Ministry of Development, Industry and Trade, “MOVER Incentive Framework,” gov.br The reshoring of 244,940 U.S. jobs during 2024 further brightens domestic sensor demand.
Government Incentives for Smart-Infrastructure Retrofits
USD 85 million in SMART grants funded sensor-rich traffic systems across 12 U.S. municipalities during 2025.[4]U.S. Department of Transportation, “2025 SMART Grant Recipients,” transportation.gov Canada’s Infrastructure Bank pledged CAD 1.2 billion (USD 900 million) to smart-grid projects with power-quality sensors targeting 90% coverage by 2028. Brazil’s Program de Aceleração do Crescimento earmarked BRL 8.5 billion (USD 1.7 billion) to water-network upgrades featuring pressure and flow sensors. These programs favour modular platforms with open APIs, safeguarding municipalities against vendor lock-in. Chile’s 50,000-unit smart-streetlight pilot demonstrated 42% energy savings, encouraging replication in additional cities.
Expansion Of Electric and Autonomous Vehicles
U.S. electric-vehicle sales hit 1.6 million units in 2025, each embedding roughly 35 sensors for battery, current, and climate control compared with 18 in combustion models. Waymo’s 700-vehicle robotaxi fleet deploys 29 cameras, six LiDAR units, and five radar modules per car, generating four terabytes of data daily. Brazil’s MOVER program cut IPI taxes up to 20% for localized sensor output, prompting Bosch’s USD 150 million São Paulo expansion. ISO 26262 certification timelines stretched to two years, delaying some Level 3 autonomy launches. TE Connectivity’s Hermosillo plant, slated to ship 12 million EV temperature sensors annually from Q3 2026, highlights near-shoring traction.
Restraints Impact Analysis*
| Restraint | (~) % Impact on CAGR Forecast | Geographic Relevance | Impact Timeline |
|---|---|---|---|
| Stringent Regulatory Certification for Safety-Critical Sensors | -0.80% | United States (FDA, NHTSA), Canada (Health Canada, Transport Canada), Brazil (ANVISA) | Medium term (2-4 years) |
| High Capital Expenditure for MEMS Fabrication Lines | -1.10% | United States, with limited impact in South America due to reliance on imports | Long term (≥ 4 years) |
| Supply-Chain Concentration in Exotic Materials (GaN, SiC) | -0.70% | Global, with acute pressure on North American EV and power-electronics sectors | Short term (≤ 2 years) |
| Cyber-Security Liabilities Tied to Sensor Data Integrity | -0.50% | United States, Canada; emerging concern in Brazil's industrial automation sector | Medium term (2-4 years) |
| Source: Mordor Intelligence | |||
Stringent Regulatory Certification for Safety-Critical Sensors
FDA premarket approvals for Class II and III devices averaged 14 months in 2025, with glucose and pressure sensors requiring ±10% accuracy across diverse cohorts. NHTSA’s June 2025 order mandates real-world performance data for any Advanced Driver Assistance System sensor tied to a crash, adding USD 2-3 million in annual compliance for tier-1 suppliers. Brazil’s ANVISA Resolution 822 now obliges local trials even when FDA clearance exists, effectively doubling time-to-market and giving domestic vendors an 18% share in consumer wellness wearables. Divergent rules across the Americas force vendors to maintain multiple product variants and documentation sets, inflating fixed costs and deterring small entrants. Harmonization lags despite regional trade pacts.
High Capital Expenditure for MEMS Fabrication Lines
A 200-millimeter MEMS fab now costs USD 1.2-1.8 billion, locking technology nodes for up to a decade. Intel’s USD 8.5 billion Ohio investment allocates USD 1.1 billion to MEMS but will not yield volume output until late 2027. Smaller startups pivot to fabless models through X-FAB or Teledyne DALSA, yet minimum orders of 50,000 wafers demand USD 15-20 million in working capital. South America lacks indigenous capacity, relying on imports currently subject to Brazil’s 4% temporary tariff that reverts to 16% in December 2026. Capital intensity, therefore, caps regional diversification and slows new-product cadence.
*Our forecasts treat driver/restraint impacts as directional, not additive. The impact forecasts reflect baseline growth, mix effects, and variable interactions.
Segment Analysis
By Parameter Measured: Chemical Sensors Gain Ground in Environmental Compliance
Chemical devices are set for the fastest 6.59% CAGR during 2026-2031 as the United States enforces tighter particulate-matter and ozone standards, adding 1,200 continuous-monitoring sites. Temperature units, which held 19.85% of the Americas sensor market share in 2025, remain pivotal in HVAC and cold-chain logistics yet face price erosion that is moderating growth. Pressure products underpin shale extraction, with 8,500 downhole gauges deployed in the Permian Basin in 2025. Level instrumentation supports municipal water plants that collectively oversee 18 billion gallons daily.
Flow sensing in single-use bioreactors advanced when a disposable thermal mass-flow sensor cut validation cycles to three days. Proximity sensors enable 750,000 mobile robots in Amazon facilities, sustaining high-volume demand. Inertial modules, magnetics, vibration, and environmental detectors each address niche but expanding use cases from smartphones to predictive-maintenance suites, underscoring the broad terrain of the Americas sensor market.


By Mode Of Operation: LiDAR Surges with Autonomous Fleets
Optical sensing kept a 23.43% revenue slice in 2025, spanning photodiodes for smartphones and fiber-optic strain gauges on bridges. The Americas sensor market size attached to LiDAR is projected to rise at 6.96% CAGR on the heels of robotaxi scaling, with Waymo cleared to add 200 vehicles in Texas. Electrical resistance elements continue to anchor industrial temperature loops, shipping 12 million units in 2025. Biosensors broadened horizons when Abbott’s continuous ketone monitor secured FDA clearance in August 2025.
Piezoresistive automotive manifold sensors, stacked CMOS image sensors, capacitive touch controllers, piezoelectric ultrasound elements, and radar ICs together provide depth to the Americas sensor market, supporting applications from infotainment to adaptive cruise control. Collectively, these operational modes frame a versatile toolkit serving consumer, industrial, and mobility ecosystems.
By Sensor Technology: MEMS Dominance Reflects Economies of Scale
MEMS commanded 64.21% of 2025 revenue and should accelerate at 7.11% CAGR as 200-millimeter wafer production pushes per-unit costs under USD 0.40 for high-volume motion sensors. The Americas sensor market size devoted to MEMS reflects rapid uptake of wafer-level packaging and through-silicon vias that shrink modules below 1.5 square millimetres, vital for wearables and hearables. Non-MEMS alternatives, while resilient in extreme-temperature or high-overpressure niches, face slower 4.8% CAGR. Honeywell’s bonded-foil strain gauges still win in environments from -65 °C to 260 °C, a range MEMS struggles to match.
The technology gap is widening as intelligent sensor processing units integrate 32-bit cores onto the die, executing AI tasks at microjoule energy budgets. Adoption of RISC-V inside MEMS inertial sensors exemplifies this convergence of computation and sensing. In contrast, discrete thermistors and bulk piezoresistive designs rely on conventional signal chains, limiting miniaturization potential in mass-market electronics.
By End-User Industry: Medical and Wellness Outpaces Automotive
Automotive users retained 26.17% revenue in 2025, but medical and wellness devices are expected to post the top 7.23% CAGR through 2031 as reimbursement now covers continuous vital-sign monitoring. The Americas sensor market benefits from higher sensor density in electric and autonomous vehicles, yet regulatory drag on Level 3 autonomy tempers growth. Consumer electronics represented 22% share, buoyed by smartphones embedding 14 sensors each and wearables shipping 18 million units in 2025.
Energy and utilities drove smart-meter installations to 112 million by end-2025, relying on voltage and power-quality sensing. Industrial automation, construction, mining, aerospace, and defense each extend the demand curve, whether through predictive-maintenance rollouts on 2.8 million monitored assets or autonomous haulage trucks equipped with 18 sensors apiece. Such diversity underpins resilient, multi-sector growth for the Americas sensor market.
Geography Analysis
The United States generated 38.34% of 2025 revenue on the strength of CHIPS Act-backed fabrication, Midwest automotive output, and medical-device clusters. Ongoing fab construction is set to compress lead times from 16 weeks to eight, favourably impacting the Americas sensor market. Brazil is forecast to grow at 7.15% CAGR as MOVER and Rota 2030 incentives attract localized assembly and Industry 4.0 retrofits. Canada’s 8.2% share rides on oil-sands deployments of 22,000 downhole instruments and parts suppliers clustered in Ontario.
Mexico captured 9.1% in 2025, supported by 140 new near-shored manufacturing facilities averaging USD 1.8 million in sensor spend. Argentina is rebounding on lithium projects that installed 8,500 process sensors, accelerating a 5.8% CAGR.
Chile leverages copper-mine automation, installing 4,200 devices in Chuquicamata to trim operating costs by 11%. The rest of South America, including Colombia and Peru, collectively held 4.8%, propelled by smart-city pilots funded by the Inter-American Development Bank.
Regulatory Landscape
In the United States, sensor suppliers selling into mobility and infrastructure programs face tightening procurement and cybersecurity guardrails. The Securing Infrastructure from Adversaries Act (S. 4000), introduced in March 2026, restricts US Department of Transportation procurement of certain LiDAR technologies for actions on or after June 30, 2026, which increases scrutiny of sensor origin and approved vendor lists for roadway and transit deployments. In parallel, the FCC Cyber Trust Mark moved forward as a voluntary IoT cybersecurity labeling program with ioXt Alliance named lead administrator in April 2026, while NIST finalized IR 8259 Revision 1 in April 2026. Together, these steps reinforce baseline cybersecurity expectations for connected sensor products and shift manufacturers toward stronger secure-by-design evidence and documentation.
Across the Americas, safety-critical sensors are also shaped by sector regulators and compliance timelines, especially in automotive and medical devices. The report context highlights multi-agency certification burdens (for example, FDA and NHTSA in the United States, Health Canada and Transport Canada in Canada, and ANVISA in Brazil), which can lengthen validation cycles for sensors tied to ADAS, diagnostics, and monitoring. These dynamics increase the value of harmonized test data, traceability, and multi-market certification packages, and they intersect with domestic-content and public-procurement requirements that favor localized manufacturing and verifiable supply chains.
Competitive Landscape
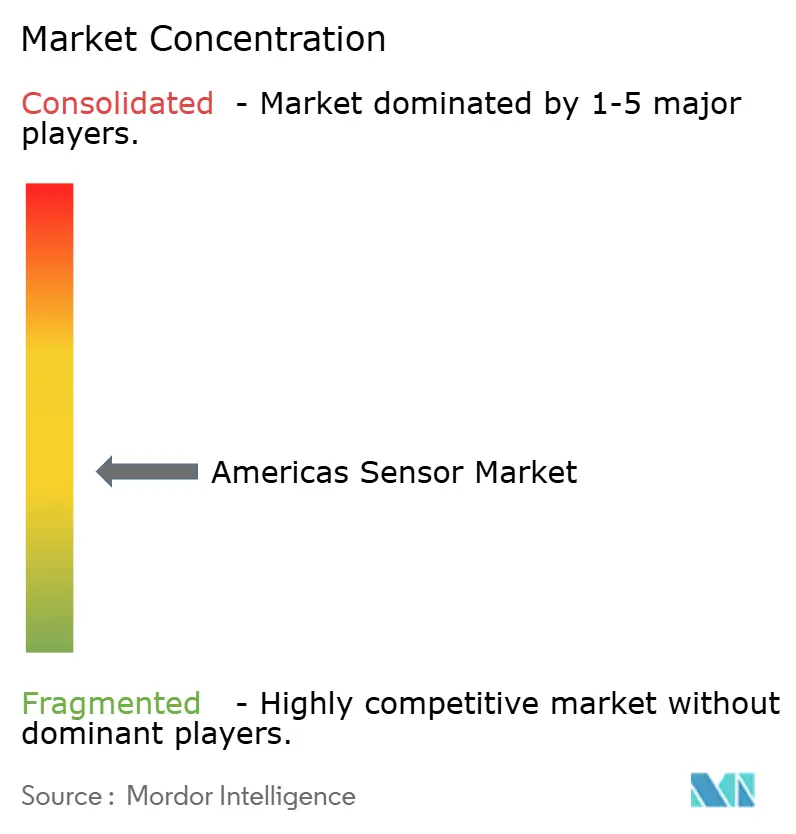
The top ten suppliers held 52% of 2025 revenue, indicating moderate concentration that still allows specialized entrants to gain niche positions. Integrated analog front ends from Texas Instruments and Analog Devices now merge sensor interfaces, analog-to-digital converters, and signal conditioning, shaving customer design cycles to four months.
Pure-play firms such as Sensata and TE Connectivity expand vertically into module assembly and analytics to capture system-level margins. Patent filings hit 4,800 in 2025, emphasizing edge-AI inference and biodegradable substrates.
Disruptors include Wiliot, which raised USD 200 million for battery-free Bluetooth tags harvesting ambient RF, slashing operating costs in cold-chain logistics. Automotive original-equipment manufacturers like Tesla tape-out proprietary radar ASICs that trim per-vehicle sensor spend by USD 120 while boosting classification accuracy. Standards bodies continue to shape competition; firms active in ISO and IEC working groups can align new formats with their product roadmaps, erecting subtle entry barriers.
Americas Sensor Industry Leaders
ABB Limited
NXP Semiconductors
Honeywell International Inc.
Texas Instruments Incorporated
Siemens AG
- *Disclaimer: Major Players sorted in no particular order

Market Opportunities and Future Outlook
Policy-driven infrastructure spending and procurement constraints are creating whitespace for compliant sensing platforms in transportation, smart-city initiatives, and industrial decarbonization projects. The US DOT-facing LiDAR restriction embedded in S. 4000 (actions on or after June 30, 2026) and the expansion of domestic-content requirements increase demand for traceable, qualifying sensor alternatives, including LiDAR designs that can be positioned for federally funded deployments. Ouster's statement on Build America, Buy America (BABA) compliance for its Rev8 LiDAR sensors in June 2026 reinforces that product qualification is being tied to public-infrastructure purchasing pathways rather than only commercial automotive cycles.
Manufacturing localization and portfolio consolidation are also creating opportunities for integrated sensor modules and US-produced components that shorten lead times and simplify certification. Texas Instruments announced plans in 2025 to invest more than USD 60 billion in US semiconductor manufacturing capacity, and ABB announced a USD 110 million US manufacturing investment; both support onshore availability of foundational electronics and industrial measurement hardware used in sensor systems. Separately, STMicroelectronics' agreement to acquire NXP's MEMS sensors business for USD 950 million illustrates continued consolidation around MEMS and automotive-grade sensing, leaving room for differentiated entrants in application-tuned modules, including secure IoT sensors mapped to NIST IR 8259 Rev. 1 and FCC labeling workflows.
Recent Industry Developments
- June 2026: ABB Limited expanded its non-invasive temperature sensing portfolio by introducing NINVA Integrated, Remote, and Compact models. The expansion broadens ABB's industrial sensor footprint and enhances remote sensing capabilities across critical process industries.
- March 2026: NXP Semiconductors launched the SAF8444 automotive radar system-on-chip targeting L2 and L2+ driver assistance systems. The radar SoC strengthens NXP's position in automotive perception and integrated radar processing.
- February 2026: ABB Limited launched a fully integrated gas analyzer package for CCUS applications, including the Sensi+ CCUS laser gas analyzer. The CCUS gas analysis solution addresses decarbonization monitoring needs and expands ABB’s sensing portfolio in industrial decarbonization projects.


Research Methodology Framework and Report Scope
Market Definition and Coverage
For this study, the Americas sensor market is defined as the revenue generated from sensor devices shipped and used across North America and South America, counted at the point of sale to OEMs and industrial customers, and then aggregated across major end uses.
Scope exclusions: We exclude downstream software analytics platforms, stand-alone gateways, and installation or maintenance services unless they are inseparable from the sensor hardware sale.
Segmentation Overview
- By Parameter Measured
- Temperature
- Pressure
- Level
- Flow
- Proximity
- Environmental
- Chemical
- Inertial
- Magnetic
- Vibration
- Other Parameter Measured
- By Mode of Operation
- Optical
- Electrical Resistance
- Biosensor
- Piezoresistive
- Image
- Capacitive
- Piezoelectric
- LiDAR
- Radar
- Other Mode of Operation
- By Sensor Technology
- MEMS Sensors
- Non-MEMS Sensors
- By End-User Industry
- Automotive
- Consumer Electronics
- Smartphones
- Tablets, Laptops and Computers
- Wearable Devices
- Smart Appliances
- Other Consumer Electronics
- Energy and Utilities
- Industrial Automation
- Medical and Wellness
- Construction, Agriculture and Mining
- Aerospace
- Defense and Security
- By Geography
- North America
- United States
- Canada
- South America
- Brazil
- Mexico
- Argentina
- Chile
- Rest of South America
- North America
Data Sources, Market Sizing, and Validation
Desk Research
To set the market boundary clearly, we first mapped what is counted as a sensor device and where it is typically sold across the Americas. We relied on public sources that explain production, trade, and end market demand, such as US Census Bureau trade statistics, US Bureau of Economic Analysis industry output data, US International Trade Commission data tools, and Statistics Canada manufacturing and trade tables.
Next, we used sector indicators to anchor demand by key consuming industries, since sensors generally track output cycles. We used Federal Reserve industrial production data as an input for broader industrial timing, energy and emissions related datasets from agencies such as the US EPA, vehicle production and registration releases from transport departments, and peer reviewed engineering literature that helps validate adoption patterns by sensor type. Company annual reports, investor decks, and reputable press were used to confirm product mixes and regional exposure, while paid subscriptions for company financials, patents, and shipment level trade views were used selectively where they tightened assumptions. The desk research sources listed here are illustrative, and many other public and paid references were also used for collection, cross checks, and clarification.
Primary Interviews and Surveys
Primary work was used to pressure test what desk sources cannot show well, mainly pricing movement, mix shifts between sensor technologies, and how design wins translate into shipment volumes. We spoke with participants across the value chain, including component suppliers, module and device makers, OEM procurement teams, and industry specialists, and then reconciled differences in demand realities across North America and South America.
Distribution of primary research fieldwork respondents
| Company type | Respondent position | Region |
|---|---|---|
| Top tier: 30% | CXOs: 12% | |
| Mid tier: 56% | Functional/Unit leaders: 28% | |
| Smaller Players: 14% | Managers: 60% |
Market-Sizing & Forecasting
The sizing starts from a top-down build where production and trade signals, together with end industry output, are used to reconstruct the addressable sensor demand pool in the Americas, and then value is formed using typical price bands. After that, we corroborate totals with selective bottom-up checks, such as sampled ASP times shipment volumes for key sensor families, plus channel feedback on inventory swings. The model is then adjusted when gaps persist.
Inputs that commonly move the model include vehicle and EV build trends, which drive ADAS and powertrain sensing demand, factory automation spending and utilization rates, which lift pressure, temperature, and motion sensing usage, semiconductor and electronics output (which affects supply cycles and lead times), medical device production activity, and cross-border import patterns for sensor categories that are not produced locally at scale. Where a segment has limited public visibility, the gap is handled using proxy indicators like end product unit volumes, typical sensor count per unit, and a conservative price progression that is validated with interview feedback.
Forecasts were developed using scenario analysis supported by a light multivariate regression. The future path is linked to industrial output, auto production, and electronics shipment expectations, and then adjusted with expert views on normalization of lead times and expected ASP erosion in mature sensor types. Assumptions are documented so the same steps can be repeated and stress tested when new indicators are released.
Data Validation & Update Cycle
Results are checked in layers so that a single noisy signal does not distort the outcome. We compare the final value trend against independent indicators, such as import value movement, electronics output cycles, and end industry shipment momentum, and then outliers are reviewed by a second analyst before sign-off.
If large variances appear, follow-up calls are triggered to re-check assumptions like sensor content per end product, pricing ranges, or the timing of large program ramps. Reports are refreshed annually, and interim adjustments are made when material events occur, such as regulatory changes, major capacity additions, or sudden demand shocks. Before delivery, a final pass is completed so clients receive the most current view available at that time.
Mordor Intelligence's Americas Sensor Market Sizing Compared With Other Published Estimates
It is normal to see different published market sizes for sensors, since authors do not always count the same products, the same countries, or the same pricing point in the value chain. Some estimates also mix shipment value with installed base value, and that alone can move the number by several billions.
In this study, the biggest drivers behind gaps are usually what gets grouped as a sensor, how automotive and industrial use is split, and whether South America is modeled with the same level of detail as North America. Differences also come from how average selling prices are moved forward, since some figures assume flat pricing while others assume faster erosion in high volume sensor types, and from refresh timing when demand is swinging.
Benchmark comparison
| Source | Market Size | Gaps in Research Methodology |
|---|---|---|
| Mordor Intelligence | USD 40.60 B (2025) | |
| Industry Association A | USD 37.10 B (2025) | Often reported as member shipment value for North America only, and South America is treated as a small add-on using older import ratios. |
| Trade Journal B | USD 45.80 B (2025) | Typically broadens scope to include sensor modules and adjacent embedded electronics, and applies a more aggressive near-term demand bounce-back assumption. |
The spread in the table is largely explained by scope and pricing choices rather than math errors. By keeping the count limited to sensor device revenues, matching trade and output signals to end industry consumption, and refreshing ASP assumptions using recent interview feedback, the 2025 total is anchored to a repeatable set of checks, a modeling choice applied by Mordor Intelligence.


Key Questions Answered in the Report
How large is the Americas sensor market in 2026?
The market is projected at USD 43.24 billion in 2026.
Which parameter segment is growing fastest across the region?
Chemical sensors lead with a forecast 6.59% CAGR through 2031.
Why are MEMS devices dominant in the Americas?
Wafer-level economies of scale push per-unit costs below USD 0.40, giving MEMS 64.21% share in 2025 and a 7.11% growth trajectory.
What geographic area offers the highest growth potential?
Brazil is forecast to expand at 7.15% CAGR, spurred by automotive and Industry 4.0 incentives.
How will new IoT security rules affect suppliers?
From March 2026, NIST mandates cryptographic attestation, adding 12-15% to compliance costs yet strengthening device integrity.
What is the outlook for sensor demand in autonomous vehicles?
LiDAR and multi-sensor suites should accelerate as U.S. robotaxi fleets expand, supporting a 6.96% CAGR for LiDAR through 2031.
Page last updated on:






