
Americas Semiconductor Device Market Size and Share
Market Overview
| Study Period | 2020 - 2031 |
|---|---|
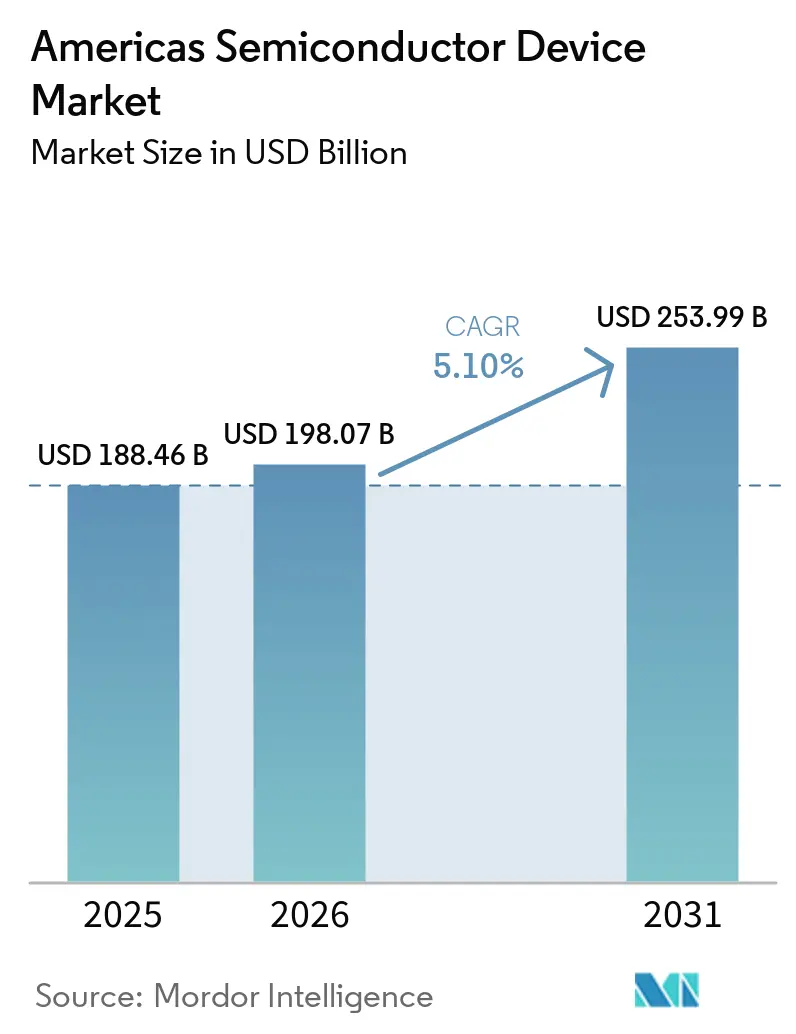
| Base Year Market Size (2025) | USD 188.46 Billion |
| Market Size (2026) | USD 198.07 Billion |
| Market Size (2031) | USD 253.99 Billion |
| Growth Rate (2026 - 2031) | 5.10 % |
| Fastest Growing Market | South America |
| Largest Market | North America |
Major Players *Disclaimer: Major Players sorted in no particular order Image © Mordor Intelligence. Reuse requires attribution under CC BY 4.0. | |
Americas Semiconductor Device Market Analysis by Mordor Intelligence
The Americas semiconductor device market size is expected to grow from USD 188.46 billion in 2025 to USD 198.07 billion in 2026 and is forecast to reach USD 253.99 billion by 2031 at 5.1% CAGR over 2026-2031. Recent investment pledges under the CHIPS Act, the race for artificial-intelligence (AI) leadership, and a re-shoring policy push redefined competitive priorities across the supply chain.
Key Report Takeaways
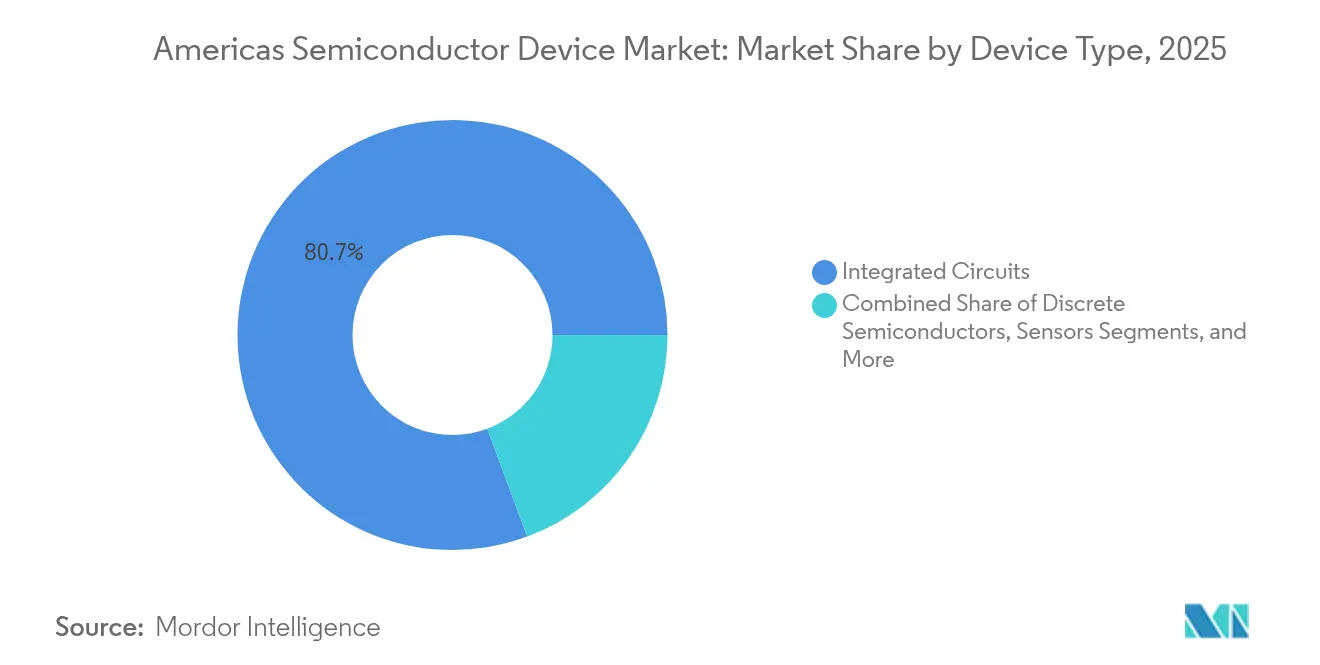
- By device type, integrated circuits held 80.65% of the Americas semiconductor device market share in 2025; the segment was forecast to expand at a 7.45% CAGR through 2031.
- By region, North America accounted for 94.10% revenue in 2025, while South America was set to grow at 7.7% CAGR over 2026-2031.
- By technology node, ≥65 nm processes retained a 53.85% share in 2025, yet ≤5 nm capacity was projected to climb at a 14.3% CAGR to 2031.
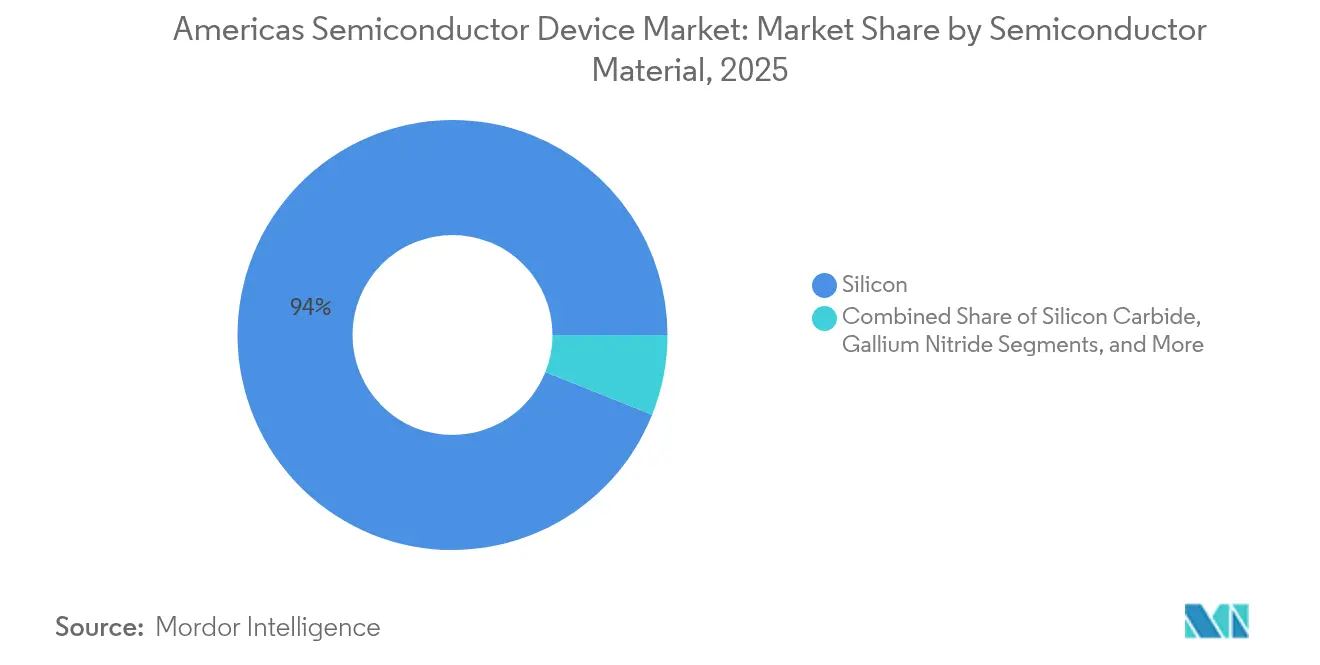
- By semiconductor material, silicon commanded 93.95% share in 2025, whereas silicon-carbide devices were advancing on a 18.7% CAGR to 2031.
- By end-user vertical, the communication sector led with 30.15% revenue in 2025; automotive semiconductors were forecast to grow at 8.75% CAGR to 2031.
Note: Market size and forecast figures in this report are generated using Mordor Intelligence’s proprietary estimation framework, updated with the latest available data and insights as of 2026.
Market Trends and Insights
Drivers Impact Analysis of Americas Semiconductor Device Market*
| Driver | (~) % Impact on CAGR Forecast | Geographic Relevance | Impact Timeline |
|---|---|---|---|
| CHIPS Act-Driven Fabrication Capacity Expansion in North America | +1.8% | North America, with spillover effects to Mexico | Medium term (2-4 years) |
| ADAS-Enabled Vehicle Demand in Mexico and Brazil | +0.9% | Mexico, Brazil | Medium term (2-4 years) |
| 5G Stand-Alone Roll-out Elevating RF Front-End IC Consumption | +1.2% | North America, with gradual adoption in South America | Short term (≤ 2 years) |
| Hyperscale AI Server Build-out Increasing HBM and GPU Requirements | +1.5% | North America | Short term (≤ 2 years) |
| Renewable-Energy Incentives Boosting Power Semiconductor Adoption in Brazil and Chile | +0.7% | Brazil, Chile | Medium term (2-4 years) |
| Nearshoring of Backend Assembly and Test to Mexico | +0.6% | Mexico | Medium term (2-4 years) |
| Source: Mordor Intelligence | |||
CHIPS Act-Driven Fabrication Capacity Expansion in North America
Massive federal incentives under the CHIPS and Science Act unlocked more than USD 450 billion in private commitments that aimed to triple domestic wafer output by 2032.[1] Intel secured USD 8.5 billion in grants for multistate expansions, while TSMC received USD 6.6 billion for its two Arizona megafabs. Supplier ecosystems clustered around those projects, as over 40 tier-one chemical and equipment firms co-located nearby to shorten lead times. These clusters improved logistics costs and accelerated knowledge transfer, yet a 60% dependence on imported specialty gases and chemicals still forced new capital outlays for on-shore materials capacity. Ultimately, the investment surge positioned the Americas semiconductor device market for higher self-sufficiency without fully insulating it from resource constraints.
ADAS-Enabled Vehicle Demand in Mexico and Brazil
Electrification and Level-2 driver-assistance adoption pushed automotive semiconductor content per vehicle up 35% in leading Mexican and Brazilian assembly lines during 2024. Local plants integrated radar, lidar, and image-sensor arrays that required high-reliability microcontrollers and power devices. Bosch and Continental pursued joint ventures for on-shore packaging lines to mitigate import tariffs that could rise to 25%. Policymakers signalled additional fiscal credits for auto-grade chips, encouraging further capacity moves. As a result, automotive orders buffered the Americas semiconductor device market against consumer-electronics cyclicality and created a dependable mid-term revenue uplift.
5G Stand-Alone Roll-out Elevating RF Front-End IC Consumption
North American carriers budgeted more than USD 35 billion for 5G networks in 2025 alone as millimetre-wave nodes densified urban coverage while mid-band filled suburban gaps. Each 5G handset carried 25% more RF value than its 4G predecessor, multiplying demand for acoustic filters, power amplifiers, and antenna tuners. Gallium-nitride technology captured share because it sustained higher voltages at mmWave frequencies, yet defense and automotive buyers competed for the same GaN wafer inventory. Supply tightness pushed lead times on select RF front-end devices past 40 weeks in early 2025, demonstrating how wireless upgrades directly amplified revenue momentum for the Americas semiconductor device market.
Hyperscale AI Server Build-out Increasing HBM and GPU Requirements
AI model-training clusters required unprecedented bandwidth and memory density, sending high-bandwidth memory (HBM) unit shipments up 70% year over year in 2025. A single new U.S. data center installed 10,000 AI accelerators and 80,000 HBM stacks, translating into more than USD 500 million of incremental chip content. TSMC introduced System-on-Wafer production to triple compute density by 2027, an innovation that compounded demand for leading-edge logic and advanced packaging. Traditional CPU vendors raced to redesign products around heterogenous compute, while Qualcomm entered the data-centre processor arena with devices tuned to Nvidia accelerator fabrics. The hyperscale capex wave, therefore, reinforced the high-growth outlook embedded in the Americas semiconductor device market.
Restraints Impact Analysis of Americas Semiconductor Device Market*
| Restraint | (~) % Impact on CAGR Forecast | Geographic Relevance | Impact Timeline |
|---|---|---|---|
| Water and Power Supply Constraints in US Southwest Fabs | -0.8% | U.S. Southwest (Arizona, New Mexico, Texas) | Long term (≥ 4 years) |
| Scarcity of Skilled Semiconductor Engineers across the Americas | -1.1% | North America, with an emerging impact in South America | Medium term (2-4 years) |
| Export Controls on Advanced Equipment and IP | -0.7% | North America | Medium term (2-4 years) |
| Volatile Silicon Wafer Pricing due to Limited Regional Supply | -0.5% | Americas-wide | Short term (≤ 2 years) |
| Source: Mordor Intelligence | |||
Water and Power Supply Constraints in U.S. Southwest Fabs
New fabs in Arizona and Texas consumed up to 10 million gallons of ultrapure water daily, creating direct competition with municipal users and adding pressure to the United States semiconductor market. Intel invested USD 200 million in reclamation systems that recycled 90% of process water, yet those eco-projects added 2% to operating expenses and did not fully mitigate long-term drought risk. Rising electricity demand forced utilities to accelerate grid upgrades, further lifting production costs. These constraints reduced effective capacity gains from CHIPS Act incentives and threatened the cost competitiveness of the Americas semiconductor device market over the long horizon.
Scarcity of Skilled Semiconductor Engineers across the Americas
The Semiconductor Industry Association projected a 33% rise in chip-sector employment by 2030, yet warned that 67,000 vacancies could remain unfilled. Field-service engineer shortages delayed tool installations by 45 days, slowing ramp schedules at greenfield fabs. Universities expanded chip curricula—Purdue’s enrolment in semiconductor design courses rose eightfold—but the talent pipeline lagged investment timetables. Firms accelerated automation and cross-training programs to extract productivity from limited human capital, but wage inflation persisted. Unless immigration hurdles ease or vocational initiatives scale rapidly, workforce scarcity will continue to subtract growth potential from the Americas semiconductor device market.
*Our forecasts treat driver/restraint impacts as directional, not additive. The impact forecasts reflect baseline growth, mix effects, and variable interactions.
Americas Semiconductor Device Market Segment Analysis
By Device Type:
Integrated Circuits Extend Leadership Amid AI UpsurgeIntegrated circuits captured 80.65% revenue in 2025 and advanced on a 7.45% CAGR projection, keeping the Americas semiconductor device market size firmly weighted toward complex logic and memory. AI training, autonomous driving, and industrial edge computing each increased silicon content per system, lifting average selling prices for high-bandwidth memory and inference accelerators. Discrete power devices, though smaller in value, gained strategic importance as silicon-carbide and gallium-nitride switches replaced silicon IGBTs in electric vehicles, improving powertrain efficiency and thermal margins. The Americas semiconductor device industry also saw optoelectronics broaden into lidar and image-sensing, providing incremental diversification against the cyclic smartphone segment.
A widening array of embedded applications drove resilient sensor volumes, yet price pressure persisted because many designs relied on mature process lines with fully depreciated assets. Analog ICs offered stable cash flow due to legacy automotive and industrial sockets that require decades-long supply continuity. Meanwhile, logic and memory displayed higher volatility in line with hyperscale capex cycles. Despite those swings, the integrated-circuits category delivered steady ecosystem investment, reinforcing design talent retention inside the Americas semiconductor device market.

By Wafer Size:
300 mm Entrenchment and 450 mm AmbitionIn 2025, 300 mm lines accounted for 57.60% of production and underpinned nearly every leading-edge node, anchoring the largest slice of the Americas semiconductor device market size. Foundries noted 30% lower unit costs after migrating mature analog products from 200 mm to 300 mm substrates, widening gross-margin cushions. Equipment makers concurrently refined 450 mm pilot tools; although that diameter remained niche, it logged a 16.4% CAGR outlook to 2031 as manufacturers chased further economies of scale.
≤200 mm fabs preserved relevance because automotive and industrial buyers valued proven reliability over raw compute density. These fabs also benefited from the near-shoring of backend assembly in Mexico, which reduced cycle times for legacy components. The Americas semiconductor device market continued to balance investments across diameters to hedge against cyclical oversupply at any single node or wafer size.
By Technology Node:
Legacy Resilience Beside ≤5 nm SprintThe ≥65 nm category preserved 53.85% of Americas semiconductor device market share in 2025, leveraging fully depreciated tools and long-established design ecosystems that kept unit costs low. In contrast, the ≤5 nm segment was forecast to surge at a 14.3% CAGR from 2026 to 2031, driven by AI accelerators, graphics processors and high-performance mobile chipsets that demand extreme-ultraviolet lithography. This bifurcation helped stabilize the Americas semiconductor device market size because mature nodes served industrial and automotive customers while leading-edge capacity captured premium margins from cloud providers.
Mid-range nodes between 45 nm and 16 nm provided a cost-performance bridge for advanced driver assistance systems and secure microcontrollers, ensuring design optionality across price points. Foundries and equipment makers formed joint pilot lines to spread the USD 15 billion capex burden required for next-generation lithography tools. TSMC’s forthcoming A16 nanosheet process, announced for 2026 production, promised an 8-10% speed uplift and up to 20% power reduction over its prior node, underscoring the cadence of innovation at the leading edge. Meanwhile, an industrial-automation supplier migrated control ICs to 90 nm silicon and cut bill-of-material costs 40% without sacrificing performance, illustrating that optimal node choice remains application-specific. This coexistence of legacy, mid-range and bleeding-edge processes diversified revenue streams and cushioned the Americas semiconductor device market against single-node volatility.
By Semiconductor Material:
Silicon-Carbide Gains in Power ElectronicsSilicon devices still controlled 93.95% revenue in 2025, but silicon-carbide volumes expanded on a 18.7% CAGR path, propelled by EV inverters and high-power solar installations. A leading automaker replaced silicon IGBTs with SiC MOSFETs, improving driving range 3% and trimming cooling weight 25%, an outcome that reinforced the performance narrative for wide-band-gap adoption. The U.S. Commerce Department earmarked USD 79 million for SiC substrate expansion to address material bottlenecks.
Gallium-nitride meanwhile took early market share in 5G power amplifiers and fast chargers. Gallium-arsenide and indium-phosphide preserved niche positions in photonics and high-frequency defense systems. The wider material palette increased supply-chain complexity, yet it unlocked differentiated performance tiers that raised blended average selling prices within the Americas semiconductor device market.
By End-User Vertical:
Automotive Outpaces CommunicationCommunication infrastructure recorded 30.15% revenue in 2025 on persistent 5G rollouts, but automotive electronics now posted the fastest 8.75% CAGR to 2031. EV drivetrains, lidar sensor arrays and zonal architectures multiplied chip counts above USD 2,000 per premium vehicle. Industrial automation sustained steady demand as manufacturers deployed Industry 4.0 retrofits that required robust microcontrollers and edge AI inference. Consumer electronics volumes remained large, though growth moderated because handset refresh cycles lengthened.
Computing and storage rebounded thanks to AI servers adopting HBM and custom accelerators, lifting memory bit demand. Aerospace-and-defense remained a smaller slice yet paid premium margins for radiation-hardened or ultra-reliable components. Healthcare adoption of semiconductor-rich imaging systems added a future upside lever. Collectively, vertical diversification lessened cyclical swings for the Americas semiconductor device market.
Geography Analysis
Arizona, Texas and New York Semiconductor Device Market
North America dominated the Americas semiconductor device market with 94.10% revenue in 2025, a position reinforced by CHIPS Act incentives that sought to triple wafer capacity by 2032. Arizona, Texas, and New York attracted multi-billion-dollar fab commitments and fostered supplier agglomerations that shortened development cycles. Nevertheless, water scarcity and a looming 67,000-engineer talent gap threatened to dilute the long-term ROI of that capacity build.
South America and Mexico Semiconductor Device Market
South America strengthened its role as a growth engine with an 7.7% CAGR outlook for 2026-2031. Brazil’s automotive electrification surge and industrial IoT upgrades increased local chip demand, while its universities nurtured design centers for region-specific microcontrollers. Mexico leveraged USMCA trade certainty and cost advantages to absorb backend assembly and test lines relocating from Asia, trimming time-to-market and logistics charges for North American customers. Chile’s renewable-energy boom further amplified SiC and GaN imports, supporting new regional demand pools that broadened the Americas semiconductor device market size.
United States Semiconductor Device Market
Cross-border policy collaboration also intensified. The U.S. State Department and Mexico formalized a semiconductor supply-chain working group that addressed skills, infrastructure, and security requirements. Regional governments explored synchronized incentives to avoid subsidy competition, reflecting the strategic importance of supply resilience for the Americas semiconductor device market.
Regulatory Landscape
The United States sets the pace for semiconductor-device policy across the Americas through CHIPS and Science Act execution led by the U.S. Department of Commerce, alongside the NIST-led CHIPS for America programs that shape R&D and workforce activity. In January 2026, the White House initiated a two-phase trade action covering imported semiconductors, semiconductor manufacturing equipment, and certain derivative products, including a 25% ad valorem tariff on specified items with exceptions tied to U.S. supply-chain buildouts.
Industry coordination has also moved toward implementation details and allied trade. SEMI’s 2026 U.S. policy strategy focused on stable IP protection, clearer incentive conditions, and export-control approaches aligned with alliances, reflecting how compliance and permitting certainty affect fab ramp timelines and supplier localization decisions across North America and nearshore manufacturing corridors.
Value Chain Analysis
The Americas semiconductor device value chain runs from upstream materials (silicon wafers, specialty chemicals and gases, and compound-semiconductor substrates) to front-end wafer fabrication, back-end assembly and test, and advanced packaging before downstream integration into systems across communication, computing, automotive, industrial, and defense. CHIPS Act incentives and related NIST program infrastructure are pulling more steps onshore or nearshore, while U.S. Department of Defense initiatives such as the Microelectronics Commons support lab-to-fab prototyping and transition pathways that connect R&D outputs to manufacturable designs.
At the firm level, the region includes integrated manufacturers and fabless device designers that depend on global foundry and OSAT capacity. NVIDIA discloses reliance on third-party manufacturers, assemblers, and packagers for SoC products, and its platform supply ecosystem spans multiple semiconductor peers, highlighting cross-company dependencies even among market leaders. Nearshoring of backend assembly and test to Mexico shortens cycle times for mature-node and automotive-grade devices, while advanced packaging capability is increasingly central for AI accelerators and high-bandwidth memory-centric systems.
Competitive Landscape
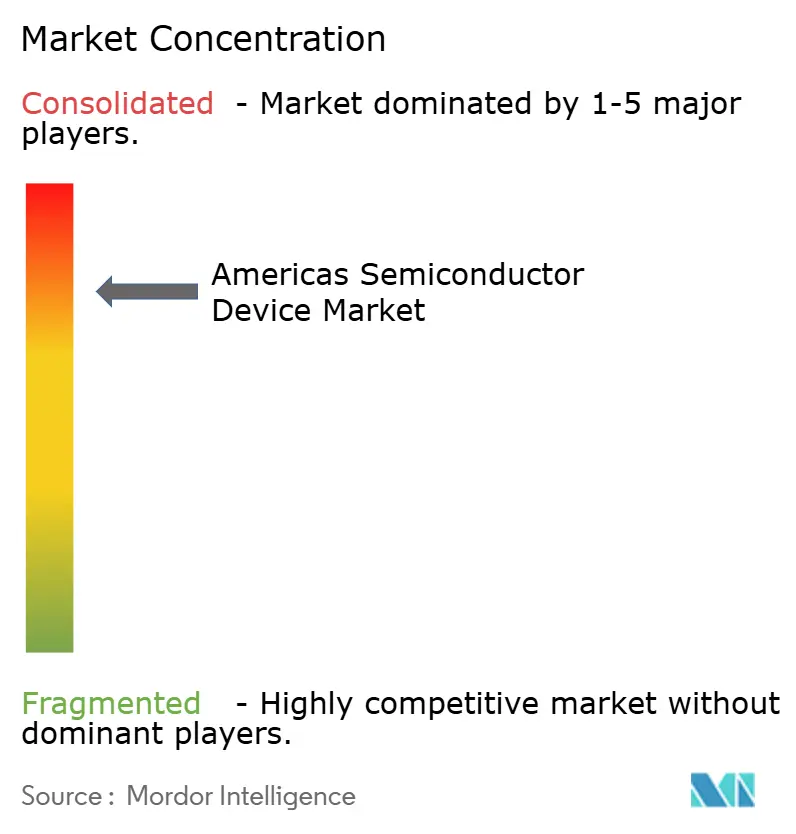
Market structure varied by segment. Memory and ≤5 nm logic remained highly concentrated because few firms managed the USD 15 billion capex per fab needed for extreme-ultraviolet lithography. Conversely, discrete and sensor categories were fragmented as entry costs were lower, and technology cycles were slower. To secure differentiated performance, hyperscalers, automotive OEMs, and even industrial firms invested in custom-silicon programs that deepened vertical integration.
Partnership models evolved in response to soaring tape-out and equipment costs. Foundries collaborated with equipment makers on jointly funded pilot lines that derisked technology ramps. System companies joined multi-party packaging consortia to accelerate chiplets and 3D integration. These alliances re-distributed capital intensity across the ecosystem, reinforcing the innovation cadence that underpinned the Americas semiconductor device market.
Mergers and acquisitions continued. Synopsys agreed to acquire Ansys for USD 35 billion to merge simulation with electronic-design-automation workflows, an action expected to streamline chip-package-system co-optimization. Qualcomm’s launch of data center CPUs interoperable with Nvidia accelerators signalled fresh rivalry in AI infrastructure. Infineon preserved a 13.5% share of the global automotive chip revenue, confirming leadership in vehicle power and connectivity solutions.[4] Competitive intensity, therefore, remained high, yet collaborative frameworks emerged to temper financial risk.
Americas Semiconductor Device Industry Leaders
-
Intel Corporation
-
Qualcomm Incorporated
-
NVIDIA Corporation
-
Texas Instruments Incorporated
-
Broadcom Inc.
- *Disclaimer: Major Players sorted in no particular order
Americas Semiconductor Device Market Companies Covered in this Report
- Intel Corporation
- NVIDIA Corporation
- Qualcomm Incorporated
- Micron Technology Inc.
- Texas Instruments Incorporated
- Broadcom Inc.
- Advanced Micro Devices Inc.
- onsemi (ON Semiconductor Corporation)
- NXP Semiconductors N.V.
- Infineon Technologies AG
- STMicroelectronics N.V.
- Analog Devices Inc.
- Microchip Technology Inc.
- Skyworks Solutions Inc.
- GlobalFoundries Inc.
- Taiwan Semiconductor Manufacturing Company Limited
- Samsung Electronics Co., Ltd.
- Marvell Technology Inc.
- Monolithic Power Systems
- Wolfspeed Inc.
- Lattice Semiconductor
Market Opportunities and Future Outlook
A key opportunity is expanding domestic advanced manufacturing and packaging capacity, along with the supporting ecosystem for materials, specialty gases, and advanced packaging services. In July 2026, NIST highlighted TSMC’s additional USD 100 billion investment, bringing its total to USD 265 billion for 12 advanced manufacturing and packaging facilities in the United States, which signals that leading-edge and packaging localization is moving from policy intent into multi-site build programs.
AI infrastructure value continues to concentrate in high-performance logic, networking, and packaging, creating demand for device suppliers that can deliver power-efficient compute and high-bandwidth interconnect at scale. Broadcom’s disclosure of USD 10.8 billion in AI semiconductor revenue in Q2 2026 (143% year-over-year growth) provides a measurable demand reference for AI-driven silicon in the region. Alongside NSTC-linked R&D grants, NSF Engines Phase 2 execution, and NIST/EDA workforce-development solicitations, trade actions initiated in January 2026 also raise the premium on qualifying domestic or nearshore sources for targeted device categories and manufacturing inputs.
Recent Industry Developments in Americas Semiconductor Device Market
- June 2026: Qualcomm Incorporated unveils Dragonfly data center portfolio, including Dragonfly C1000 CPU, High Bandwidth Compute tech, and Dragonfly AI300 inference accelerator. The launch expands AI data center infrastructure options and accelerates deployment of integrated CPU and accelerator solutions.
- June 2026: Intel Corporation demonstrates a disaggregated inference system in Los Angeles using Xeon 6 processors, SambaNova SN40 RDUs, and NVIDIA Blackwell GPUs. The demonstration broadens AI inference deployment stacks and enhances cross vendor collaboration potential.
- April 2026: Intel Corporation Xeon 6 selected as host CPU for NVIDIA DGX Rubin NVL8 systems. The arrangement strengthens Intel-NVIDIA collaboration in AI infrastructure.
Americas Semiconductor Device Market Report Scope and Research Methodology
Market Definition and Coverage
For this report, the market is defined as revenues generated from semiconductor devices sold into end users across the Americas, covering both integrated and discrete device categories and the related supporting device families used in electronic systems.
Scope exclusions: We exclude semiconductor manufacturing equipment and materials such as wafers, chemicals, gases, and fab services, even when they are sold alongside device supply agreements.
Segments Covered in This Report
- By Device Type
- Discrete Semiconductors
- Optoelectronics
- Sensors
- Integrated Circuits
- Analog ICs
- Logic ICs
- Memory ICs
- Micro ICs
- Microprocessors (MPU)
- Microcontrollers (MCU)
- Digital Signal Processors (DSP)
- By Wafer Size
- ≤ 200 mm
- 300 mm
- ≥ 450 mm
- By Technology Node
- ≥ 65 nm
- 45–28 nm
- 22–16 nm
- 10–7 nm
- ≤ 5 nm
- By Semiconductor Material
- Silicon (Si)
- Silicon Carbide (SiC)
- Gallium Nitride (GaN)
- Others (GaAs, InP, etc.)
- By End-User Vertical
- Automotive
- Communication (Wired and Wireless)
- Consumer Electronics
- Industrial
- Computing and Data Storage
- Aerospace and Defense
- Healthcare and Medical Devices
- By Region
- North America
- United States
- Canada
- South America
- Brazil
- Argentina
- Mexico
- Rest of South America
- North America
Data Sources, Market Sizing, and Validation
Desk Research
Desk research was used to set the market boundaries and to build a consistent base layer of numbers that can be checked across years and countries. We leaned on public, repeatable time series such as World Semiconductor Trade Statistics regional billings, Semiconductor Industry Association publications, and national statistics that help explain electronics output and trade flows.
To make the regional split and trend logic more practical, additional reference points were pulled from sources such as USITC trade data, UN Comtrade, OECD indicators, and patent databases for directional activity in key device areas. We also reviewed annual reports, 10-K style filings, investor decks, and credible business press to understand demand drivers like AI servers, automotive electronics, and industrial automation, and we used paid subscriptions for company financials, news and financials, semiconductor value chain mapping, and patents to fill gaps that are not clearly shown in public tables. These desk sources are illustrative and not exhaustive, and many other public references were also used for data collection, validation, and clarification.
Primary Interviews and Surveys
Primary work was run to confirm what the desk numbers could not fully explain, especially on device mix changes, pricing movement, and the timing of demand swings across the Americas. We spoke with a balanced set of supply side and channel informed experts, as well as buyers tied to computing, automotive, industrial, and communications demand, and then the feedback was used to adjust assumptions that showed wide variance by country or end use.
Distribution of primary research fieldwork respondents
| Company type | Respondent position |
|---|---|
| Top tier: 35% | CXOs: 15% |
| Mid tier: 46% | Functional/Unit leaders: 25% |
| Smaller Players: 19% | Managers: 60% |
Market-Sizing & Forecasting
Market size is built using a combined top-down and bottom-up logic, where regional semiconductor billings and production and trade signals are first used to reconstruct the demand pool across the Americas and then the totals are tested using selective supplier and channel roll ups. When the main pool is set, it is further split using device family shares that are consistent with known product group patterns and end market exposure.
Inputs that matter in this market include regional semiconductor billings by product group, electronics production and shipment trends, import and export movement for key device categories, end market demand signals (such as data center and automotive electronics build cycles), and observed pricing direction for major device groups where cycles are common. For forecasting, we use scenario analysis supported by regression style checks, so growth is not only extended from history but is also tied to a few demand drivers that interviewees consistently pointed to across the region. Where bottom-up visibility is thin for smaller countries or niche device groups, the gaps are handled using proxy splits from trade and production indicators, followed by a final pass where implied ASP and volume movement are checked for realism.
Data Validation & Update Cycle
Validation is done in layers so the final totals do not depend on one source or one assumption. We compare the model output against independent signals like WSTS regional billings, trade movement, and major end market cycles, and then we review year to year jumps to see if they match known pricing and inventory patterns.
Before sign-off, anomalies are reworked through analyst review steps, and follow-up calls are triggered when interview feedback and desk indicators disagree by a meaningful margin. Reports are refreshed annually, with interim updates when material events shift demand or pricing, and a fresh final review is completed close to delivery so clients receive the latest updated view.
Mordor Intelligence's Americas Semiconductor Device Market Size Versus Other Published Estimates
Published estimates for the Americas semiconductor device space often differ, even when they use similar words, because the counted revenue pool and the timing assumptions are not always the same. Differences usually come from what is treated as a device sale versus an adjacent upstream item, how regional coverage is applied, and whether price cycles are normalized or carried through as-is.
Manufacturing equipment and fab services sit outside Mordor Intelligence scope, which is a key reason its 2025 figure does not match estimates that blend device revenues with capex-heavy tool and service lines or that narrow the view to only one sub-region.
Benchmark comparison
| Source | Market Size | Gaps in Research Methodology |
|---|---|---|
| Mordor Intelligence | USD 188.46 B (2025) | |
| Industry Association A | USD 134.38 B (2023) | Uses regional billings to equipment makers and is reported as a historical sales series, so it does not align to a 2025 base year and may not mirror end-market consumption timing. |
| Trade Body B | USD 186.64 B (2024) | Shows a regional total at the billings level and is sensitive to cycle timing, so device mix shifts and short-term price swings can move the figure without a consistent device-family split model. |
The spread in the table is mainly explained by year alignment and what each source treats as the reportable revenue point, which can shift with inventory and pricing cycles. By keeping inclusions consistent, splitting the total through repeatable device mix drivers, and then cross-checking the outcome with independent regional signals, the estimate stays traceable to clear inputs and can be updated without changing the underlying logic.
Key Questions Answered in the Report
What is the current value of the Americas semiconductor device market?
The market was valued at USD 198.07 billion in 2026, with a forecast to reach USD 253.99 billion by 2031 on a 5.1% CAGR trajectory.
Which device type leads revenue in the Americas semiconductor device market?
Integrated circuits dominated with 80.65% revenue share in 2025 and are projected to grow fastest at an 7.45% CAGR through 2031.
Why is silicon-carbide attracting investment attention?
Silicon-carbide enables higher power density and efficiency for electric vehicles and renewable-energy inverters; its revenue is expanding at a 18.7% CAGR in the region.
How does the CHIPS Act influence regional capacity?
Federal incentives unlocked more than USD 450 billion in private commitments, aiming to triple U.S. wafer capacity by 2032 and deepen supply-chain localisation.
Which end-user vertical will grow fastest?
Automotive electronics are projected to register a 8.75% CAGR to 2031 as vehicles integrate electrified drivetrains and ADAS features.
What risks could slow market growth?
Key restraints include water scarcity in the U.S. Southwest, a projected shortfall of 67,000 skilled engineers by 2030, and tighter export-control regimes on advanced equipment.