
Americas Interventional Radiology Market Size and Share
Market Overview
| Study Period | 2020 - 2031 |
|---|---|
| Forecast Data Period | 2026 - 2031 |
| Base Year Market Size (2025) | USD 12.76 Billion |
| Market Size (2026) | USD 13.54 Billion |
| Market Size (2031) | USD 18.21 Billion |
| Growth Rate (2026 - 2031) | 6.13 % |
| Market Concentration | Medium |
Major Players *Disclaimer: Major Players sorted in no particular order Image © Mordor Intelligence. Reuse requires attribution under CC BY 4.0. | |
Americas Interventional Radiology Market Analysis by Mordor Intelligence
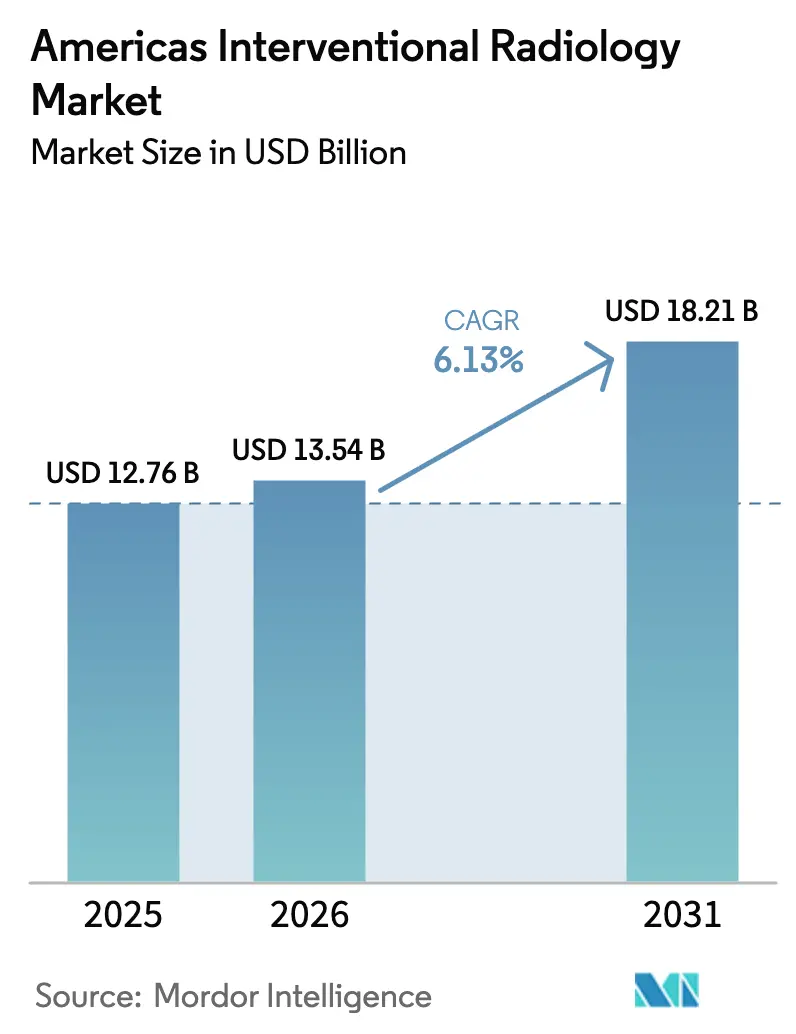
Americas interventional radiology market size in 2026 is estimated at USD 13.54 billion, growing from 2025 value of USD 12.76 billion with 2031 projections showing USD 18.21 billion, growing at 6.13% CAGR over 2026-2031. Robust adoption of photon-counting CT, artificial intelligence–enabled guidance, and pulsed field ablation systems is shortening procedure times, lowering radiation exposure, and improving therapeutic precision, which together uplift procedure volumes across cardiovascular and oncology indications. Payers’ shift toward value-based reimbursement rewards the minimally-invasive profile of interventional radiology while also encouraging site-of-service migration toward ambulatory settings. Persistent workforce shortages in Latin America, coupled with the high capital cost of hybrid suites, restrain immediate scale-up but simultaneously create openings for equipment financing and training collaborations.
Key Report Takeaways
- By product, consumables and devices held 52.22% of America’s interventional radiology market share in 2025, whereas imaging equipment is advancing at a 6.73% CAGR through 2031.
- By application, cardiology led with 38.27% revenue share of America’s interventional radiology market size in 2025, while oncology interventions are projected to climb at 7.22% CAGR to 2031.
- By end user, hospitals commanded 63.02% share of America’s interventional radiology market in 2025; contract development and manufacturing organizations are set to post the fastest 7.76% CAGR through 2031.
- By geography, North America accounted for 92.90% of America’s interventional radiology market size in 2025 and is forecast to grow at 8.45% CAGR to 2031.
Note: Market size and forecast figures in this report are generated using Mordor Intelligence’s proprietary estimation framework, updated with the latest available data and insights as of 2026.
Americas Interventional Radiology Market Trends and Insights
Drivers Impact Analysis*
| Driver | (~) % Impact on CAGR Forecast | Geographic Relevance | Impact Timeline |
|---|---|---|---|
| Increasing burden of chronic cardiovascular & oncological diseases | +1.8% | Global, with highest impact in North America | Long term (≥ 4 years) |
| Technological advances in IR imaging (photon-counting CT, AI, AR) | +1.2% | North America & EU, spill-over to Latin America | Medium term (2-4 years) |
| Rapid expansion of office-based labs (OBL) & ASCs in the Americas (under-reported) | +0.9% | North America core, early adoption in Brazil | Short term (≤ 2 years) |
| Favorable reimbursement revisions for IR codes in U.S. and Brazil | +0.7% | United States and Brazil primarily | Short term (≤ 2 years) |
| Shift to value-based care favouring minimally-invasive IR over surgery (under-reported) | +0.5% | North America primarily, gradual expansion to Latin America | Medium term (2-4 years) |
| Source: Mordor Intelligence | |||
Increasing Burden of Chronic Cardiovascular & Oncological Diseases
Hypertension prevalence is projected to climb from 51.2% to 61.0% by 2050, and diabetes from 16.3% to 26.8%, adding a steady pipeline of complex cases amenable to catheter-based interventions. The aging population magnifies disease incidence, while patient preference for shorter recovery dovetails with hospital efforts to lower length of stay. Together these factors increase case volumes for peripheral angioplasty, renal denervation, and tumor embolization. Consequently, America’s interventional radiology market benefits from structural tailwinds that consistently replenish procedural demand.
Technological Advances in IR Imaging (Photon-Counting CT, AI, AR)
Photon-counting detector CT enables higher spatial resolution and intrinsic spectral separation, which improves tissue contrast while cutting radiation dose compared to energy-integrating systems, thereby elevating diagnostic certainty in complex vascular interventions. Clinical studies show vessel-sharpness ratings of 134.7 HU/mm versus 100.9 HU/mm on conventional scanners, facilitating precise device deployment in coronary and neurovascular procedures. AI-enabled robotic platforms overlay real-time trajectory guidance, automate wire manipulation, and reduce fluoroscopy time by up to 56%, which eases radiation safety concerns for staff and patients. Augmented-reality head-mounted displays further shorten learning curves for complex ablation or embolization. Early adopters realize competitive gains through lower complication rates and higher throughput, reinforcing the technological arms race within America’s interventional radiology market.
Rapid Expansion of Office-Based Labs (OBLs) & ASCs in the Americas
More than 700 OBLs were operational in the United States in 2021, and their number is projected to grow at 7.5% annually through 2030 on the strength of bundled payments and patient preference for community-based care. Medicare data confirm that 6,100 ASCs handled 3.3 million beneficiaries in 2022, with procedure volume per beneficiary up 2.8% year on year. Outpatient sites typically deliver 35% lower episode costs than hospital outpatient departments, creating strong payer incentives for migration of angioplasty, uterine fibroid embolization, and port placements. The resulting redistribution of caseload supports double-digit equipment sales into small footprints that rely on compact C-arms and ultrasound guidance. These dynamics underpin near-term revenue growth in America’s interventional radiology market.
Shift to Value-Based Care Favoring Minimally-Invasive IR Over Surgery
The Centers for Medicare & Medicaid Services approved transitional pass-through payment for Medtronic’s Symplicity Spyral renal denervation catheter effective January 2025, signifying regulatory endorsement for novel catheter therapies that reduce downstream hospitalization costs. The 2025 CPT update introduced 270 new codes, including MRI-guided ablation and complex embolization bundles that streamline billing and raise professional fees for image-guided care. Health systems see shorter length of stay and fewer complications with percutaneous options, which increases alignment between clinical outcomes and payment quality metrics. Consequently, procedural referrals tilt toward interventional suites, stimulating durable adoption across vascular, oncologic, and neurologic lines within America’s interventional radiology market.
Restraints Impact Analysis*
| Restraint | (~) % Impact on CAGR Forecast | Geographic Relevance | Impact Timeline |
|---|---|---|---|
| High capital cost of IR suites & advanced imaging modalities | -1.1% | Global, with acute impact in Latin America | Medium term (2-4 years) |
| Shortage of trained interventional radiologists in Latin America | -0.8% | Latin America primarily, spillover to rural North America | Long term (≥ 4 years) |
| Post-COVID capex deferrals by hospitals (under-reported) | -0.6% | Global, with highest impact in Latin America | Short term (≤ 2 years) |
| Stringent ANVISA-level approval timelines delaying device launches | -0.4% | Latin America, primarily Brazil and Argentina | Medium term (2-4 years) |
| Source: Mordor Intelligence | |||
High Capital Cost of IR Suites & Advanced Imaging Modalities
Photon-counting CT scanners, robotic C-arms, and hybrid operating rooms each require outlays above USD 2 million, with entire suite buildouts reaching USD 5 million, which strains hospital balance sheets already operating at 1.2% median operating margins. Annual service contracts consume 15 – 20% of purchase price, while software upgrades add incremental costs that small systems struggle to absorb. Latin American hospitals face 30 – 40% price premiums driven by import tariffs and currency volatility, raising barriers to adoption. Deferred-payment leasing and refurbished equipment programs are expanding, yet premium financing charges dilute investment returns. As a result, America’s interventional radiology market encounters localized slowdowns where capital intensity outweighs clinical demand.
Shortage of Trained Interventional Radiologists in Latin America
Only 15.5% of U.S. counties have an interventional radiologist, and 31.2% of the population lacks direct access to interventional expertise, illustrating the depth of workforce scarcity. Latin American training programs face limited fellowship slots, outdated curricula, and funding gaps, thereby prolonging skill deficits despite growing disease burden. The practicing IR cohort in the United States shrank 7% from 2013 to 2020, even as evaluation and management claims climbed 35%, indicating widening imbalances between demand and supply. Workforce expansion lags six years behind fellowship enrollment because of training duration, locking in shortages that constrain procedural capacity across underserved geographies within America’s interventional radiology market.
*Our forecasts treat driver/restraint impacts as directional, not additive. The impact forecasts reflect baseline growth, mix effects, and variable interactions.
Segment Analysis
By Product: Consumables Drive Revenue While Equipment Spurs Innovation
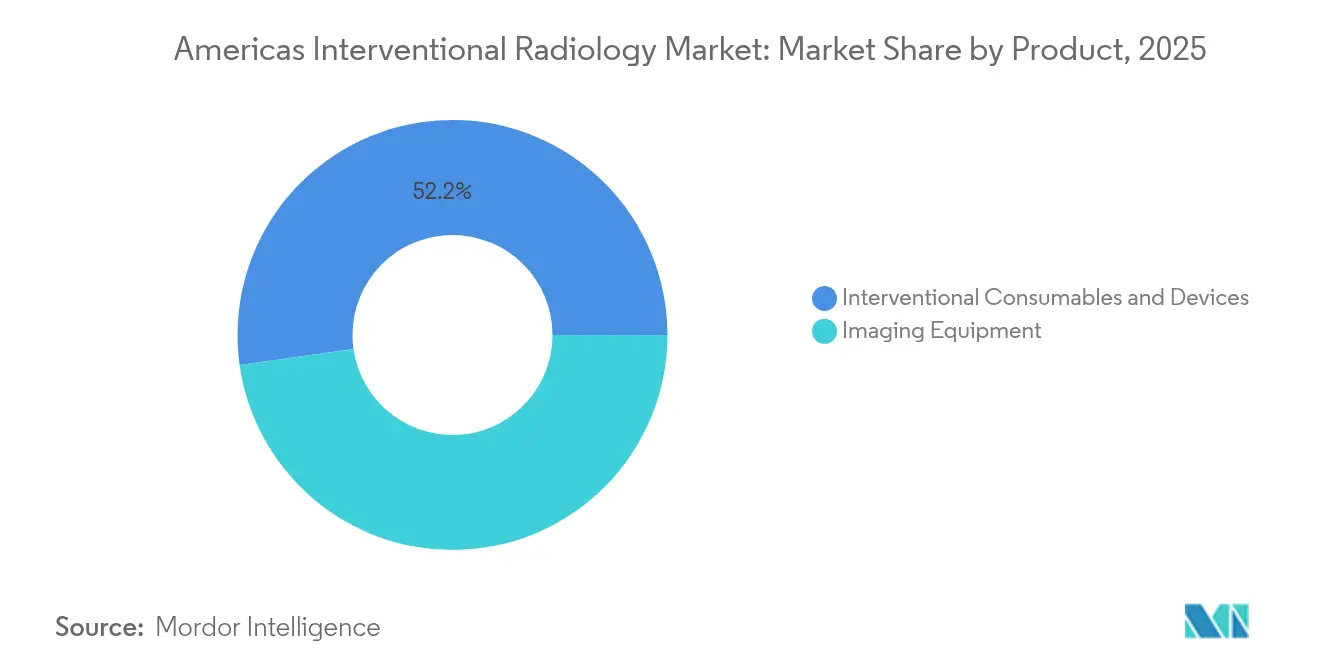
Consumables and devices accounted for 52.22% of America’s interventional radiology market share in 2025, buoyed by high procedure frequency and single-use mandates that accelerate replacement cycles. Stents, catheters, guidewires, and embolic agents dominate hospital procurement lists because multifaceted procedures require multiple SKUs per case. The stent subsegment gained further traction after Abbott secured FDA clearance for its dissolving Esprit BTK scaffold for below-the-knee disease, a milestone that reshapes peripheral revascularization options. Biopsy and thrombectomy kits also expand as stroke and oncology protocols emphasize early intervention.
Imaging equipment represents the fastest-growing category at a 6.73% CAGR through 2031 as facilities upgrade to photon-counting CT, self-driving C-arms, and AI-integrated MRI that mitigate radiologist shortages and enhance workflow. Hospitals leverage financing partnerships to acquire comprehensive platforms that bundle scanners, software, and analytics services, improving lifetime value. AI-rich ultrasound systems are penetrating office-based labs due to portability and rapid learning curves, while angiography suites adopt radiation-free light-based navigation that can slash fluoroscopy exposure by over half. These trends drive a premium replacement cycle that anchors long-term expansion in America’s interventional radiology market.

By Application: Cardiology Commands the Present, Oncology Fuels the Future
Cardiology dominated America’s interventional radiology market size with 38.27% in 2025, supported by entrenched reimbursement pathways and decades of evidence favoring catheter-based treatments over open surgery for coronary and structural heart disease. Pulsed field ablation systems from Medtronic, Boston Scientific, and Abbott have democratized atrial fibrillation treatment by shortening procedure time and reducing collateral tissue injury, which stimulates incremental device sales. Hypertension trials using renal denervation catheters show sustained blood pressure reduction, adding a new patient pool for interventional treatment.
Oncology interventions are expanding at 7.22% CAGR, the fastest among clinical segments, as image-guided tumor ablation, chemoembolization, and selective internal radiation therapy align with precision medicine strategies that seek localized high-dose delivery with minimal systemic toxicity. Theranostic workflows that integrate diagnostic imaging and localized therapy elevate scanner utilization and consumable turnover, fostering a virtuous cycle for vendors. The rising incidence of hepatocellular carcinoma and lung metastases, combined with improved survival, ensures sustained procedural demand for ablation needles, microspheres, and drug-eluting beads.
By End User: Hospitals Anchor Complexity, Specialized Centers Accelerate Volume
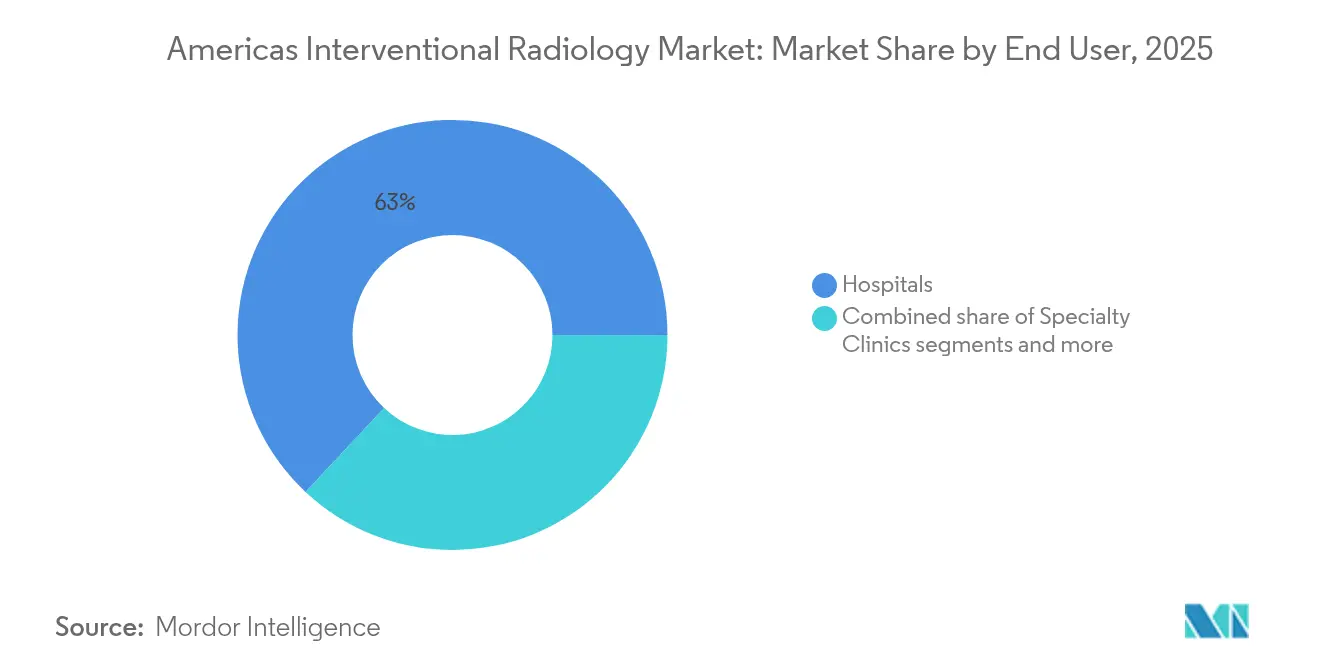
Hospitals retained a 63.02% share of America’s interventional radiology market in 2025, justified by their ability to aggregate multidisciplinary expertise, intensive care backup, and advanced imaging suites necessary for high-risk cases. Complex stroke thrombectomies, large-vessel aneurysm repairs, and pediatric interventions remain hospital mainstays. Moreover, academic centers lead early adoption of photon-counting CT and robotic angiography, driving demand for vendor-bundled service contracts.
Contract development and manufacturing organizations, office-based labs, and ambulatory surgical centers are registering the highest growth at 7.76% CAGR because they capture routine vascular access, dialysis interventions, and pain management procedures under cost-efficient settings. These sites rely on compact fluoroscopy and ultrasound platforms and favor disposable kits that streamline turnover. Specialty clinics focusing on endovascular limb salvage and uterine fibroid embolization thrive on targeted marketing and bundled payment contracts that reward high patient satisfaction. This multisite delivery ecosystem diversifies revenue streams and underpins the long-run scalability of America’s interventional radiology market.
Geography Analysis
North America generated 92.90% of total revenue in 2025 and is forecast to expand at 8.45% CAGR through 2031 as Medicare Advantage enrollment rises and CPT code revisions improve practice economics. The United States leads photon-counting CT installations and has already performed first-in-human procedures with AI-guided transcatheter valves, reinforcing technological leadership. Canada benefits from federal investments in health-system modernization that include dedicated funding for ambulatory stroke services and PET/CT expansion.
South America remains under-penetrated yet strategically important. Brazil accelerated ANVISA approvals by recognizing FDA and Health Canada clearances, which cut regulatory timelines to 6-9 months for qualified devices, supporting faster market entry for stents, ablation systems, and catheter technologies. Currency headwinds and import taxes still inflate equipment costs, but vendor-financed leasing and refurbished platforms help mitigate barriers. Argentina’s economic volatility tempers near-term purchasing power; however, rising private-sector investments in vascular care highlight latent demand for cost-effective, minimally-invasive solutions.
The remainder of South America faces infrastructure gaps and workforce shortages but demonstrates strong appetite for professional education. Cross-border training programs reveal that over 80% of Latin American radiologists prioritize interventional skill acquisition, pointing to future volume growth once capital and regulatory hurdles ease. International equipment vendors with turnkey training, financing, and service bundles are likely to gain early footholds as socioeconomic conditions stabilize, enabling broader expansion of America’s interventional radiology market.
Regulatory Landscape
In the United States, interventional radiology equipment, software, and disposable devices are regulated by the US Food and Drug Administration (FDA) under a risk-based framework, with device quality oversight updated through the Quality Management System Regulation (QMSR) that took effect on February 2, 2026 and aligned 21 CFR Part 820 more closely with ISO 13485:2016. The FDA also transitioned to the Inspection of Medical Device Manufacturers Compliance Program (7382.850) on the same date, which updated inspection expectations for manufacturers supplying IR suites, imaging platforms, and catheter-based tools.
Regulatory clarity is also expanding for software-enabled IR workflows. On June 17, 2026, the FDA codified radiological machine learning-based quantitative imaging software with predetermined change control plans as Class II under 21 CFR 892.2055, supporting more structured update pathways for AI features embedded in interventional imaging. For procedure-specific devices, FDA special controls guidance (for example, vascular and neurovascular embolization devices) continues to shape test requirements, labeling, and performance evidence used by manufacturers active across the Americas.
Value Chain Analysis
The value chain covers upstream components and materials (detectors, x-ray tubes, power and vacuum products, electronics, polymers, and nitinol-based structures), device and system design, manufacturing and sterilization (for single-use catheters, guidewires, embolics, and thrombectomy tools), regulatory and quality compliance, and downstream commercialization through direct sales and distributor networks to hospitals, OBLs/ASCs, and specialty clinics. Capital equipment economics place service, software, and lifecycle management alongside hardware as core profit pools, particularly as facilities weigh suite buildouts against operational constraints.
Major OEMs increasingly influence midstream integration and installed-base monetization. Siemens Healthineers has organized technology centers (including mechatronic products, medical electronics, and power and vacuum products) that support multiple segments, reinforcing vertical integration of critical imaging subassemblies used in angiography and interventional systems. On the demand side, GE HealthCare has emphasized upgrade pathways for existing interventional suites, shifting the channel mix toward retrofit software and workflow modules rather than full system replacement. FUJIFILM, in parallel, is pushing hospital-wide data integration strategies that connect imaging and clinical IT across departments, pulling PACS/enterprise imaging, interoperability, and workflow software further into the IR delivery chain.
Competitive Landscape
America’s interventional radiology market hosts a moderately concentrated field in which consumable giants Boston Scientific, Medtronic, and Abbott compete alongside imaging leaders GE HealthCare, Philips, and Siemens Healthineers for end-to-end procedural mindshare. FDA authorization of three pulsed field ablation systems in 2024 reignited competitive dynamics similar to early stent battles, prompting rapid share realignment as hospitals evaluate efficacy, workflow, and pricing differentials. Device firms broaden portfolios through tuck-in acquisitions, as shown by Teleflex purchasing BIOTRONIK’s vascular intervention unit for USD 820 million to gain instant coronary balloon scale.
Emerging white-space centers on AI-driven decision support, non-fluoroscopic navigation, and value-based service contracting. Patent filings in robotic catheter guidance and machine-learning-enabled ablation climbed 40% annually since 2022, signaling intense R&D investment by incumbents and venture-backed entrants. Vendors that can demonstrate quantifiable outcome gains and document cost avoidance secure preferential placement on hospital capital budgets, a trend that reinforces competitive pressure yet benefits purchasers through broader solution choice within America’s interventional radiology market.
Americas Interventional Radiology Industry Leaders
-
Carestream Health
-
GE Healthcare
-
Siemens Healthineers AG
-
Canon Medical Systems Corporation
-
FUJIFILM Holdings Corporation
- *Disclaimer: Major Players sorted in no particular order

Market Opportunities and Future Outlook
A central opportunity is monetizing the installed base of interventional suites through modernization rather than replacement, especially where hybrid rooms and advanced imaging modalities carry high capital costs. In 2026, GE HealthCare introduced Allia platform upgrade pathways for legacy Innova and Discovery systems in the United States, creating a defined route for providers to add newer reconstruction and workflow tools while keeping existing infrastructure in place. This supports vendors selling modular upgrades, managed service contracts, and financing bundles aligned to hospital and outpatient refresh cycles that prioritize uptime.
Another opportunity is workflow-centric integration across imaging, therapy, and software, particularly where AI and planning tools reduce staff burden and standardize complex procedures. Siemens Healthineers has organized assets under a Precision Therapy segment that combines Varian and Advanced Therapies with Ultrasound, reflecting a portfolio pull toward image-guided treatment and AI-powered applications that can span oncology, vascular, and neuro workflows. The FDA action on June 17, 2026 to codify certain ML-based quantitative imaging software (with predetermined change control plans) as Class II strengthens the commercialization pathway for AI features that require iterative updates, supporting partnerships and co-marketing models such as treatment-planning integrations around angiography platforms. In Latin America, workforce and capital constraints create whitespace for turnkey offerings that combine equipment access, clinical education, and enterprise imaging integration, particularly as interventional procedures shift toward outpatient footprints that support compact, software-rich systems.
Recent Industry Developments
- June 2026: GE HealthCare introduced upgrade pathways for legacy Innova and Discovery interventional imaging systems, enabling AI-enabled image reconstruction and workflow tools without replacing existing infrastructure. The upgrade program preserves the installed base while accelerating software-driven innovation. It supports customers in achieving higher throughput and improved imaging capabilities without large capital outlays.
- June 2026: Siemens Healthineers announced a co-marketing partnership with Mentice to integrate Ankyras predictive modeling software with Artis Icono angiography systems for neurovascular treatment planning. The collaboration strengthens workflow efficiency in neuro interventions and expands the vendor ecosystem through the Mentice partnership. It also improves planning accuracy and broadens the appeal of integrated simulation and imaging workflows for complex procedures.
- April 2026: Siemens Healthineers and Cook Medical unveiled an integrated Interventional MRI iMRI suite at SIR 2026, featuring the Magnetom Free.XL scanner for radiation-free procedures. The introduction broadens interventional suite capabilities and shows cross-vendor collaboration to enable MRI guided procedures. It expands options for radiation-free interventions and signals a shift toward multimodality suites in clinical practice.
Research Methodology Framework and Report Scope
Market Definition and Coverage
For this methodology, the Americas interventional radiology market includes revenue generated from image-guided minimally invasive procedures. It also counts the related imaging equipment plus procedure-focused consumables and devices used across key clinical indications in the Americas.
Scope exclusions: We exclude general diagnostic-only imaging systems and non-interventional surgical tools that are not used to perform interventional radiology procedures.
Segmentation Overview
- By Product
- Imaging Equipment
- MRI Systems
- CT Scanners
- Ultrasound Imaging Systems
- Angiography Systems
- Fluoroscopy Systems
- Interventional Consumables & Devices
- Stents
- Catheters & Guidewires
- Angioplasty Balloons
- Embolization & Thrombectomy Devices
- Biopsy Devices
- IVC Filters & Accessories
- Imaging Equipment
- By Application
- Cardiology
- Oncology
- Urology & Nephrology
- Gastroenterology
- Neurology
- By End User
- Hospitals
- Office-Based Labs (OBLs) / Ambulatory Surgical Centers (ASCs)
- Specialty Clinics
- Geography
- North America
- United States
- Canada
- Mexico
- South America
- Brazil
- Argentina
- Rest of South America
- North America
Data Sources, Market Sizing, and Validation
Desk Research
Desk research started with mapping the procedure universe and care settings where interventional radiology is performed, then aligning that universe with measurable public indicators. We leaned on non-paywalled sources such as CDC and National Center for Health Statistics releases, CMS fee schedules and utilization files, PAHO health statistics, and OECD health indicators to track procedure trends, reimbursement direction, and capacity constraints.
To tighten the supply-side view, we also reviewed public regulatory and clinical signals, such as FDA databases for clearances and recalls, and peer-reviewed clinical journals for practice trends and modality usage. Company annual reports, investor materials, and reputable press were used to interpret product launches and geographic focus. Where needed, we referenced a paid subscription for company financials and patent intelligence to support cross-checks on portfolio breadth and innovation intensity. The sources listed here are illustrative, and we also used other public documents and datasets to collect, validate, and clarify inputs.
Primary Interviews and Surveys
Primary inputs came from interviews and structured surveys with hospital and outpatient center stakeholders, practicing clinicians, procurement teams, and distributors across the Americas, so assumptions could be pressure-tested against real ordering and utilization patterns. Where desk sources were thinner, respondents helped confirm device-mix shifts, typical replacement timing for imaging suites, and how reimbursement and site-of-care changes affect procedure volumes.
Distribution of primary research fieldwork respondents
| Company type | Respondent position |
|---|---|
| Top tier: 34% | CXOs: 17% |
| Mid tier: 48% | Functional/Unit leaders: 40% |
| Smaller Players: 18% | Managers: 43% |
Market-Sizing & Forecasting
Sizing was built using a combined logic. First, we reconstructed a top-down demand pool from procedure volumes and site-of-service mix across the Americas. Then, we translated the case volume into value using typical device, consumable, and equipment spend per case. To keep the totals realistic, we used selective bottom-up approximations as checkpoints, such as sampled ASP x volume for high-use consumables and channel checks on capital equipment shipment and replacement cycles.
Key model inputs included interventional procedure growth by major indications, hospital versus ambulatory share shifts, imaging suite replacement and upgrade timing, utilization rates of catheter labs and hybrid rooms, and average selling price movement tied to technology mix and tender behavior. For forecasting, we applied scenario analysis around reimbursement stability, elective procedure recovery, and capital budget cycles, then refined it using expert consensus on the pace of minimally invasive adoption. Where supplier-level detail was incomplete, we handled gaps through ratio-based splits validated with interviews, then reconciled them back to the demand pool totals.
Data Validation & Update Cycle
Outputs were validated through multiple checks so the final number did not depend on any single dataset. We compared modeled revenue against independent signals such as reimbursement trend direction, procedure momentum, and capital equipment replacement cadence. If variance was large, we ran follow-up calls and edited assumptions.
Before sign-off, the model and key assumptions go through stepwise analyst reviews, followed by a consistency pass across segments, countries, and end users. Reports are refreshed annually, with interim updates when material events occur, including major policy changes or meaningful shifts in procedure settings. Right before delivery, we complete a final review pass so clients receive the most current view available.
Mordor Intelligence's Americas Interventional Radiology Market Sizing Compared With Other Published Estimates
Published market sizes for interventional radiology in the Americas can vary even when they appear to describe the same space, and the benchmark table makes that spread easy to see. Differences usually come from how each publisher defines the product boundary, whether procedure-linked consumables are fully counted, and how regional scope is handled across North and South America.
The table also points to a common source of mismatch, namely whether broad diagnostic imaging revenue and unrelated surgical tools are blended into the same total. In Mordor Intelligence's model, we count value only for interventional radiology imaging equipment and for interventional consumables and devices tied to procedure use. This typically brings the estimate closer to observable procedure and purchasing signals, and helps avoid counting adjacent imaging spend twice.
Benchmark comparison
| Source | Market Size | Gaps in Research Methodology |
|---|---|---|
| Mordor Intelligence | USD 12.76 B (2025) | |
| Regional Consultancy A | USD 16.50 B (2025) | Often uses a broader North America heavy scope and may blend diagnostic imaging and wider surgical device revenue, which inflates totals when compared with procedure-linked IR-only counting. |
| Trade Journal B | USD 10.90 B (2024) | May focus mainly on hospital purchasing and a narrower device basket, and it can understate ambulatory labs and capital equipment refresh effects when converting volume trends into value. |
Taken together, the spread is mainly explained by scope boundaries, the device basket chosen, and how procedure volume is converted into revenue. By keeping assumptions traceable to procedure setting shifts, replacement timing, and realistic pricing progression, the methodology produces a practical number that can be repeated and audited across the Americas.
Key Questions Answered in the Report
How large is America’s interventional radiology market in 2026?
The market stands at USD 13.54 billion in 2026 and is forecast to reach USD 18.21 billion by 2031.
Which clinical area generates the highest procedure volume?
Cardiology leads, accounting for 38.27% of 2025 revenue, thanks to widespread use of coronary and electrophysiology interventions.
What is the fastest-growing application segment?
Oncology procedures expand at a 7.22% CAGR through 2031 as image-guided tumor ablation and chemoembolization gain momentum.
Why are office-based labs important for future growth?
OBLs and ASCs can cut episode costs by up to 35% and are growing 7.76% per year, shifting routine cases out of hospitals.
Which technology is reshaping imaging equipment demand?
Photon-counting CT coupled with AI-enabled guidance is driving a 6.73% CAGR in imaging equipment sales as facilities refresh fleets.