
Ambulatory Healthcare Service Market Size and Share
Market Overview
| Study Period | 2020 - 2031 |
|---|---|
| Market Size (2026) | USD 4.4 Billion |
| Market Size (2031) | USD 5.81 Billion |
| Growth Rate (2026 - 2031) | 5.74 % |
| Fastest Growing Market | Asia Pacific |
| Largest Market | North America |
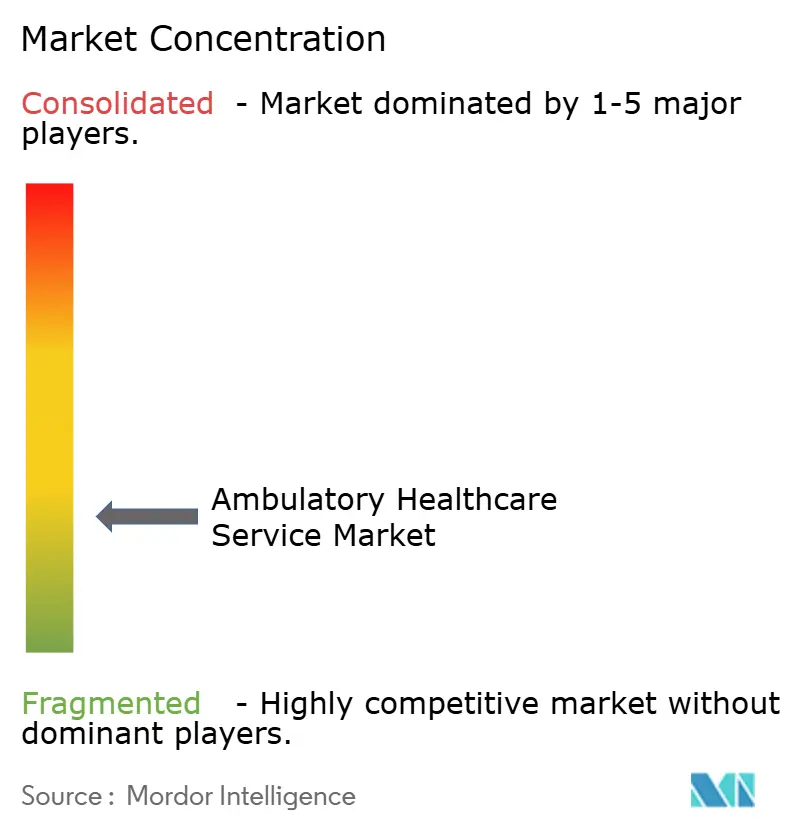
| Market Concentration | Low |
Major Players *Disclaimer: Major Players sorted in no particular order Image © Mordor Intelligence. Reuse requires attribution under CC BY 4.0. | |
Ambulatory Healthcare Service Market Analysis by Mordor Intelligence
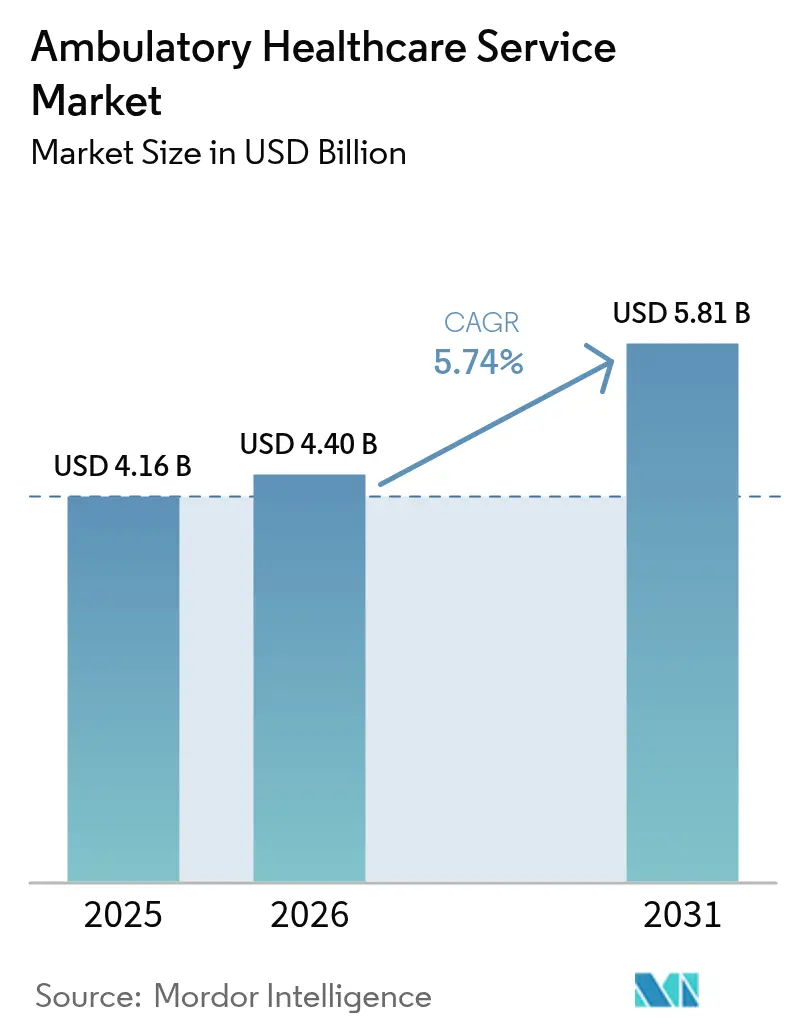
The Ambulatory Healthcare Service Market size was valued at USD 4.16 billion in 2025 and estimated to grow from USD 4.40 billion in 2026 to reach USD 5.81 billion by 2031, at a CAGR of 5.74% during the forecast period (2026-2031).
Expansion is propelled by the steady shift of procedures from inpatient hospitals to cost-efficient outpatient facilities, stronger payer incentives for value-based care, and rising demand for chronic-disease management. North America continues to anchor global revenues on the back of mature reimbursement policies, while Asia-Pacific records the most rapid uptake as governments scale outpatient infrastructure. Technology that supports minimally invasive surgeries, real-time analytics, and remote monitoring further widens the clinical scope of ambulatory centers. Concurrently, labor shortages, cyber threats, and rising urban real-estate costs temper growth momentum by adding operational risk and capital pressure.
Key Report Takeaways
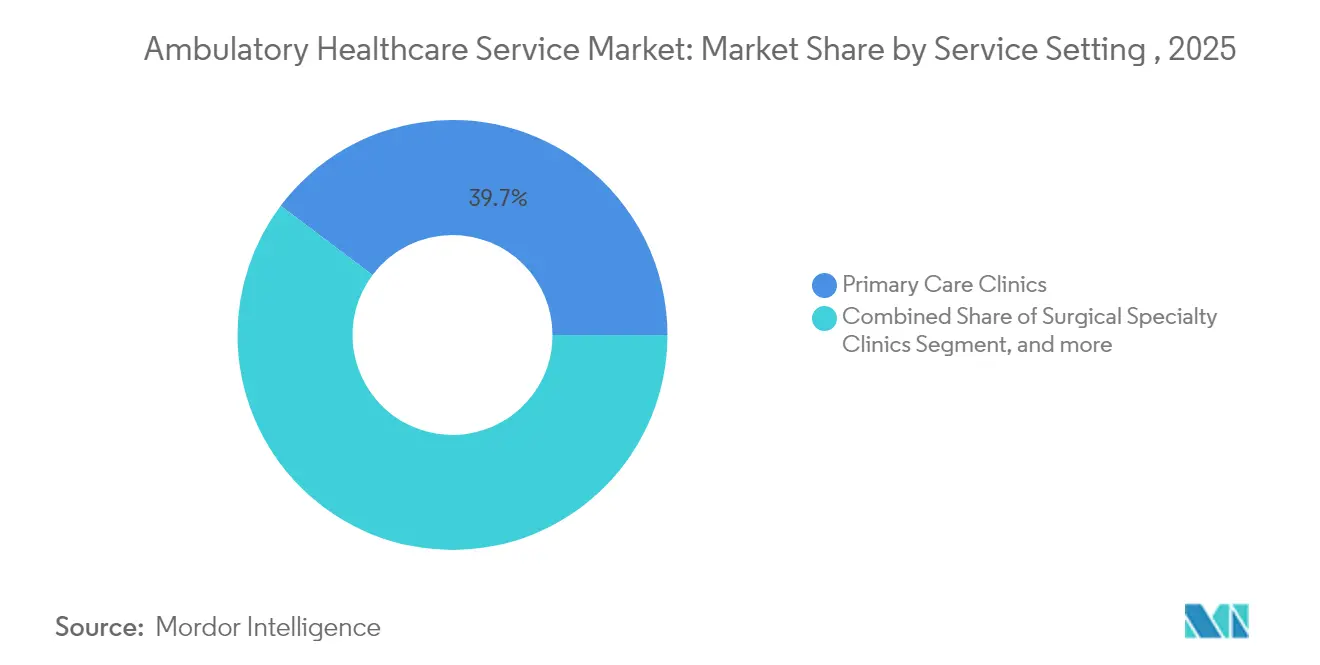
- By service setting, primary care clinics held 39.74% of the ambulatory healthcare service market share in 2025, while telehealth and virtual clinics are projected to expand at a 7.62% CAGR through 2031.
- By specialty, gastroenterology led with 25.02% revenue share in 2025; oncology is forecast to grow at an 8.42% CAGR to 2031.
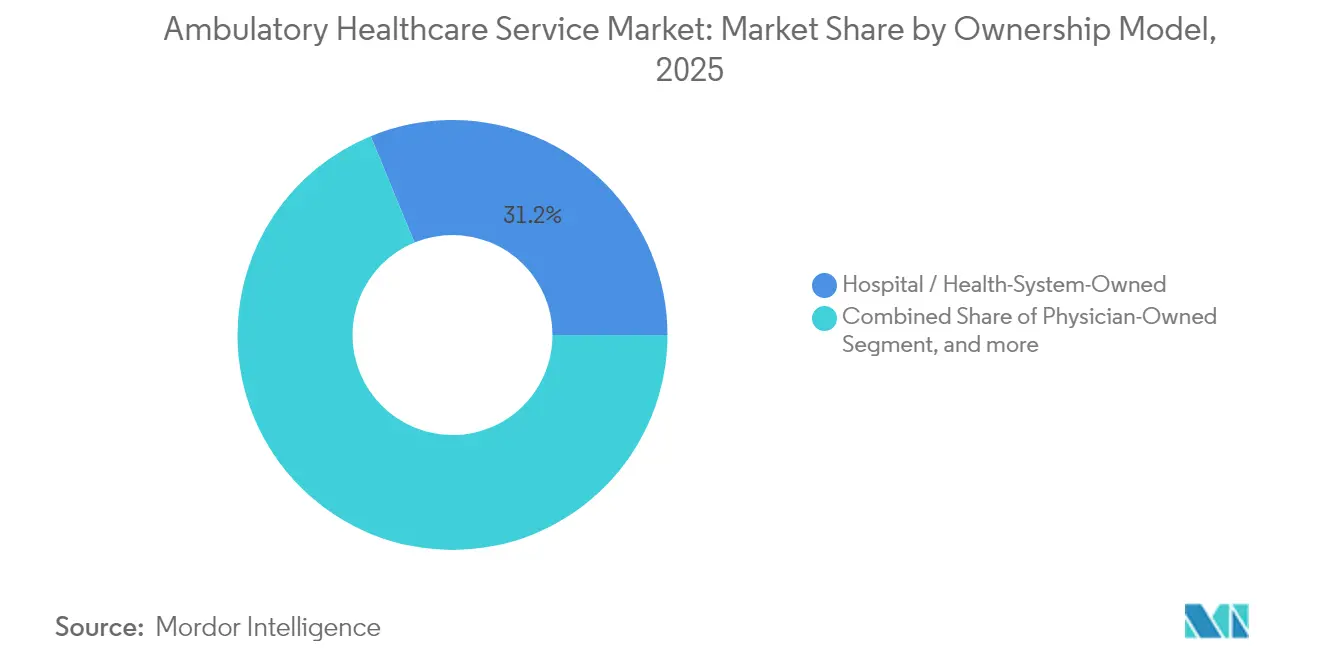
- By ownership model, hospital- and health-system-owned sites accounted for 31.21% share of the ambulatory healthcare service market size in 2025; physician-owned facilities are poised for a 9.33% CAGR between 2026-2031.
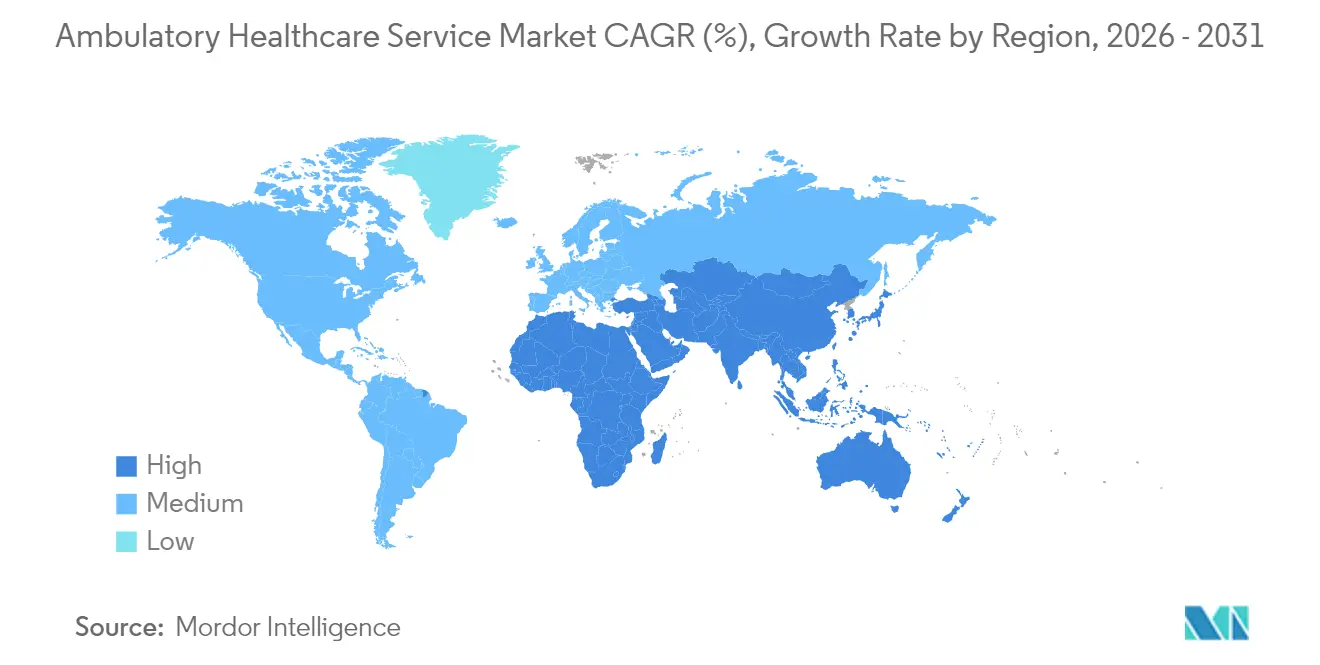
- By geography, North America commanded 43.12% of global revenues in 2025, whereas Asia-Pacific registers the fastest regional CAGR at 10.18% through 2031.
Note: Market size and forecast figures in this report are generated using Mordor Intelligence’s proprietary estimation framework, updated with the latest available data and insights as of 2026.
Market Trends and Insights
Drivers Impact Analysis of Ambulatory Healthcare Service Market*
| Driver | (~) % Impact on CAGR Forecast | Geographic Relevance | Impact Timeline |
|---|---|---|---|
| Rising Burden of Chronic Diseases and a Growing Elderly Population | +1.8% | Global, with highest impact in North America and Europe | Long term (≥ 4 years) |
| Technological Innovations Enabling Shift Toward Minimally Invasive Surgeries | +1.2% | North America & EU, expanding to APAC | Medium term (2-4 years) |
| Policy Initiatives Promoting Favorable Reimbursement and Site-of-Care Mandates | +0.9% | North America primarily, selective EU markets | Short term (≤ 2 years) |
| Entry of Retail Giants and Big-Tech Players Accelerating Digital Innovation | +0.7% | North America & APAC core, spill-over to EU | Medium term (2-4 years) |
| Hybrid ASC-OBL Facilities Supporting Migration of Cardiovascular Procedures | +0.5% | North America, early adoption in select EU markets | Medium term (2-4 years) |
| Adoption of Value-Based Care and Bundled Payment Models | +0.6% | North America & EU, pilot programs in APAC | Long term (≥ 4 years) |
| Source: Mordor Intelligence | |||
Rising Burden of Chronic Diseases and a Growing Elderly Population
Demand for the ambulatory healthcare service market deepens as multimorbidity rates climb among seniors who prefer community-based care. Payers now tie 75% of home- and community-care reimbursements to government programs, embedding outpatient delivery in national health strategies. Community clinics respond by enlarging chronic-disease panels, integrating nutrition services, and deploying point-of-care diagnostics that shorten referral loops. Population-health contracts increasingly include performance metrics for hypertension, diabetes, and COPD management conducted in ambulatory settings. These patterns confirm that outpatient care is becoming a structural component of health-system capacity rather than a discretionary adjunct.
Technological Innovations Enabling Shift Toward Minimally Invasive Surgeries
Advances in robotics, imaging, and AI reduce incision size, operating-room time, and recuperation periods, allowing procedures once limited to hospital theaters to migrate to ambulatory surgery centers. Photon-counting CT and digital SPECT scanners shrink scan sequences and radiation exposure, aligning with outpatient throughput targets. Cardiovascular interventions such as atherectomy and peripheral stenting are increasingly reimbursed for ambulatory venues, expanding procedure mix. Automated image-analysis tools offset shortages of radiologists by triaging scans and flagging anomalies for rapid review. Collectively, these technologies help facilities boost case volumes without proportional increases in clinical manpower.
Policy Initiatives Promoting Favorable Reimbursement and Site-of-Care Mandates
For CY 2025, Medicare boosted ASC payment rates by 2.9%, while updates for hospital outpatient departments remained modest, sharpening the cost differential in favor of ambulatory sites.[1] The Physician Fee Schedule adds Advanced Primary Care Management codes that decouple chronic-care billing from time-based documentation, making outpatient workflows more financially viable. Telehealth reimbursement remains extended through September 2025, and bipartisan proposals aim to cement remote-care parity, giving virtual ambulatory clinics durable revenue streams. Several U.S. states have relaxed certificate-of-need laws, enabling faster build-outs of imaging centers and procedure suites. These synchronized measures accelerate procedure migration and incentivize new entrants.
Entry of Retail Giants and Big-Tech Players Accelerating Digital Innovation
Consumer-facing conglomerates deploy AI scribes that cut clinical-note time by 40%, allowing physicians to handle greater visit volumes. Cloud-native EHR modules integrate pharmacy, diagnostics, and remote-monitoring data, creating frictionless hand-offs between bricks-and-mortar sites and virtual platforms. Industry analysts project 25-30% of U.S. ambulatory visits to occur via telemedicine by 2026, with behavioral health commanding the highest mix. Digital retail clinics co-locate urgent care, labs, and chronic-care programs in storefront footprints, challenging traditional primary-care economics. Early adopters secure first-mover brand equity and data networks that create high switching costs for consumers.
Restraints Impact Analysis of Ambulatory Healthcare Service Market*
| Restraint | (~) % Impact on CAGR Forecast | Geographic Relevance | Impact Timeline |
|---|---|---|---|
| Persistent Workforce Shortages and Increasing Clinician Burnout | -1.4% | Global, most acute in North America and EU | Short term (≤ 2 years) |
| Rising Cybersecurity Threats and Fragmented Data Systems | -0.8% | Global, highest impact in digitally advanced markets | Medium term (2-4 years) |
| High Real Estate Costs in Urban and High-Growth Corridors Pose Barriers to ASC Expansion | -0.6% | North America & EU urban centers, select APAC metros | Medium term (2-4 years) |
| Operational Complexity from Managing Multispecialty Practices | -0.4% | Global, particularly in fragmented healthcare systems | Long term (≥ 4 years) |
| Source: Mordor Intelligence | |||
Persistent Workforce Shortages and Increasing Clinician Burnout
A projected deficit of up to 139,000 physicians by 2033 tightens labor supply, with only 42.2% of physicians still in private practice as employment shifts toward hospital systems.[2] Burnout rates climb as clinicians juggle high visit counts and electronic documentation, prompting early retirement and reduced hours. Ambulatory centers struggle to staff evening and weekend clinics, limiting throughput during peak periods. Rural areas face compounded shortages because telehealth licensing requirements vary by state, slowing specialist deployment. Workforce gaps elevate salary expenses, pressuring margins that are already thinner than hospital counterparts.
Rising Cybersecurity Threats and Fragmented Data Systems
Healthcare recorded 386 significant cyber incidents in 2024, with average outage costs exceeding USD 2 million per day. The Change Healthcare breach exposed 190 million patient records, underscoring system-wide vulnerabilities. Smaller ambulatory providers often lack mature security operations centers, making them prime ransomware targets. Fragmented data across practice management systems complicates the deployment of end-to-end encryption and unified threat detection. High breach-remediation expenses frequently exceed annual IT budgets, forcing facilities to divert funds from clinical upgrades to cybersecurity safeguards.
*Our forecasts treat driver/restraint impacts as directional, not additive. The impact forecasts reflect baseline growth, mix effects, and variable interactions.
Ambulatory Healthcare Service Market Segment Analysis
By Service Setting:
Primary Care Anchors GrowthPrimary care clinics generated the largest revenue stream, accounting for 39.74% of the ambulatory healthcare service market in 2025. They serve as gatekeepers for disease prevention, prescription renewals, and referrals, positioning them as indispensable nodes in population-health programs. Continuity of care fosters strong patient relationships, leading to higher adherence and lower downstream costs. Investment in advanced triage tools and chronic-care dashboards enables clinics to manage rising multimorbidity without proportional physician headcount. Telehealth and virtual clinics, though smaller in absolute terms, are on track for a 7.62% CAGR through 2031, reflecting consumer preference for convenient, on-demand access.
Rapid virtual uptake brings fresh competition and raises expectations for 24/7 availability, pushing traditional practices to adopt hybrid models. Urgent care centers, numbering more than 14,000, continue to relieve emergency-room congestion by handling non-life-threatening episodes. Diagnostic imaging hubs prosper as payers shift high-cost scans out of hospital radiology departments. In parallel, home-health agencies leverage remote vitals monitoring to extend the reach of clinicians, particularly for post-acute recovery and palliative support. The segment mosaic underscores how diversified points of care jointly reinforce the ambulatory healthcare service market flow of patients and revenue.

By Specialty:
Gastroenterology Leads, Oncology AcceleratesGastroenterology captured 25.02% of specialty revenue in 2025, aided by procedural efficiencies that allow same-day discharge after colonoscopy or endoscopic retrograde cholangiopancreatography. Bundled-payment programs reward high-volume centers that maintain low complication rates, supporting continuous scale gains. Robust demand also stems from mandated colorectal-cancer screening guidelines beginning at age 45, widening addressable volumes. Oncology, though smaller, is predicted to log the fastest 8.42% CAGR through 2031 as immunotherapy infusions and oral oncolytics migrate to outpatient infusion suites. Favorable safety profiles and shorter chair-time make outpatient cancer care clinically practical and economically compelling.
Ophthalmology sustains momentum via cataract and LASIK procedures, which are highly standardized and benefit from rapid turnover. Orthopedics expands through minimally invasive joint repair with enhanced recovery pathways that minimize inpatient stays. Cardiovascular specialties gain lift from CMS approval of additional cardiac interventions in ambulatory surgery centers, illustrating policy leverage in shaping service mix. Pain management, ENT, dermatology, and urology continue building volumes by integrating image-guided modalities and regenerative therapies that meet rising consumer expectations for quick recovery. Specialty diversification enhances risk mitigation and stabilizes overall revenues within the ambulatory healthcare service market.
By Ownership Model:
Physician Independence ResurgesHospital- and health-system-owned outpatient networks held 31.21% of revenue in 2025, benefiting from referral integration, brand recognition, and centralized purchasing power. These entities capitalize on scale when negotiating supply contracts and payer agreements, preserving margin despite reimbursement headwinds. Yet physician-owned centers are forecast to grow at 9.33% CAGR through 2031, indicating renewed appetite for professional autonomy and equity upside. Clinicians embrace ownership to innovate around scheduling, staffing, and patient-experience design that larger systems sometimes standardize.
Private-equity-backed platforms accelerate roll-up strategies by injecting capital and managerial discipline, often clustering facilities in high-growth urban corridors. Joint-venture models join hospital capital with physician governance, sharing risk while aligning incentives for efficient throughput. Regulatory relaxations in several states are lowering hurdles for independent builds, encouraging new entrants. Competitive tension between scale and personalization continues to shape the ambulatory healthcare service market narrative. Ultimately, survival hinges on an owner’s ability to balance capital access, clinician engagement, and technology adoption.
Geography Analysis
North America Ambulatory Healthcare Service Market
North America controlled 43.12% of global ambulatory revenues in 2025, underpinned by expansive payer coverage, favorable site-of-service differentials, and a mature supply of more than 14,000 urgent care centers. The United States benefits from a 2.9% Medicare payment bump for ASCs, creating immediate cash-flow lift, while Canada’s provincial reforms reward community-based chronic-disease clinics. Mexico’s medical-tourism clusters generate incremental procedure volume that fortifies regional share. Telehealth adoption now touches 23% of encounters, a signal that digital pathways are firmly embedded in the ambulatory healthcare service market.
APAC Ambulatory Healthcare Service Market
Asia-Pacific posts a leading 10.18% CAGR by 2031 as governments fast-track outpatient construction to relieve public-hospital congestion. Singapore’s integrated surgery centers demonstrate best-in-class throughput, China prioritizes domestic production of minimally invasive devices, and Japan subsidizes tele-rehabilitation for seniors. India’s insurance-expansion policies and medical-tourism inflows also funnel capital into multispecialty ambulatory hubs. Demographic aging in the region ensures sustainable demand for cardiovascular, ophthalmic, and orthopedic day surgeries.
EMEA and South America Ambulatory Healthcare Service Market
Europe exhibits steady growth as national health systems tighten budgets and encourage shift-left initiatives. Germany’s gynecology procedures now occur 98% in private free-standing units, and EU-wide value-based frameworks tie reimbursement to care-quality metrics that outpatient sites can meet efficiently. Adoption of teleradiology mitigates radiologist shortages, while relaxed cross-border directives ease patient flow within the bloc. Emerging markets in the Middle East, Africa, and South America invest in private outpatient clusters that complement often overstretched public hospitals, extending the global footprint of the ambulatory healthcare service market.
Regulatory Landscape
Regulation for ambulatory providers is increasingly tied to payment rulemaking and quality reporting, particularly in the United States where the Centers for Medicare & Medicaid Services (CMS) governs both the Hospital Outpatient Prospective Payment System (OPPS) and the Ambulatory Surgical Center (ASC) payment system. The CY 2026 OPPS/ASC final rule (CMS-1834-FC), published in November 2025 and implemented from January 1, 2026, advanced refinements to the ASC Quality Reporting (ASCQR) Program and maintained the linkage between compliance and reimbursement updates. CMS also issued technical corrections effective February 23, 2026 (CMS-1834-CN), reinforcing the cadence of rule updates ambulatory operators must track.
Beyond CMS payment policy, accreditation and patient-safety frameworks shape operating requirements and contracting readiness for outpatient sites. Bodies such as The Joint Commission and the Accreditation Association for Ambulatory Health Care (AAAHC) continue to influence standardized governance practices, while the World Health Organization (including its Regional Office for Europe) has published guidance on quality management frameworks for home- and community-based care, reflecting expanding oversight as services move outside hospitals. MedPAC’s commentary, including its note of about 6,400 Medicare-certified ASCs as of 2024, keeps utilization, cost, and quality in ambulatory settings in focus and strengthens incentives for data-driven compliance and reporting infrastructure.
Competitive Landscape
Competitive intensity is moderate, with fragmentation by service line creating both consolidation plays and niche opportunities. In urgent care, private-equity firms already hold over 30% share in more than 100 U.S. metropolitan areas, illustrating the speed at which institutional capital can aggregate dispersed assets. Large health systems pursue horizontal expansion to retain referrals and capture pre- and post-acute margins, often bolting surgery centers onto existing campus footprints. Physician-led groups differentiate through patient-experience metrics and specialty depth, safeguarding their positions even as capital-heavy players scale.
Digital competencies emerge as a decisive edge. Facilities deploying AI documentation platforms have reported 40% reductions in clerical time, freeing clinicians for extra visits or complex consultations. Cyber-preparedness also influences partnership decisions, as payers and referring providers now screen facilities for security posture before network inclusion. Low-acuity visit sites face encroachment from retail clinics whose extended hours and transparent pricing attract volume. Conversely, high-acuity ambulatory surgery centers defend turf by offering procedural breadth and anesthesia capabilities beyond retail incumbents.
Regulatory moves shape rivalry. CMS expansion of ASC-covered cardiac and orthopedic codes opens lucrative volumes, intensifying competition among multispecialty centers. States diluting certificate-of-need oversight accelerate imaging-center proliferation, tightening spread margins. Yet untapped rural corridors still lack basic outpatient infrastructure, offering whitespace for tele-enabled models. Overall, the ambulatory healthcare service market rewards players that synchronize clinical excellence, cost efficiency, and digital agility.
Ambulatory Healthcare Service Industry Leaders
-
Medical Facilities Corporation
-
Surgery Partners
-
Aspen Healthcare
-
NueHealth
-
Sheridan Healthcare
- *Disclaimer: Major Players sorted in no particular order
Ambulatory Healthcare Service Market Companies Covered in this Report
- Aspen Pharmacare
- Healthway Medical Group
- Medical Facilities
- NueHealth
- Envision / Sheridan Healthcare
- Surgery Partners
- SCA Health (Surgical Care Affiliates)
- Terveystalo Healthcare
- United Surgical Partners International (USPI)
- AmSurg
- Tenet Healthcare
- HCA Healthcare
- Community Health Systems
- TeamHealth
- FastMed Urgent Care
- NextCare Urgent Care
- One Medical
- Oak Street Health
- CVS MinuteClinic
- DaVita Kidney Care
- Kaiser Permanente
Market Opportunities and Future Outlook
Capacity build-outs and new outpatient facilities create near-term whitespace for multi-specialty ambulatory growth, especially where health systems are shifting surgical volume from hospitals to freestanding sites. In 2026, several large projects illustrated this direction: NYU Langone Health opened a 54,000-square-foot ambulatory care facility in Patchogue (New York), Boston Bone & Joint Institute opened a 79,500-square-foot orthopedic facility with an 8-OR ASC in Waltham (Massachusetts) under a USD 105 million project, and CentraCare completed a USD 194 million campus expansion that doubled surgery center capacity from 4 to 10 operating rooms in St. Cloud (Minnesota). These expansions broaden the ambulatory surgery center addressable case mix, including orthopedics and other high-throughput specialties, and increase demand for adjacent outpatient diagnostics, pre-op evaluation, and post-acute follow-up through clinics and virtual pathways.
Workflow automation and documentation tools are another practical lever for operators facing throughput constraints tied to clinician time and staffing pressures. In March 2026, the American Medical Association reported that 81% of physicians use augmented intelligence in practice, up from 38% in 2023, indicating faster normalization of AI-enabled workflows that can support higher visit volumes in primary care and specialty clinics while standardizing documentation across multisite networks. For new builds and renovations, digital planning approaches such as simulation and digital twins are also being used to optimize space, staffing, and supply-flow design, matching the market shift toward complex hybrid outpatient facilities that integrate imaging, sterile processing, and higher-acuity procedure capability.
Recent Industry Developments in Ambulatory Healthcare Service Market
- May 2026: Medical Facilities Corporation disclosed that it completed the January 2026 sale of its majority interest in OSH for approximately USD 46 million, as referenced in its first-quarter 2026 reporting. The divestment reshapes its ambulatory asset mix and capital allocation, affecting how independent operators redeploy proceeds into higher-priority outpatient footprints.
- March 2026: Surgery Partners acquired Preferred Vascular Group, an operator of eight ambulatory surgery centers focused on dialysis access procedures in Georgia and Ohio. The transaction expands Surgery Partners into a specialized, procedure-dense service line and adds regional scale in markets where ASCs compete on throughput and payer contracting.
- January 2026: NueHealth announced four new ambulatory surgery center management partnerships spanning Missouri and New Jersey, including Hackensack Musculoskeletal Surgery Center and The Surgical Center at Columbia Orthopaedic Group. The non-uniform partnership model, with management arrangements alongside other structures, supports faster network expansion without relying solely on outright acquisitions.
Ambulatory Healthcare Service Market Report Scope and Research Methodology
Market Definition and Coverage
For this methodology, the ambulatory health care service market is counted as revenue earned from medical services delivered without an overnight hospital stay, across in-person outpatient sites and virtual care channels.
Scope exclusions: We exclude inpatient ward services, long-term residential care, and the standalone sale of medicines or medical devices that are not billed as part of a care service.
Segments Covered in This Report
- By Service Setting
- Primary Care Clinics
- Surgical Specialty Clinics
- Urgent Care Centers
- Freestanding Emergency Departments
- Diagnostic Imaging Centers
- Specialty Clinics
- Home Healthcare Agencies
- Telehealth & Virtual Clinics
- By Specialty
- Ophthalmology
- Orthopedics
- Gastroenterology
- Cardiovascular
- Pain Management
- Dermatology
- ENT
- Oncology
- Others
- By Ownership Model
- Physician-Owned
- Hospital / Health-System-Owned
- Corporate / Private-Equity-Owned
- Joint-Ventures
- By Geography
- North America
- United States
- Canada
- Mexico
- Europe
- Germany
- United Kingdom
- France
- Italy
- Spain
- Rest of Europe
- Asia-Pacific
- China
- Japan
- India
- Australia
- South Korea
- Rest of Asia-Pacific
- Middle East & Africa
- GCC
- South Africa
- Rest of Middle East & Africa
- South America
- Brazil
- Argentina
- Rest of South America
- North America
Data Sources, Market Sizing, and Validation
Desk Research
Desk work started with public health and utilization signals that explain how much outpatient care is being delivered and where capacity is expanding. Sources such as the World Health Organization, World Bank, OECD health statistics, US CDC datasets, and national health ministry publications were used to anchor population, provider density, outpatient activity, and health spending context.
To turn those signals into a workable revenue model, we also reviewed provider annual reports, audited financial filings, investor decks, and releases from major hospital and clinic associations, which helped confirm service mix trends and pricing direction. Where needed, a paid company financials and intelligence subscription and a paid patent database were used to cross-check business lines and technology direction. These examples are not exhaustive, and many other public and paid references were used to collect data, validate it, and clear up open questions.
Primary Interviews and Surveys
Primary interviews and short surveys were used to test the desk assumptions with people who see day to day outpatient care delivery. We spoke with leadership and operating roles across provider groups, specialty clinics, diagnostic centers, and payor linked stakeholders, and the inputs were balanced across APAC, EMEA, and the Americas to avoid over-weighting one reimbursement system.
Distribution of primary research fieldwork respondents
| Company type | Respondent position | Region |
|---|---|---|
| Top tier: 32% | CXOs: 15% | APAC: 44% |
| Mid tier: 51% | Functional/Unit leaders: 36% | EMEA: 29% |
| Smaller Players: 17% | Managers: 49% | Americas: 27% |
Market-Sizing & Forecasting
Sizing was built using a top-down pathway where outpatient demand pools are reconstructed from population, disease burden, visit and procedure intensity, and the share of care shifted from inpatient to same-day settings. Those totals were then checked with selective bottom-up approximations, such as sampled provider revenue per site, typical visits per physician, and a few channel checks on average revenue per encounter, which helped adjust for under-reporting in thin data countries.
Inputs that mattered most were outpatient visit volumes, procedure mix shifting toward day surgery, reimbursement and copay direction, clinician and facility capacity (clinics, imaging, and freestanding centers), and the adoption rate of virtual consultations that changes how encounters are counted. Forecasts were developed using scenario analysis supported by a light multivariate regression view, where growth paths were linked to health spending growth, aging mix, and outpatient utilization trends agreed by interviewees. When a service line lacked direct public volume data, gaps were handled through proxy ratios (such as visits per 1,000 population) that were rechecked with field feedback before finalizing totals.
Data Validation & Update Cycle
Outputs were cross-checked against independent signals like healthcare expenditure trajectories, outpatient utilization trends, and provider capacity additions, and then the variances were investigated before sign-off. Outliers at country or region level were reworked by revisiting assumptions, and follow-up calls were triggered when an assumption moved the total more than expected.
Reports are refreshed on an annual cycle, and interim updates are made when material policy, reimbursement, or major delivery-model shifts occur. Before delivery, a final analyst pass is completed so the client receives the most current view reflected in the model tables.
Mordor Intelligence's Ambulatory Health Care Service Market Estimate Compared With Other Published Estimates
Published market sizes for ambulatory health care services often do not match because the counted revenue boundary varies and so does the year used to anchor currency and inflation. Differences also come from whether virtual visits are counted as a care service, and whether emergency department activity inside hospitals is blended into ambulatory totals.
By tracking outpatient-only revenue signals and encounter mix, Mordor Intelligence keeps the count limited to same-day service delivery (including virtual consults) and excludes inpatient wards and standalone product sales, which creates a smaller total than estimates that map the whole ambulatory care economy from broad healthcare spending ratios.
Benchmark comparison
| Source | Market Size | Gaps in Research Methodology |
|---|---|---|
| Mordor Intelligence | USD 4.40 B (2026) | |
| Global Consultancy A | USD 878.40 B (2024) | Uses a much broader ambulatory health care services boundary and totals by large facility types, which typically captures wide outpatient categories and can overlap with hospital outpatient departments. |
| Industry Publisher B | USD 250.00 B (2024) | Applies a wider service taxonomy and longer forecast window, and the sizing approach appears to be anchored to generalized segment splits rather than tight encounter and revenue reconciliation. |
The spread is mainly explained by scope and accounting choices, not by small math differences. When the market is tied back to clear outpatient service revenue and checked against utilization and capacity signals, the result is easier to reproduce and to stress-test across regions.
Key Questions Answered in the Report
What is the current value of the ambulatory healthcare service market?
The market stands at USD 4.40 billion in 2026 and is projected to reach USD 5.81 billion by 2031.
Which service setting holds the largest share?
Primary care clinics command 39.74% of 2025 revenues, reflecting their central role in care coordination.
Which specialty is expanding fastest?
Oncology services show the highest forecast growth at an 8.42% CAGR through 2031 as more cancer therapies move to outpatient settings.
Why is Asia-Pacific the fastest-growing region?
Rapid infrastructure build-out, supportive government policies, and demographic aging drive the region’s 10.18% CAGR.
How are workforce shortages affecting growth?
Physician deficits and clinician burnout reduce available staffing, subtracting an estimated 1.4 percentage points from the market’s CAGR.
What strategies help providers stay competitive?
Successful operators combine disciplined cost management, technology adoption such as AI documentation, and targeted expansion into underserved geographies.