
Ambulance Services Market Size and Share
Market Overview
| Study Period | 2020 - 2031 |
|---|---|
| Market Size (2026) | USD 65.19 Billion |
| Market Size (2031) | USD 95.55 Billion |
| Growth Rate (2026 - 2031) | 7.94 % |
| Fastest Growing Market | Asia Pacific |
| Largest Market | North America |
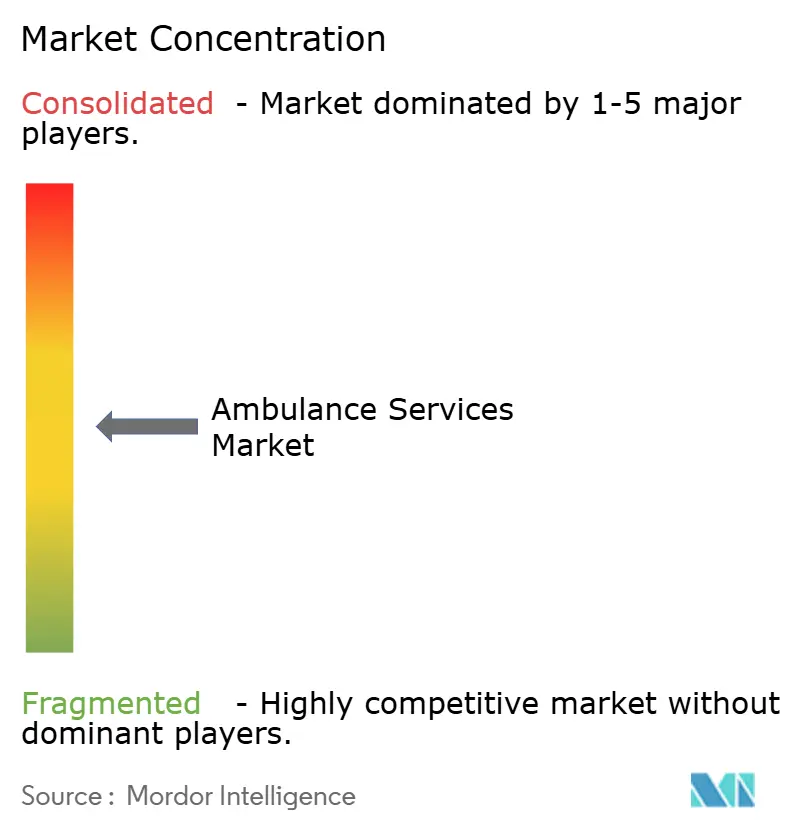
| Market Concentration | Medium |
Major Players *Disclaimer: Major Players sorted in no particular order Image © Mordor Intelligence. Reuse requires attribution under CC BY 4.0. | |
Ambulance Services Market Analysis by Mordor Intelligence
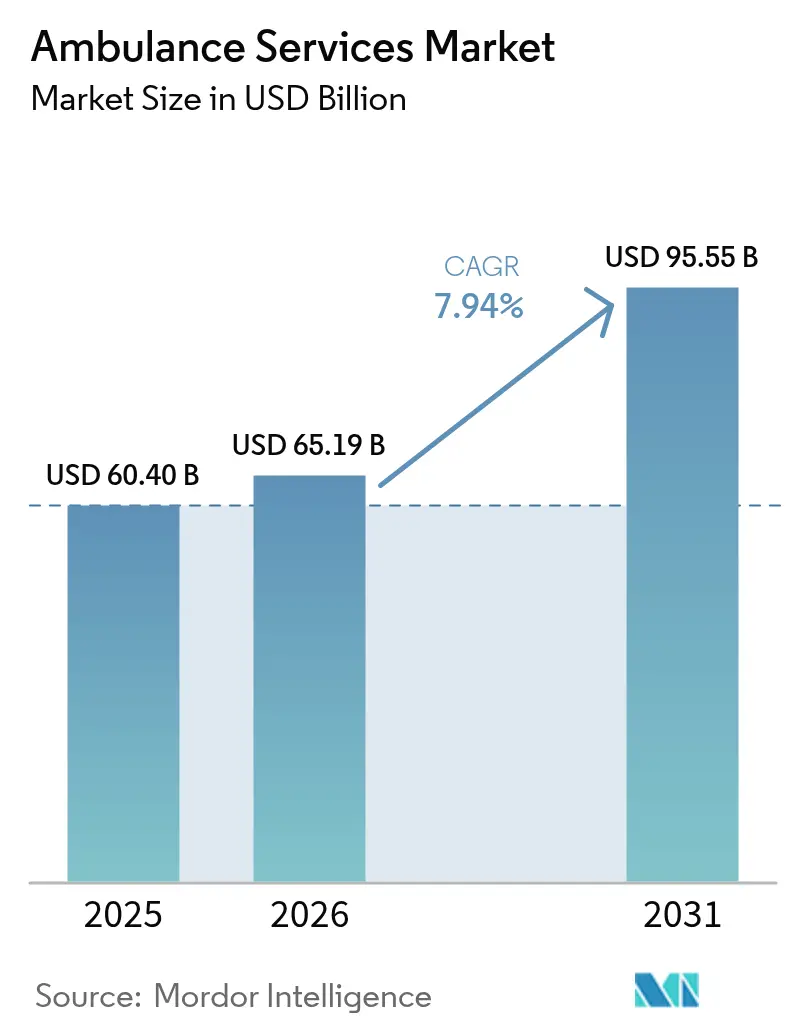
The ambulance services market size was valued at USD 60.40 billion in 2025 and estimated to grow from USD 65.19 billion in 2026 to reach USD 95.55 billion by 2031, at a CAGR of 7.94% during the forecast period (2026-2031). Escalating cardiovascular emergencies, rising fall-related trauma among older adults, and steady chronic-disease prevalence anchor dispatch volumes regardless of economic cycles[1]. Public-private funding programs, notably the USD 50 billion U.S. Rural Health Transformation Program, continue to subsidize fleet expansion and paramedic training in underserved regions[2]. Tele-EMS platforms are shortening on-scene times; Germany’s tele-emergency physician model and Minnesota’s SMART-EMS program each recorded clinically meaningful time savings that translate into improved survival rates. Ground fleets still dominate, yet faster-growing air and drone assets point to a bifurcation between high-volume urban response and high-margin critical-care transport. Cost-efficient electric vehicles and predictive dispatch algorithms are widening operating margins for data-savvy private operators, even as capital and workforce constraints persist.
Key Report Takeaways
- By mode of transport, ground ambulances led with 70.55% of the ambulance services market share in 2025, while air ambulances are projected to record the highest 10.25% CAGR through 2031.
- By equipment type, basic life support captured 45.53% of the ambulance services market in 2025, and advanced life support is advancing at a 9.75% CAGR through 2031.
- By type of service, emergency response accounted for 60.15% of 2025 revenue; non-emergency medical transport is forecast to expand at a 9.82% CAGR through 2031.
- By ownership, government and municipal agencies held a 38.65% share in 2025, whereas private corporate operators are growing fastest at an 8.32% CAGR.
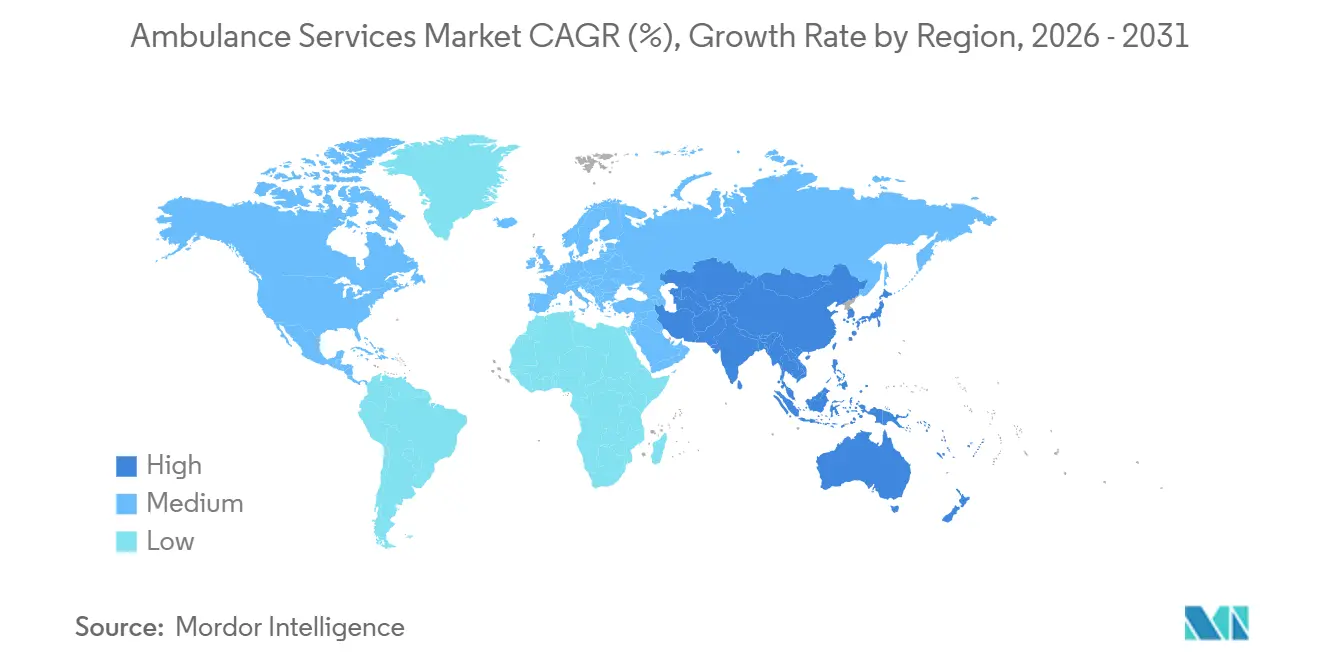
- By geography, North America commanded 35.23% revenue share in 2025, and Asia-Pacific is set to register the strongest 9.12% CAGR to 2031.
Note: Market size and forecast figures in this report are generated using Mordor Intelligence’s proprietary estimation framework, updated with the latest available data and insights as of 2026.
Market Trends and Insights
Drivers Impact Analysis of Ambulance Services Market*
| Driver | (~) % Impact on CAGR Forecast | Geographic Relevance | Impact Timeline |
|---|---|---|---|
| Rising Global Trauma & Cardiovascular Emergencies | +1.8% | Global, with acute concentration in North America and Europe | Medium term (2-4 years) |
| Ageing Demographics & Chronic-Disease Burden | +2.1% | Global, most pronounced in Japan, Europe, and North America | Long term (≥ 4 years) |
| Public-Private Funding Programmes Expanding EMS Networks | +1.5% | North America, Asia-Pacific (India, China), Sub-Saharan Africa | Short term (≤ 2 years) |
| Tele-EMS Integration & Real-Time Clinical Decision Support | +1.2% | North America, Europe (Germany, UK), South Korea | Medium term (2-4 years) |
| Emergence of Electric/EV Ambulances Lowering Life-Cycle Cost | +0.9% | North America, Europe (UK, Scandinavia), China | Medium term (2-4 years) |
| Drone-Enabled Rapid First-Response Kits in Remote Zones | +0.7% | Sub-Saharan Africa (Rwanda), North America (rural), Australia | Long term (≥ 4 years) |
| Source: Mordor Intelligence | |||
Rising Global Trauma & Cardiovascular Emergencies
Cardiac arrest incidents reached 137,119 across U.S. jurisdictions in 2024, equating to an incidence of 78.7 per 100,000 population. Bystander CPR rates remain below 50%, heightening reliance on rapid paramedic response. Older-adult falls continue to drive roughly 3 million emergency department visits each year in the United States. U.S. traffic collisions caused 42,514 fatalities in 2024, reinforcing the need for trauma-capable fleets[3]. Together, these acute events form a demand baseline that is largely immune to macroeconomic swings.
Ageing Demographics & Chronic-Disease Burden
By 2035, adults aged 65 and older will account for 22% of the U.S. population, and in Japan, older adults already account for 62% of ambulance transports. Medicare beneficiaries average 1.8 ambulance rides per year, compared with 0.3 in the general population. India’s 108 network logged a 28% increase in geriatric calls between 2023 and 2025. The prevalence of COPD, heart failure, and diabetes complications necessitates ALS-equipped vehicles able to administer IV drugs and CPAP during transport. This demographic shift is set to maintain upward pressure on fleet capacity and specialized staffing.
Public-Private Funding Programmes Expanding EMS Networks
HRSA’s five-year, USD 50 billion Rural Health Transformation allocation is underwriting new ambulances, dispatch centers, and paramedic scholarships in sparsely populated U.S. counties. Maine distributed USD 31 million in stabilization grants to shore up volunteer services. India’s National Health Mission added 5,000 ambulances across 120 districts in 2024-2025. China’s mandate for citywide ten-minute average response times by 2027 has triggered large-scale municipal fleet orders. These infusions reduce upfront capital barriers and improve geographic equity of coverage.
Tele-EMS Integration & Real-Time Clinical Decision Support
Minnesota’s USD 9.9 million SMART-EMS project cut average on-scene times by 4.2 minutes for stroke and MI cases. Germany’s nationwide tele-emergency physician model enables on-board paramedics to receive real-time physician guidance, speeding medication decisions. Seoul’s CONNECT-AI reroutes ambulances automatically based on bed availability forecasts. Regulatory advances such as the Interstate Medical Licensure Compact are easing cross-state telemedicine credentialing. Collectively, these systems reduce morbidity through faster definitive care.
Restraints Impact Analysis of Ambulance Services Market*
| Restraint | (~) % Impact on CAGR Forecast | Geographic Relevance | Impact Timeline |
|---|---|---|---|
| High Capital & Operating Expenditure | -1.3% | Global, acute in rural North America, Sub-Saharan Africa, and Latin America | Short term (≤ 2 years) |
| Shortage of Trained Paramedics & Pilots | -0.9% | North America, Europe, Australia | Medium term (2-4 years) |
| Competitive Pressure from Rideshare Health-Transport Services | -0.6% | North America, Europe, urban Asia-Pacific | Short term (≤ 2 years) |
| Fragmented Multi-Jurisdictional Accreditation Inflating Compliance Cost | -0.5% | North America (multi-state operators), Europe (cross-border services) | Medium term (2-4 years) |
| Source: Mordor Intelligence | |||
High Capital & Operating Expenditure
ALS-ready Type III vans cost USD 150,000-300,000, and air ambulance helicopters require USD 3-5 million, excluding hangar investments[4]. Operating outlays range from USD 1.5 to 3 million annually for small systems, with labor accounting for up to 70% of the spend. Medicare’s 2024 fee-schedule bump of 1.3% trails the 4.2% annual cost rise reported by the American Ambulance Association. Electric units promise lower lifetime expenses yet remain price-premium purchases. Rural providers often depend on municipal subsidies or volunteer staffing to remain solvent.
Shortage of Trained Paramedics & Pilots
NAEMT’s 2024 survey found 62% of U.S. agencies short on paramedics, with burnout and wage dissatisfaction as key drivers. Accredited paramedic courses have median 18-month waitlists and 70% completion rates. Helicopter EMS relies on scarce pilot-paramedic skill combinations; fewer than 5% of EMS professionals hold both instrument-flight and critical-care credentials. Australia’s Ambulance Victoria reported a 22% vacancy rate despite AUD 15,000 sign-on bonuses in 2024. Heightened labor scarcity inflates compensation costs and constrains service hours.
*Our forecasts treat driver/restraint impacts as directional, not additive. The impact forecasts reflect baseline growth, mix effects, and variable interactions.
Ambulance Services Market Segment Analysis
By Mode of Transport:
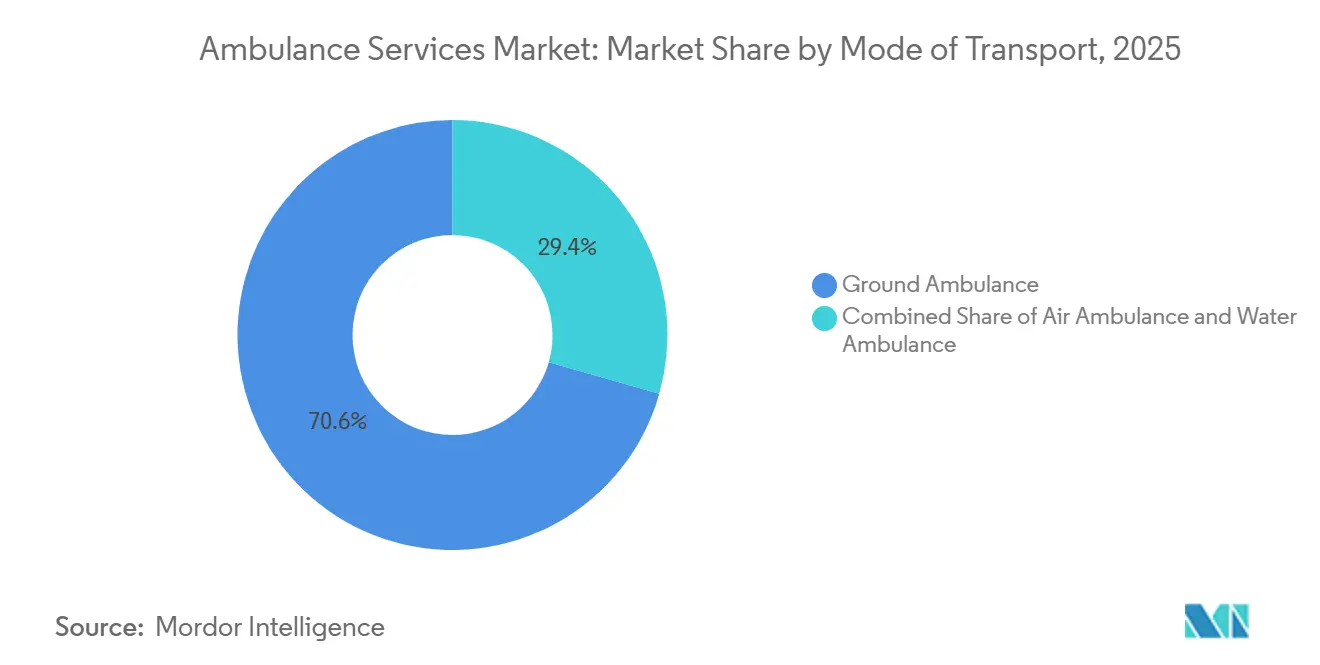
Ground Dominance Meets Aerial AccelerationGround vehicles accounted for 70.55% of 2025 revenue in the ambulance services market, underscoring their primacy in urban response. Air units are expanding at a 10.25% CAGR as rural trauma and interfacility critical-care needs multiply. The ambulance services market for rotary-wing missions is projected to expand as metropolitan rooftop helipads open and reimbursement parity with ground ALS trips is achieved. Type III vans dominate mixed-acuity fleets owing to modular interior space, whereas heavy truck-based Type I models support bulky cardiac equipment in suburban ALS calls. Electric propulsion trials in New York and London indicate diesel displacement potential once battery costs fall below USD 200/kWh. Air fleets are differentiating via night-vision avionics and satellite tele-ICU links that extend physician oversight mid-flight. Fixed-wing craft cater to long-range repatriations beyond 150 nautical miles, bridging tertiary-care gaps in archipelagos and desert regions.
Aerial providers are integrating AI-driven route optimization to minimize weather diversions, boosting dispatch reliability. Regulatory acceleration under FAA Part 135 amendments is expected to streamline cross-state licensing of medical crews, promoting multi-base network scaling. Meanwhile, water ambulances serve niche geographies such as Venice, handling 30,000 annual calls and proving essential for cities bisected by waterways. Electric fleets could reshape cost structures, but initial procurement premiums remain a hurdle for tax-constrained municipalities.

By Equipment:
BLS Volume Versus ALS MarginBLS rigs retained 45.53% revenue in 2025 across the ambulance services market, reflecting high-frequency, low-acuity transports paid on volume. ALS configurations are on a 9.75% CAGR trajectory, capturing expanding reimbursement differentials as payers reward pre-hospital ECG transmission and advanced airway interventions. The ambulance services market's advantage in ALS size grows when bundled payments tie outcomes to early treatment initiation. Specialty Care Transport, although a fraction of total runs, commands the highest per-trip revenue by moving ECMO and neonatal ICU patients between tertiary centers. Point-of-care ultrasound adoption is blurring traditional BLS-ALS boundaries and could recalibrate pricing models. CAMTS accreditation is aligning SCT standards globally, easing cross-border patient transfers.
Financially, ALS equipment packages cost USD 50,000-80,000, triple BLS equivalents, yet pay back faster under value-based reimbursement. Portable lab analyzers and mechanical CPR devices enhance survival metrics, underpinning payer willingness to reimburse at premium rates. Lower-tech BLS fleets risk margin erosion from rideshare NEMT competitors unless paired with bundled hospital discharge contracts.
By Type of Service:
Emergency Core, Non-Emergency SurgeEmergency responses accounted for 60.15% of 2025 revenue in the ambulance services market, but non-emergency medical transport is growing at a 9.82% CAGR through 2031. Medicare pays USD 450-650 for ALS emergency trips compared with USD 200-300 for BLS non-emergency runs, yet hospital discharge volumes skew toward the latter. Uber Health and Lyft deliver ambulatory patient rides at 40-60% lower prices than legacy ambulance firms, intensifying price competition in city corridors. Traditional providers are reacting by forming dedicated NEMT subsidiaries with basic vans and EMT-B crews, protecting emergency fleet availability. Integrated health systems leverage in-house NEMT to reduce surgical readmission penalties under bundled-payment models.
Regulatory firewalls remain: many states require ambulance licensure even for wheelchair vans, partially shielding incumbents. Nevertheless, digital scheduling platforms and transparent pricing give rideshare entrants a compelling value proposition for managed-care organizations aiming to curtail transport spend.
By Ownership:
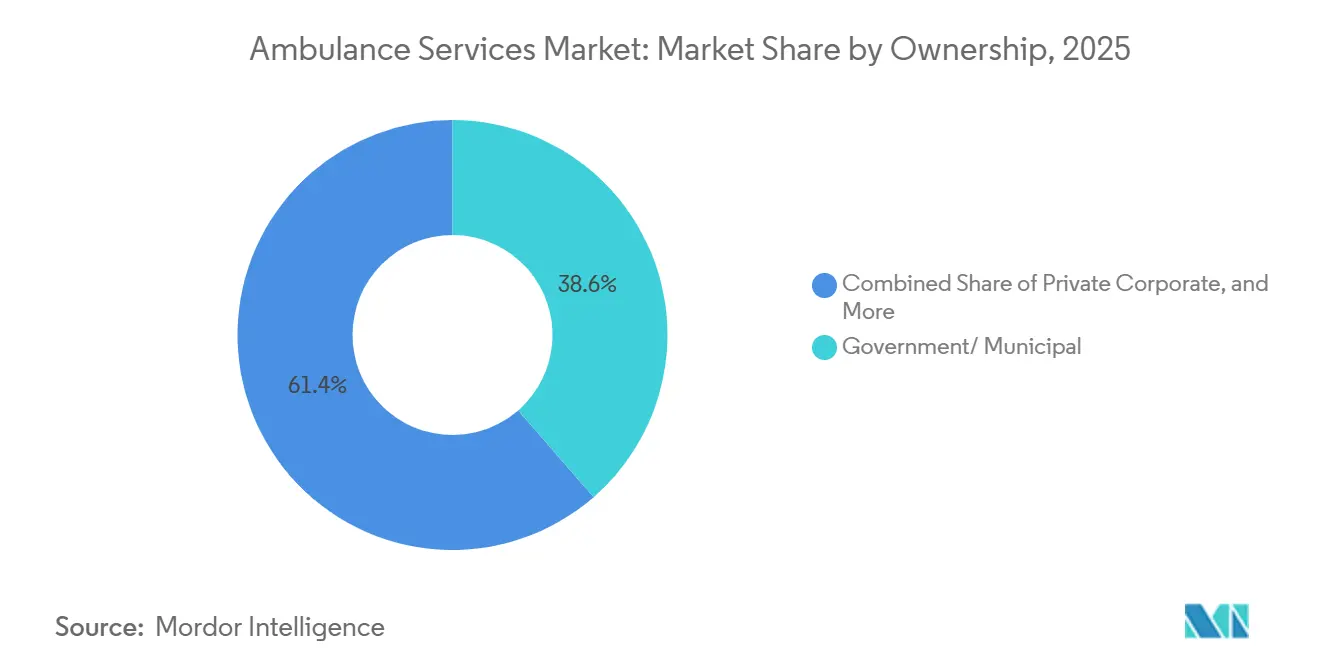
Public Incumbency, Private MomentumGovernment and municipal services accounted for 38.65% of 2025 revenue, chiefly through fire-based and third-service models funded by tax levies. Private firms led by AMR and Falck are compounding at 8.32% CAGR, winning multi-year contracts that shift response-time risk away from municipalities. Performance-based contract structures reward call-center AI and predictive maintenance systems that lift utilization by 10-15%. Volunteer agencies, while numerically dominant in rural North America, confront tightening training mandates and dwindling enrollment. Hybrid governance models show traction: Colorado’s 2024 grants require private partners to observe public-sector wage floors, ensuring local labor buy-in.
Hospital-based operations continue to expand, as vertical integration reduces interfacility leakage, especially for high-margin cardiac and stroke transfers. India’s GVK EMRI exhibits a scalable public-private approach, covering 20 states and logging 30 million cumulative emergency calls.
Geography Analysis
North America Ambulance Services Market
North America captured 35.23% of global revenue in 2025, driven by high per-capita spend and comprehensive insurance coverage. The United States alone fields more than 20,000 EMS agencies with heterogeneous fire, hospital, and private ownership patterns. Provincial consolidation in Canada trimmed administrative overhead by 22% following British Columbia’s 2024 integration, evidence of scale benefits. Mexico’s expansion remains uneven due to fiscal constraints.
APAC Ambulance Services Market
Asia-Pacific’s 9.12% CAGR rise is propelled by Chinese and Indian infrastructure mandates. China’s 10-minute urban response standard, due in 2027, has moved fleet orders to provincial budgets. India’s 108 network deployment across 120 new districts brings rural coverage into parity with urban centers. Japan manages demographic pressure, as older adults already account for 62% of ambulance transports. Australia’s Royal Flying Doctor Service underscores the importance of aeromedical coverage over vast geographies.
Europe, GCC and South America Ambulance Services Market
Europe benefits from universal insurance and regulatory harmonization. Germany’s tele-physician program trims on-scene times and boosts survival odds. The United Kingdom trialed electric ambulances to satisfy clean-air rules, foreshadowing wider fleet conversions. GCC states such as the UAE achieve sub-eight-minute urban response through centralized command centers. South America remains fragmented; Brazil’s SAMU relies on federal funding while private players dominate in Argentina and Chile.
Competitive Landscape
The ambulance services market is moderately concentrated; the ten largest operators collectively hold nearly half of global revenue. Performance-based municipal contracts spur competition among AMR, Falck, and Global Medical Response, all of which invest in AI dispatch tools to improve fleet productivity. Hospital systems retain competitive advantages within integrated care pathways by curbing leakage through ownership of inbound and interfacility transport. Technology adoption, from predictive maintenance telemetry to tele-ICU links, now differentiates operators more than fleet size alone. Electric vehicles and drone logistics represent white space where early entrants can capture regulatory goodwill and sustainability branding.
Rideshare health-transport platforms erode margin in the non-emergency segment, compelling incumbents to cut costs or specialize in higher-acuity services. Accreditations such as CAMTS and ISO 13485 create compliance hurdles that favor operators with robust quality management teams. Consolidation momentum is evident: Acadian Ambulance purchased three regional services in 2025, and Air Methods launched a tele-critical-care platform to deepen value per transport. The market is likely to stratify into integrated full-service leaders and niche disruptors targeting last-mile logistics.
Ambulance Services Industry Leaders
-
Envision Healthcare Corporation
-
Falck Holding A/S
-
Acadian Ambulance Service, Inc.
-
Ziqitza Health Care Limited
-
Medivic Aviation
- *Disclaimer: Major Players sorted in no particular order
Ambulance Services Market Companies Covered in this Report
- Acadian Ambulance Service
- Aero Asahi Corporation
- Air Charter Services Ltd
- Air Medical Group Holdings
- Air Methods
- American Medical Response
- BVG India
- CareFlight International
- Dutch Health B.V.
- EMS Group
- Envision Healthcare
- Express Ambulances India
- Falck A/S
- Global Medical Response (GMR)
- GVK EMRI
- Lifeline Ambulance Services
- London Ambulance Service NHS Trust
- Medivic Aviation
- National Ambulance LLC
- PHI Air Medical
- REVA Air Ambulance
- SA Ambulance Service
- Scandinavian AirAmbulance
- St John Ambulance Australia
- Ziqitza Health Care Ltd
Recent Industry Developments in Ambulance Services Market
- February 2026: The City of Fullerton, California, inaugurated a municipal ambulance division to enhance integrated fire-EMS response.
- December 2025: Sterling Hospitals introduced a dedicated emergency response ambulance fleet in Ahmedabad, India.
Ambulance Services Market Report Scope and Research Methodology
Market Definition and Coverage
For this study, the ambulance services market includes paid patient transport and pre-hospital care delivered through dispatched ambulances, covering emergency response and scheduled medical transport where clinical support is provided during transit.
Scope exclusions: It excludes general taxis and ride-hailing trips without medical staff, routine courier logistics, and in-hospital transport that does not use an ambulance provider.
Segments Covered in This Report
- By Mode of Transport
- Air Ambulance
- Rotary-Wing
- Fixed-Wing
- Water Ambulance
- Ground Ambulance
- Type III Van
- Type I/II Modular
- Hybrid-Electric/EV Ambulance
- Air Ambulance
- By Equipment
- Basic Life Support (BLS) Services
- Advanced Life Support (ALS) Services
- Specialty Care Transport (SCT)
- By Type of Service
- Emergency Services
- Non-Emergency Services
- By Ownership
- Government/Municipal
- Private Corporate
- Hospital-Based
- Volunteer/NGO
- By Geography
- North America
- United States
- Canada
- Mexico
- Europe
- Germany
- United Kingdom
- France
- Italy
- Spain
- Rest of Europe
- Asia-Pacific
- China
- India
- Japan
- Australia
- South Korea
- Rest of Asia-Pacific
- Middle East and Africa
- GCC
- South Africa
- Rest of Middle East and Africa
- South America
- Brazil
- Argentina
- Rest of South America
- North America
Data Sources, Market Sizing, and Validation
Desk Research
Desk research starts by mapping how demand is created and funded, then linking it to measurable signals like emergency call volumes, hospital admissions, and public reimbursement rules. We used public sources such as the US Centers for Medicare and Medicaid Services, the US Centers for Disease Control and Prevention, the World Health Organization, OECD health statistics, and national health ministry releases to ground the model in consistent time series.
On the supply side, patterns were checked using operator disclosures like annual reports, audited financial statements, and investor presentations, followed by regulator and association material that explains response-time standards and licensing requirements. Supporting datasets from paid subscriptions were used selectively for company financials, news tracking, and patent lookups tied to dispatch and vehicle medical equipment trends. These examples are not exhaustive, and many other public sources were also reviewed for data collection, validation, and clarification.
Primary Interviews and Surveys
Primary work was done to verify what desk sources cannot show cleanly, especially the split between emergency and non-emergency revenue, typical reimbursement realization, and how fleet utilization changes by region and payer mix. We spoke with a mix of private operators, hospital-based EMS teams, dispatch and operations leaders, and procurement and billing specialists across major regions so assumptions could be confirmed and adjusted where local practice differs.
Distribution of primary research fieldwork respondents
| Company type | Respondent position | Region |
|---|---|---|
| Top tier: 29% | CXOs: 16% | APAC: 49% |
| Mid tier: 54% | Functional/Unit leaders: 28% | EMEA: 33% |
| Smaller Players: 17% | Managers: 56% | Americas: 18% |
Market-Sizing & Forecasting
Sizing is built using a top-down approach where emergency care utilization and transport activity are reconstructed into a service revenue pool by geography, and then scaled using payer mix and typical reimbursement and cash-pay levels. To keep the totals realistic, the outputs are corroborated with selective bottom-up checks, such as sampled provider revenue roll-ups, fleet count and utilization cross-checks, and volume by service type multiplied by observed average charges.
Inputs that materially move the model include emergency call-out volumes, share of transports requiring advanced life support versus basic life support, average trip distance and time on task, fleet availability and utilization, and reimbursement policy changes that alter realized rates. Where a variable is not available consistently, we use proxy indicators like hospital admission trends or EMS run-rate disclosures, then narrow the range through interview feedback.
Forecasting uses scenario analysis supported by trend lines on utilization and pricing, and then it is refined by expert views on staffing availability, response-time compliance investments, and public funding direction. The final forecast is adjusted where constraints are likely, such as paramedic shortages, fleet renewal cycles, and regional differences in non-emergency transport contracting.
Data Validation & Update Cycle
Validation is done through multiple checks so the market total stays consistent with real-world signals. Outputs are compared against independent indicators such as healthcare spending direction, emergency department throughput, and operator margin patterns, and any large variance triggers a deeper review of the related assumptions.
Before sign-off, the model and key drivers go through stepwise analyst reviews, and clarifications are rechecked with respondents when results look out of line for a region or service type. Reports are refreshed annually, and interim updates are made when material events shift demand or reimbursement, followed by a final pre-delivery pass so clients receive the latest view.
Mordor Intelligence's Ambulance Services Market Size Compared Against Other Published Estimates
Published market sizes for ambulance services often do not match because the boundary of what is counted is not always the same, and because pricing and utilization assumptions can be refreshed at different times. Differences also show up when one estimate starts from provider revenues while another starts from healthcare activity and then converts it into service value.
By tracking reimbursement realization, fleet utilization, and emergency versus non-emergency mix at the country level, Mordor Intelligence keeps the 2026 total aligned to an addressable transport and pre-hospital care demand pool, rather than blending in adjacent patient mobility spending. Some studies also apply faster pricing ramps or include broader non-medical transport, which can move the number up or down even when the same regions are covered.
Benchmark comparison
| Source | Market Size | Gaps in Research Methodology |
|---|---|---|
| Mordor Intelligence | USD 65.19 B (2026) | |
| Industry Publisher A | USD 62.35 B (2025) | Uses a different base year and a longer forecast window, and its 2025 value can reflect a broader transport-vehicle lens that blends capability and service boundaries differently across regions. |
| Industry Publisher B | USD 45.13 B (2024) | Starts from a lower base-year revenue pool, and the gap can be driven by narrower inclusion of paid medical transports, different currency timing, and a more aggressive growth curve that compounds from a smaller starting point. |
Taken together, the spread is mostly explained by what is included around non-emergency transport, how reimbursement and cash-pay pricing are normalized, and which year is treated as the starting point. The approach here stays traceable because each step ties back to measurable utilization and rate inputs, then it is sanity-checked against provider-side signals before the total is finalized.
Key Questions Answered in the Report
How large will the ambulance services market be by 2031?
It is projected to reach USD 95.55 billion by 2031, expanding at a 7.94% CAGR from 2026.
Which segment is growing fastest within global ambulance transport?
Air ambulance transport is forecast to rise at 10.25% CAGR through 2031 due to critical-care demand in remote regions.
Why are non-emergency medical transports accelerating?
Hospital discharge protocols and Medicare Advantage programs favor scheduled, lower-cost rides, driving a 9.82% CAGR in non-emergency trips.
How are electric ambulances affecting provider costs?
Pilot data from New York City indicate 40% savings in fuel and maintenance over a diesel unit’s 10-year life, despite higher upfront prices.
What regions present the strongest growth opportunities?
Asia-Pacific leads with a 9.12% CAGR through 2031, underpinned by Chinese and Indian fleet build-outs and urban trauma volumes.
How serious is the paramedic shortage challenge?
In 2024, 62% of U.S. EMS agencies reported staffing gaps, pushing wages higher and forcing some services to limit operating hours.