
Alternator Market Size and Share
Market Overview
| Study Period | 2020 - 2031 |
|---|---|
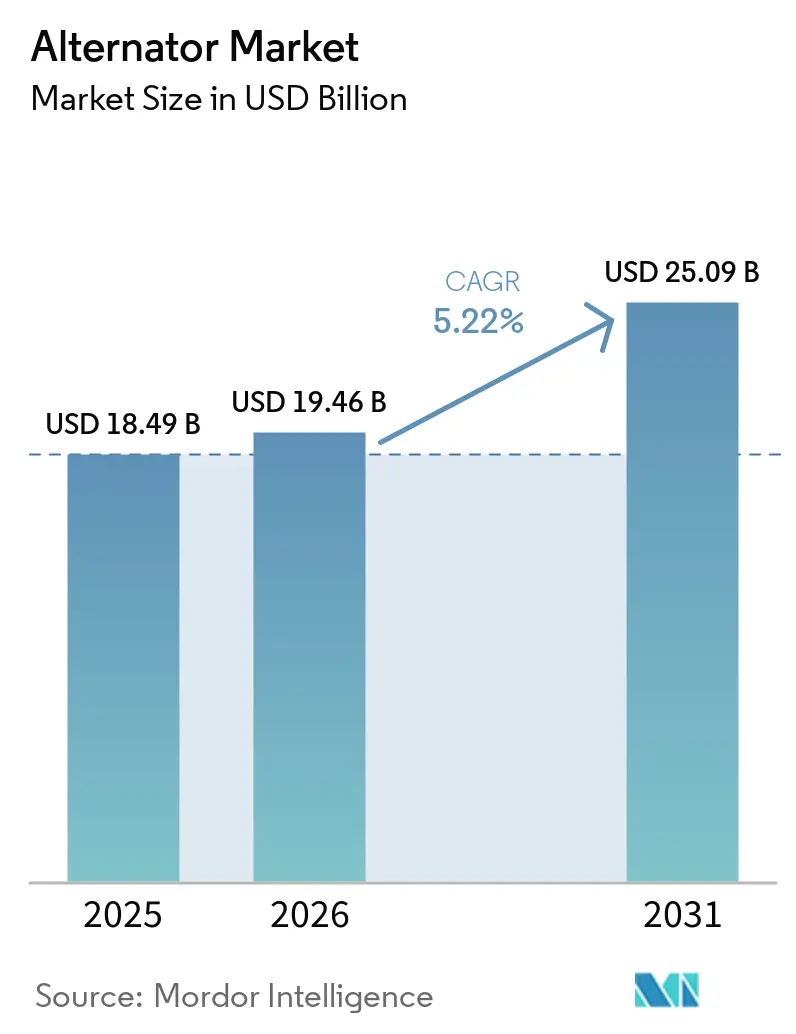
| Market Size (2026) | USD 19.46 Billion |
| Market Size (2031) | USD 25.09 Billion |
| Growth Rate (2026 - 2031) | 5.22 % |
| Fastest Growing Market | Asia Pacific |
| Largest Market | Asia Pacific |
| Market Concentration | Medium |
Major Players
*Disclaimer: Major Players sorted in no particular order Image © Mordor Intelligence. Reuse requires attribution under CC BY 4.0. |
|
Alternator Market Analysis by Mordor Intelligence
The alternator market size is expected to grow from USD 18.49 billion in 2025 to USD 19.46 billion in 2026 and is forecast to reach USD 25.09 billion by 2031 at 5.22% CAGR over 2026-2031. Grid modernization programs in developing economies, the rapid build-out of hyperscale and edge data centers that require uninterrupted standby generation, and automation-heavy manufacturing lines that cannot tolerate voltage sags, together underpin near-term demand momentum. Shifting environmental policies are tilting procurement toward gas-turbine units that pair high thermal efficiency with lower emissions. Meanwhile, ultra-high-voltage transmission corridors in China and cross-border interconnections funded by the Asian Development Bank are facilitating the installation of multi-megawatt synchronous condenser installations.[1] Manufacturers are layering IoT sensors onto stator frames and bearings to enable predictive maintenance, which cuts unplanned downtime by up to 25% and sharpens total-cost-of-ownership economics. Meanwhile, lithium-ion battery storage surpassed 42 GWh of annual deployments in 2024 and is gaining share in four-hour backup applications, yet alternators still prevail where multi-day runtime, extreme temperatures, or fuel flexibility dominate the selection criteria.
Key Report Takeaways
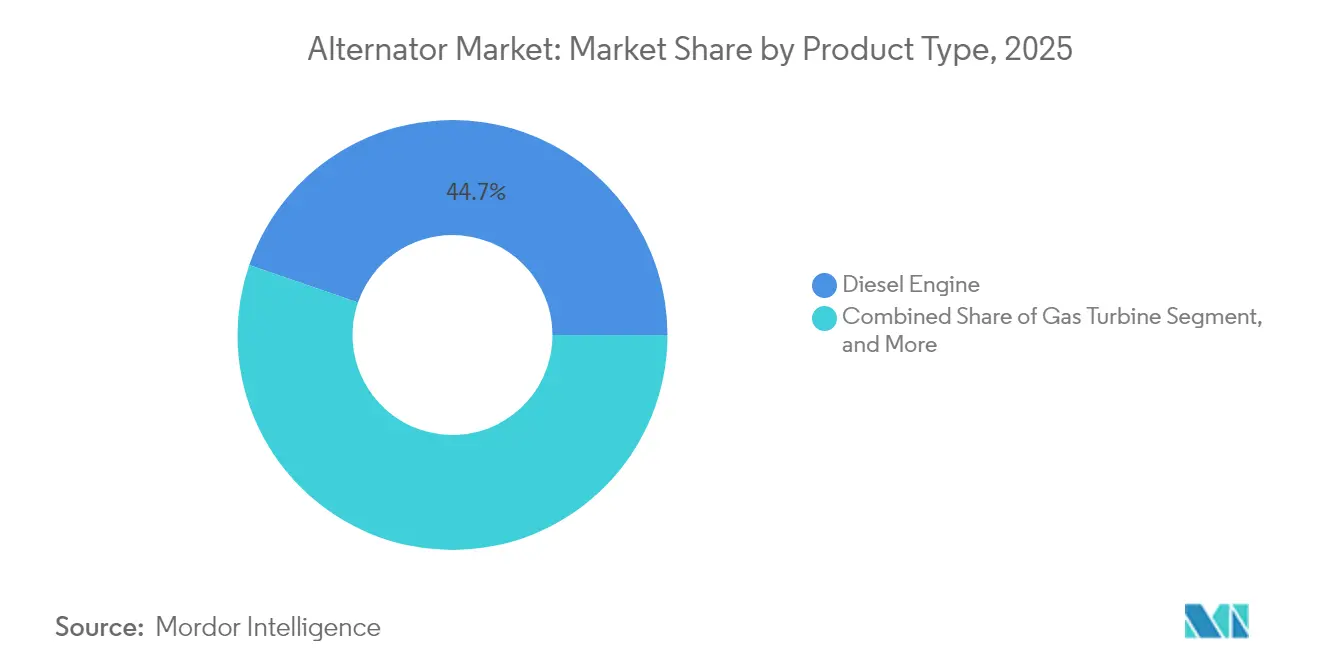
- By product type, diesel-engine units led with 44.72% revenue share in 2025, whereas gas-turbine alternators are projected to expand at a 6.78% CAGR through 2031.
- By power range, the 60-300 kW class accounted for 30.05% of 2025 demand, while the 5-20 MW bracket is advancing at a 7.05% CAGR to 2031.
- By application, industrial and commercial facilities captured 32.18% of the 2025 spend, yet data centers are the fastest-growing end-use sector with a 8.62% CAGR through 2031.
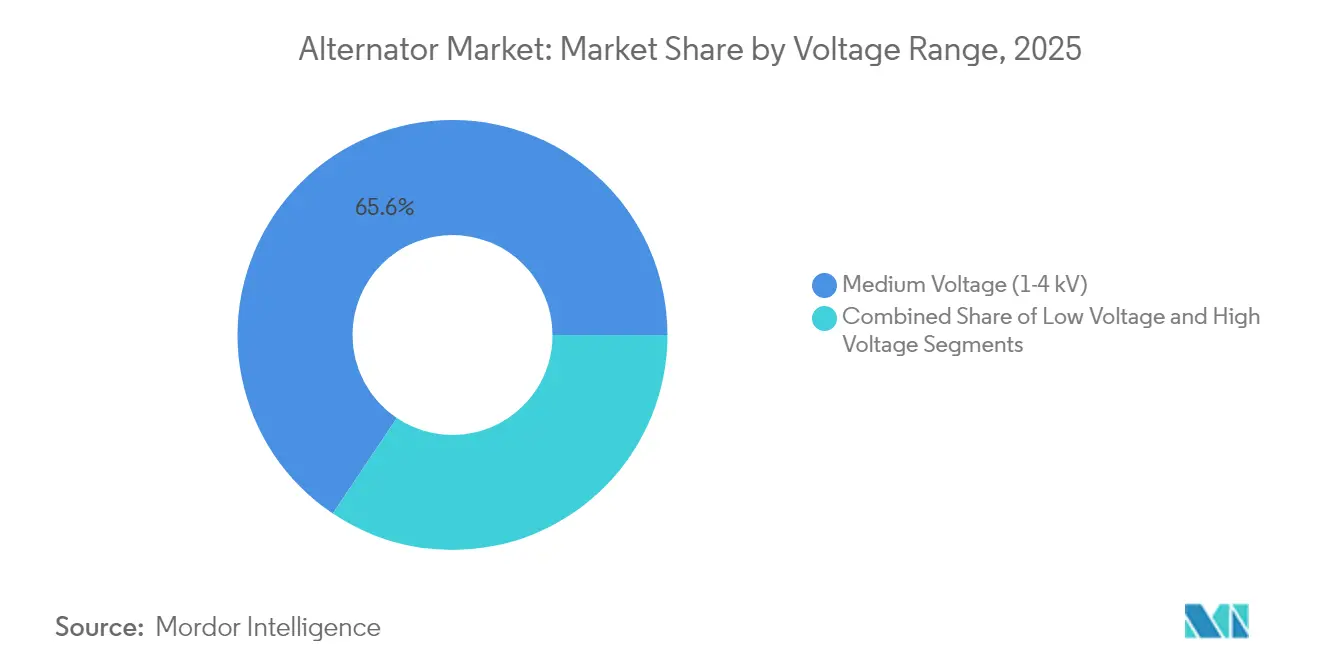
- By voltage, medium-voltage machines in the 1-4 kV band retained 65.60% share in 2025; high-voltage units above 4.16 kV are forecast to climb at a 6.42% CAGR.
- By phase, three-phase designs accounted for 51.88% of the volume in 2025, whereas single-phase units are expected to grow at a 5.86% CAGR through 2031.
- By geography, the Asia-Pacific region dominated with 41.05% of global revenue in 2025 and is poised for a 6.48% CAGR to 2031 as China and India ramp up grid-reinforcement spending.
Note: Market size and forecast figures in this report are generated using Mordor Intelligence’s proprietary estimation framework, updated with the latest available data and insights as of 2026.
Market Trends and Insights
Drivers Impact Analysis of Alternator Market*
| Driver | % Impact on CAGR Forecast | Geographic Relevance | Impact Timeline |
|---|---|---|---|
| Investment in Grid Infrastructure Across Emerging Markets | +1.2% | Asia-Pacific, Middle East and Africa, Latin America | Medium term (2-4 years) |
| Growing Demand for Engines and Turbines | +0.9% | Global, with a concentration in Asia-Pacific and North America | Long term (≥4 years) |
| Expansion of Industrial Automation and Manufacturing Sector | +1.0% | Asia-Pacific, Europe, North America | Medium term (2-4 years) |
| Surging Demand from Data Centres for Reliable Backup Power | +1.5% | North America, Europe, Asia-Pacific core markets | Short term (≤2 years) |
| Rapid Adoption of High-Voltage 48V Architectures in Hybrid Off-Highway Equipment | +0.4% | North America, Europe, China | Medium term (2-4 years) |
| Integration of Smart Alternators with IoT-Based Predictive Maintenance Platforms | +0.5% | Global, early adoption in North America and Europe | Long term (≥4 years) |
| Source: Mordor Intelligence | |||
Investment in Grid Infrastructure Across Emerging Markets
Governments in Asia, Africa, and Latin America collectively earmarked more than USD 180 billion for transmission and distribution upgrades in 2024, with the Asian Development Bank alone committing USD 35 billion to cross-border interconnections that support the integration of renewable energy sources. These projects utilize synchronous machines to provide inertia as solar and wind penetration exceeds 30% on several regional grids. China’s State Grid deployed ultra-high-voltage corridors that each rely on 500-1,000 MVA synchronous condensers fitted with brushless excitation systems. India mandated alternator-ready synthetic inertia for replacement coal capacity, reinforcing prospects for medium-voltage units across provincial distribution companies. Sub-Saharan African industrial parks added 12 GW of diesel and gas generators in 2024, as weak national grids necessitate islanded microgrids anchored by multi-megawatt alternators. The widespread adoption of vibration and thermal sensors is extending overhaul cycles from 15 to 20 years, thereby improving lifecycle economics for new installations.
Surging Demand from Data Centres for Reliable Backup Power
Global data-center capacity exceeded 12 GW in 2024, and hyperscale operators installed 1.2 GW of backup generation during the year. Diesel and natural-gas alternators rated 2-4 MW per set dominate Tier IV sites where 99.995% availability is standard. Microsoft switched to selective catalytic-reduction gas gensets that cut nitrogen-oxide emissions by 85% without sacrificing uptime.[2] Edge facilities in secondary cities are driving demand for machines with capacities ranging from 500 kW to 1.5 MW, as latency-sensitive workloads proliferate. The Uptime Institute reported that 68% of operators plan to transition to hydrogen or dual-fuel alternators by 2030; however, limited fuel infrastructure confines near-term uptake to pilot projects. Multi-unit N+1 configurations increase unit sales per site by up to 60%, accelerating vendor backlogs.
Expansion of Industrial Automation and Manufacturing Sector
Asia-Pacific manufacturing output grew 5.2% in 2024 as firms installed automation-rich production lines that require stable voltage for robotics and programmable logic controllers.[3] Semiconductor fabs in Vietnam and Indonesia ordered standby alternators rated 250-750 kW to hedge against grid sags that last more than 10 milliseconds. Europe reshored production worth EUR 28 billion (USD 31.6 billion) in 2024, and new industrial clusters are integrating renewable microgrids with backup alternators to comply with the European Union's Energy Efficiency Directive. North American plants faced utility interconnection queues of roughly 48 months, prompting widespread deployment of behind-the-meter natural-gas engines paired with 1-3 MW alternators. Embedding alternator telemetry into manufacturing execution systems optimizes fuel burn and extends maintenance intervals beyond 24,000 operating hours.
Growing Demand for Engines and Turbines
Stationary engine and turbine shipments reached 420 GW in 2024, up 6.8% year over year, with natural-gas peaker plants and combined-cycle facilities accounting for most additions. General Electric sold 22 HA-class gas turbines in the Middle East in 2024, each paired with hydrogen-ready alternators capable of up to 400 MW. Cummins documented a 9% rise in diesel genset orders within the 500 kW to 2 MW band for data centers and hospitals. Siemens Energy recorded double-digit revenue growth in steam turbines for European combined heat and power plants, which lower exposure to volatile grid prices. Hydrogen-capable turbines are forcing alternator makers to redesign stator insulation systems to withstand harmonic distortion created by variable-composition fuels.
Restraints Impact Analysis of Alternator Market*
| Restraint | % Impact on CAGR Forecast | Geographic Relevance | Impact Timeline |
|---|---|---|---|
| Volatile Economy | -0.3% | Global, acute in emerging markets with currency instability | Short term (≤2 years) |
| Fluctuating Prices of Copper and Rare-Earth Materials | -0.8% | Global supply is concentrated in Chile, Peru, and China | Medium term (2-4 years) |
| Competition from Alternative Power Solutions, Such as Battery Storage | -0.6% | North America, Europe, and developed Asia-Pacific markets | Long term (≥4 years) |
| Proliferation of Brushless Permanent-Magnet Generators Reducing Replacement Revenue | -0.4% | Global, faster adoption in Europe and North America | Long term (≥4 years) |
| Source: Mordor Intelligence | |||
Fluctuating Prices of Copper and Rare-Earth Materials
Copper averaged USD 9,200 per metric ton in 2024 and swung within a USD 1,700 band as supply disruptions in Chile and Peru tightened inventory at the London Metal Exchange. Alternator windings consume 180-220 kg of copper per MW, making finished-goods margins acutely sensitive to spot prices. Neodymium-iron-boron magnet costs climbed 22% after China imposed rare-earth export quotas, complicating permanent-magnet generator economics. ABB disclosed that raw-material inflation clipped operating margins by 120 basis points in its electrification segment.[4] Smaller suppliers without hedging programs absorb a 3-5 percentage-point margin squeeze whenever copper trades above USD 10,000 per ton. Substituting aluminum windings raises resistive losses and cooling loads, so widespread material substitution remains limited.
Competition from Alternative Power Solutions Such as Battery Storage
Lithium-ion battery energy storage systems added 42 GWh of capacity worldwide in 2024, with many projects displacing gas-turbine peaker plants in California and Texas. Tesla’s Megapack dropped below a levelized cost of USD 150 per MWh for four-hour duty, undercutting diesel gensets where electricity tariffs exceed USD 0.18 per kWh. Yet lithium-ion cells degrade 40% faster at ambient temperatures above 40 °C, curbing adoption across the Middle East and sub-Saharan Africa, where alternators remain the only cost-effective solution for multi-day backup. Data centers in the Nordics now operate hybrid schemes that rely on batteries for sub-second load transfers and generators for sustained runtime, reducing diesel consumption by 60% while maintaining 99.99% availability. Updates to IEC 62933 safety protocols in 2024 increased BESS capital costs by as much as 12%, marginally narrowing the cost gap with synchronous generation. Combined, these factors limit the restraint’s net drag on the alternator market CAGR to 0.6%.
*Our forecasts treat driver/restraint impacts as directional, not additive. The impact forecasts reflect baseline growth, mix effects, and variable interactions.
Alternator Market Segment Analysis
By Product Type:
Gas Turbines Gain Ground Despite Diesel DominanceDiesel engines accounted for the largest share of the alternator market revenue in 2025, at 44.72%, benefiting from the ubiquity of fuel logistics and their rapid cold-start capability. Gas-turbine models are forecast to post a 6.78% CAGR through 2031, outpacing all other product classes as utilities embrace combined-cycle plants that hit 60% efficiency thresholds. The alternator market share for steam-turbine sets remains niche, tied to biomass and geothermal projects that meet local renewable energy targets. Gas engines, particularly biogas-fired units under 5 MW, are carving space in distributed generation schemes where modular blocks reduce both footprint and permitting complexity. Hydrogen co-firing is accelerating alternator research, forcing OEMs to upgrade insulation and cooling to handle higher voltage stress.
Momentum in the gas-turbine segment also reflects capacity auctions in Saudi Arabia, the United Arab Emirates, and Egypt that awarded 3.6 GW of new turbines in 2024, each bundled with long-term service agreements covering the alternator fleet. Equipment vendors are standardizing brushless excitation packages to minimize maintenance intervals, directly responding to data-center clients that prioritize uptime over first-cost discounts. On the diesel side, emissions regulations, such as the U.S. EPA Tier 4, are nudging buyers toward cleaner fuel blends and selective catalytic reduction kits, adding complexity but not yet shrinking the diesel installed base. Across product categories, the alternator industry continues to shift toward digital twins that simulate winding hot spots during transient grid events, enabling operators to stay within thermal limits.

By Power Range:
Multi-Megawatt Blocks Serve Data-Center RedundancyThe 60-300 kW bracket commanded 30.05% of 2025 shipments, supplying commercial buildings, small factories, and remote telecom sites. At the other end of the spectrum, 5-20 MW machines are growing at the fastest rate of 7.05% annually, as hyperscale data centers standardize on modular 2-3 MW gensets arranged in N+1 or 2N configurations. Alternator market size growth in this tier is further boosted by utility solar-plus-storage projects that require synchronous condensers for black-start capability. In the 1-5 MW range, hospitals and municipal water treatment plants favor multiple units running in parallel for fault tolerance, a strategy that also facilitates smooth maintenance scheduling.
Units above 20 MW serve peaker plants, where rapid ramp rates hedge against renewable variability; however, gas-turbine alternators dominate that niche thanks to favorable heat-rate economics. Sub-60 kW equipment remains viable in residential backup and small enterprise sites but is beginning to cede ground to lithium-ion solutions with four-hour batteries. Suppliers are integrating advanced AVR (automatic voltage regulator) algorithms across all power ranges to comply with IEEE 519 harmonic limits and to qualify for energy-efficiency incentives in Europe and North America.
By Application:
Data Centers Drive Next Wave of InstallationsIndustrial and commercial facilities accounted for 32.18% of the 2025 alternator market revenue, relying on synchronous machines for peak shaving and emergency standby duty. Meanwhile, data centers are projected to expand at a 8.62% CAGR through 2031 as artificial-intelligence inference and edge computing inflate power densities above 20 kW per rack. Alternator market size for data-center backup is rising as operators adopt low-NOx natural-gas gensets to meet tightening ESG metrics. Prime-power applications in off-grid mining and oil extraction continue to drive steady demand for 1-3 MW diesel units that operate over 8,000 hours per year.
Residential backup forms a smaller slice of the alternator market but is resilient in hurricane-prone U.S. Gulf Coast states, where grid outages last days rather than hours. Oil and gas infrastructure, including offshore platforms and pipeline compressor stations, operates machines at load levels ranging from 50% to 100% under harsh temperature gradients, which incentivizes the adoption of brushless permanent-magnet designs that reduce maintenance downtime by half. Across all use cases, vendors are embedding Modbus and Ethernet gateways, enabling asset-health data to be directly fed into enterprise resource planning (ERP) dashboards for unified monitoring.
By Voltage Range:
High-Voltage Adoption Accelerates in Utility-Scale ProjectsMedium-voltage alternators rated 1-4 kV held 65.60% of the 2025 share due to legacy switchgear compatibility across municipal networks. High-voltage machines above 4.16 kV are slated for a 6.42% CAGR, buoyed by offshore wind farms and 11-15 kV data-center architectures that slash transformer count and reduce I²R losses. The alternator market share gains in this tier also stem from relaxed footprint constraints at greenfield sites that can accommodate larger stator frames. Low-voltage (<1 kV) units remain dominant in fast-moving consumer goods factories and construction equipment, where quick field replacement takes precedence over efficiency.
The latest IEC 60034 revision tightened insulation coordination, raising manufacturing cost by up to 6% but lowering partial-discharge failures. ABB’s 15 kV series for 10 MW wind turbines shortens the electrical path to medium-voltage switchgear, improving overall system efficiency by almost 2 percentage points. Utility tenders increasingly demand alternators that meet both IEEE 519 harmonic and NEMA MG 1 efficiency thresholds, driving product convergence across global standards.
By Phase:
Three-Phase Units Remain the Industrial WorkhorseThree-phase machines accounted for 51.88% of 2025 shipments, as balanced loads across phases reduce neutral currents in large motor installations. Single-phase units are growing at a rate of 5.86% annually, driven by residential standby sales and small commercial venues with split-phase distribution. Generac’s residential range experienced double-digit growth in 2024, driven by prolonged outages resulting from climate-driven weather events across the United States.
In off-highway equipment, 48V mild-hybrid systems utilize compact single-phase automotive alternators to recuperate braking energy on excavators and wheel loaders. Valeo shipped 420,000 such 48 V belt-starter-generators in 2024, underscoring a new adjacent growth pocket for the alternator industry. Three-phase units continue to dominate mission-critical sites such as data centers, refineries, and pharmaceutical plants, where unbalanced loads could trigger protective relay trips.
Geography Analysis
APAC Alternator Market
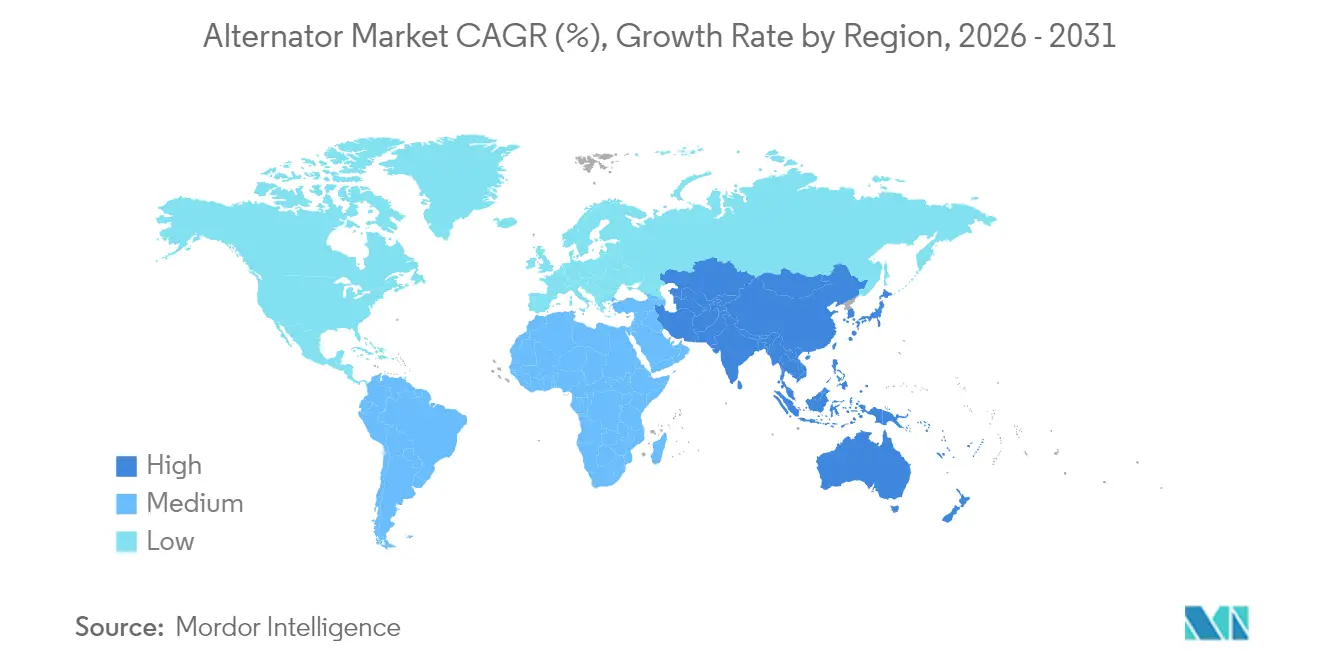
Asia-Pacific contributed 41.05% of global alternator revenue in 2025 and is projected to expand at a 6.48% CAGR through 2031, fueled by China’s USD 52 billion investment in ultra-high-voltage corridors and India’s 50 GW solar-plus-storage tenders that mandate synchronous backup capacity. Southeast Asian nations such as Vietnam and Indonesia added 8 GW of thermal generation in 2024 to anchor manufacturing zones, while Japan and South Korea opted for liquefied-natural-gas combined-cycle stations that incorporate fast-ramping alternators for frequency regulation.
North America Alternator Market
North America accounted for approximately 27.95% of the 2025 market value, supported by 12 GW of new gas-fired capacity that came online in Texas, California, and the Southeast. Canada’s CAD 2.8 billion (USD 2.1 billion) investment in cogeneration kept steam-turbine alternator demand intact, whereas Mexico added 1.2 GW of standby units in border industrial parks to support near-shoring trends.
EMEA and South America Alternator Market
Europe maintained modest growth as coal retirements prompted the European Network of Transmission System Operators for Electricity to require synchronous inertia from any new generation above 10 MW. South America, the Middle East, and Africa together represent a mounting opportunity pool: Brazil approved 4.5 GW of distributed generation in 2024, Saudi Arabia allocated USD 18 billion for gas-turbine projects under Vision 2030, and Nigeria and South Africa installed 2.8 GW of diesel and gas gensets to stabilize telecom towers and mining sites.
Regulatory Landscape
Global alternator demand is shaped by a mix of product standards, emissions rules for engine-driven gensets, and trade policy affecting alternator-containing automotive supply chains. In July 2026, SAE published J3226_202607, updating voltage regulation limits for automotive alternators, which reinforces the need for OEMs and tier suppliers to validate output characteristics against evolving vehicle electrical architectures.
In China, the Ministry of Industry and Information Technology standard JB/T 15000-2025 for diesel-engine alternators came into effect in October 2025, creating a formal compliance checkpoint for domestic and imported equipment supplied into industrial and standby-generation applications. On the trade side, the United States maintained Section 232 administration for covered automobile parts, and the Department of Commerce opened an inclusion window from April 1 to April 14, 2026, increasing tariff-risk variability for alternator-related components and assemblies moving through North American supply chains.
Value Chain Analysis
The alternator value chain starts with upstream metals and magnetic materials, including copper for windings and steel for laminations, and rare-earth inputs where permanent-magnet designs are used. It then moves through component manufacturing for rotors, stators, bearings, regulators/AVR, and power electronics, followed by assembly and testing, including insulation and partial-discharge checks for higher-voltage machines. Downstream, OEM channels distribute alternators through genset, engine, turbine, and vehicle manufacturers, while service, remanufacturing, and parts (bearings, rectifiers, regulators, excitation components) create a parallel aftermarket loop.
Recent supply-chain events point to upstream fragility for magnet-related inputs: in April 2025, new export license requirements in China were associated with a sharp month-over-month reduction in magnet exports, and by June 2025 industry reporting cited production disruptions across automotive supply chains, including stoppages at OEM plants and alerts from European automotive suppliers. These constraints are pushing deeper-tier sourcing scrutiny, inventory building for critical subcomponents, and greater design attention to material choices and sourcing optionality, particularly for permanent-magnet architectures where rare-earth availability can become a bottleneck.
Competitive Landscape
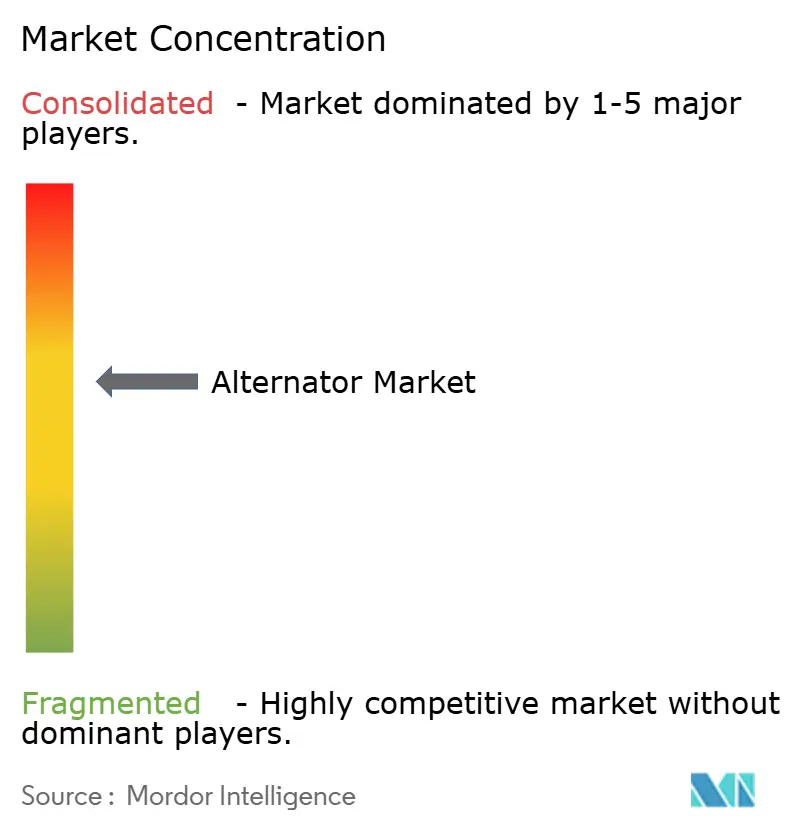
The alternator market remains moderately fragmented, with the top five suppliers, ABB, Siemens, Cummins, Caterpillar, and General Electric, holding a significant share in 2024. OEMs are embedding edge analytics, as well as sensors for vibration, temperature, and partial discharge, directly into alternator housings, which feed cloud dashboards that predict bearing faults four to six weeks before failure and reduce downtime by more than 20% in pilot programs.
Chinese entrants, such as Broad-Ocean Motor and WEG Indústria, captured 18% of the Asia-Pacific volume by pricing 25-35% below Western vendors, while still meeting the IEC 60034 efficiency criteria. Brushless permanent-magnet technology is eroding wound-rotor replacement sales, as Caterpillar reported that permanent-magnet alternators comprised 22% of its genset shipments in 2024, up from 14% two years prior.
White-space growth continues in off-highway equipment, where 48 V alternators rated 3-10 kW deliver regenerative braking for excavators and tractors without overstressing existing engine control units. Suppliers are also courting marine and rail traction customers that seek high‐reliability brushless designs capable of 8,000-hour service intervals. Ongoing consolidation is expected in mid-tier segments as raw-material volatility pressures sub-scale producers that lack commodity hedging desks.
Alternator Industry Leaders
-
ABB Ltd.
-
Siemens AG
-
Cummins Inc.
-
Leroy Somer (Nidec Motor Corporation)
-
Mecc Alte Spa
- *Disclaimer: Major Players sorted in no particular order
Alternator Market Companies Covered in this Report
- ABB Ltd.
- Leroy-Somer (Nidec Motor Corporation)
- Cummins Inc.
- Siemens AG
- Mecc Alte SpA
- Marathon Electric (Regal Rexnord Corporation)
- General Electric Power Conversion
- Generac Power Systems Inc.
- WEG Indústria e Comércio S.A.
- Jeumont Electric
- Indar (Ingeteam Corporación S.A.)
- Denyo Co. Ltd.
- T D Power Systems Limited
- Kohler Co.
- DENSO Corporation
- Valeo S.A.
- Robert Bosch GmbH
- Caterpillar Inc.
- Broad-Ocean Motor Co. Ltd.
- Brush Electrical Machines Ltd.
- Rolls-Royce Power Systems AG
- Controlled Power Technologies (SEG Automotive Germany GmbH)
- Meidensha Corporation
- Fuji Electric Co. Ltd.
- Andritz AG
Market Opportunities and Future Outlook
Localized manufacturing and supply assurance remain a visible white-space for alternators and adjacent components in regions prioritizing domestic vehicle and equipment production. In May 2026, NPK Avtopribor Iskra launched mass production of automobile alternators for LADA models in Tolyatti, Russia, with stated capacity up to 700,000 units per year, illustrating how localization strategies can translate into new supplier footprints and volume ramps where import substitution and supply security are emphasized.
The aftermarket also offers a practical expansion lane tied to fleet aging and OE-equivalent replacement demand, especially in Europe where breadth of coverage and cross-reference depth drive share capture. In February 2026, DENSO expanded its alternator aftermarket range by adding 51 new part numbers linked to 340 OE part numbers and covering about 3,300 vehicle applications, highlighting how catalog expansion and application coverage can open incremental revenue pools for suppliers, even as some standby segments assess batteries for shorter-duration backup.
Recent Industry Developments in Alternator Market
- June 2026: Cummins Power Generation expanded its high-horsepower Centum offering around the QSK78 platform for 50 Hz markets, targeting high-power applications that prioritize reliability and standardized integration. The move strengthens Cummins positioning in mission-critical installations where large engine-alternator packages are specified as repeatable building blocks.
- June 2025: Cummins announced a new 17-liter engine for power generation aimed at higher power density in compact footprints. The product direction supports tighter space constraints in commercial and industrial sites and raises competitive pressure on packaged genset suppliers that differentiate on kW per square meter and serviceability.
- March 2024: Mecc Alte completed the acquisition of SICES controllers business, adding controller capabilities alongside its alternator portfolio. This broadened the companys ability to deliver more integrated generator-set subsystems where controls, monitoring, and power quality functions are procured together.
Alternator Market Report Scope and Research Methodology
Market Definition and Coverage
For this study, the alternator market is measured as revenues earned from alternator units sold for power generation sets and related stationary uses, counted at the manufacturer level and mapped to where the equipment is finally used.
Scope exclusions: Rewound or refurbished units sold as services, pure spare parts sold without a full alternator, and internal transfer pricing within a group are excluded where they cannot be reliably separated.
Segments Covered in This Report
-
By Product Type
- Gas Engine
- Diesel Engine
- Gas Turbine
- Steam Turbine
-
By Power Range
- 1 kW-60 kW
- 60 kW-300 kW
- 300 kW-1 MW
- 1 MW-5 MW
- 5 MW-20 MW
- 20 MW-40 MW
-
By Application
- Oil and Gas
- Prime Power
- Data Centres
- Residential
- Industrial and Commercial
- Other Applications
-
By Voltage Range
- Low Voltage (≤1 kV)
- Medium Voltage (1.001-4.160 kV)
- High Voltage (>4.160 kV)
-
By Phase
- Single-Phase Alternators
- Three-Phase Alternators
-
By Geography
-
North America
- United States
- Canada
- Mexico
-
South America
- Brazil
- Argentina
- Rest of South America
-
Europe
- Germany
- United Kingdom
- France
- Italy
- Spain
- Russia
- Rest of Europe
-
Asia-Pacific
- China
- Japan
- India
- South Korea
- South-East Asia
- Rest of Asia-Pacific
-
Middle East and Africa
-
Middle East
- Saudi Arabia
- United Arab Emirates
- Turkey
- Rest of Middle East
-
Africa
- South Africa
- Nigeria
- Rest of Africa
-
Middle East
-
North America
Data Sources, Market Sizing, and Validation
Desk Research
Desk research starts with public series that help us shape the demand pool and check supply-side limits. We refer to sources such as U.S. Energy Information Administration (electricity generation and fuel mix), International Energy Agency datasets (power capacity and additions), World Bank indicators (industrial output proxies), UN Comtrade trade statistics (generator and electrical machinery flows), and statistics portals run by large regional governments (energy, manufacturing, and infrastructure releases).
To translate these signals into alternator value drivers, we also review company annual reports, investor presentations, product catalogs, and press releases that discuss generator sets, capacity ranges, and pricing movements. Where needed, our internal paid subscriptions for company financials, news and financials, patent databases, and shipment-level import/export records are used to validate directional trends and fill gaps across countries. These are illustrative examples only, and many other public sources were also used for data collection, cross-checking, and clarification.
Primary Interviews and Surveys
Primary work is used to pressure-test what desk research cannot show clearly, such as average selling price ranges by kW class, replacement versus new-build demand splits, and typical alternator content per genset across applications. We speak with manufacturers, component suppliers, distributors, EPC and maintenance participants, and large end users, covering APAC, EMEA, and the Americas so regional differences in grid reliability, data center buildouts, and industrial usage are represented in the final model.
Distribution of primary research fieldwork respondents
| Company type | Respondent position | Region |
|---|---|---|
| Top tier: 28% | CXOs: 16% | APAC: 48% |
| Mid tier: 50% | Functional/Unit leaders: 25% | EMEA: 29% |
| Smaller Players: 22% | Managers: 59% | Americas: 23% |
Market-Sizing & Forecasting
Sizing is built using a top-down approach where installed and added power capacity, genset deployment patterns, and trade and production signals are reconstructed into alternator demand, and then converted into value using realistic price bands. The model is then checked with selective bottom-up approximations, such as sampled supplier roll-ups, distributor channel checks, and an ASP multiplied by unit volumes for a few high-activity countries, which helps adjust totals when a time series looks off.
Key inputs that shape the numbers include power output mix (1-60 kW through higher MW classes), application split (oil and gas, prime power, data centers, residential, and industrial and commercial), phase and voltage preferences, and regional differences in infrastructure spending and backup power needs. For forecasting, we rely mainly on scenario analysis tied to power capacity additions, data center construction momentum, and industrial activity outlooks, and then we tune the pace with what primary respondents expect for pricing and lead times. If bottom-up visibility is weaker in a country, assumptions are bridged from similar markets using import dependency, installed base proxies, and conservative ASP ranges.
Data Validation & Update Cycle
Validation is done by comparing market totals against independent signals, such as regional generator set shipment direction, major project tender activity, and trade movement trends, and then checking whether implied prices stay within realistic bands. Large variances trigger a second pass on the input series, followed by re-contact with selected interviewees when a change is driven by an unclear factor like sudden pricing shifts or a demand surge in one application.
Before sign-off, the model goes through step-by-step analyst reviews, with country and segment totals reconciled back to the global view so the arithmetic and logic are consistent. Reports are refreshed annually, and interim updates are made when material events occur, such as major regulation changes, supply disruptions, or step changes in capacity additions. Right before delivery, a fresh review is completed so clients receive the latest updated view.
Mordor Intelligence's Alternator Market Size Compared With Other Published Estimates
It is normal to see different published market sizes for alternators, even when the topic name looks identical. Most gaps come from what is counted as an alternator sale, how automotive-related alternators are treated, which applications are included, and what year is used as the anchor for currency conversion.
In addition, some sources report a broader electrical alternator universe across end uses, while others stay closer to generator-set driven demand and then build forecasts using different price progression assumptions. When a study uses a longer forecast window, the growth path can also look larger because it blends in a stronger expansion period, and some estimates are refreshed at different times so they reflect different input months for trade and capacity datasets.
Benchmark comparison
| Source | Market Size | Gaps in Research Methodology |
|---|---|---|
| Mordor Intelligence | USD 19.46 B (2026) | |
| Trade Publisher A | USD 21.80 B (2024) | Uses a wider end-use scope that explicitly includes automotive and construction, and it anchors the series in 2024 with a 2030 horizon, which shifts the level when compared with a 2026 base and different application weighting. |
| Industry Platform B | USD 22.37 B (2024) | Starts from a 2024 base and extends to 2035, and its regional narrative implies different dominance and growth assumptions by region, which can lift the total if replacement demand and price escalation are applied more aggressively. |
The spread in the table mostly comes from scope and timing choices, rather than simple math differences. By keeping the value build tied to power output mix, stationary application demand, and a 2026 anchor year, the alternator total is kept consistent with the report scope used by Mordor Intelligence.
Key Questions Answered in the Report
How large is the alternator market in 2026, and how fast is it growing?
The alternator market size reached USD 19.46 billion in 2026 and is set to climb to USD 25.09 billion by 2031 at a 5.22% CAGR.
Which alternator product category is growing fastest through 2031?
Gas-turbine alternators lead growth with a projected 6.78% CAGR as utilities pivot to combined-cycle and hydrogen-ready plants.
Why are data centers boosting alternator demand?
Hyperscale and edge data centers require Tier IV backup power, driving a 8.62% CAGR in alternator shipments to maintain 99.995% uptime.
What geographic region offers the highest growth opportunity?
Asia-Pacific commands the largest revenue share and is slated for the fastest regional CAGR of 6.48% through 2031 due to grid upgrades and manufacturing expansion.
How are rising copper prices affecting alternator suppliers?
Copper price volatility trimmed OEM margins by up to 120 basis points in 2024, pushing some vendors toward aluminum windings and more aggressive hedging strategies.
Are batteries a credible long-term substitute for alternators?
Batteries are cost-competitive for four-hour backup, yet alternators retain an advantage for multi-day runtime, high ambient temperatures, and hydrogen fuel flexibility.