
Alternative Financing Market Size and Share
Market Overview
| Study Period | 2020 - 2031 |
|---|---|
| Market Size (2026) | USD 1.42 Trillion |
| Market Size (2031) | USD 2.27 Trillion |
| Growth Rate (2026 - 2031) | 9.84% CAGR |
| Fastest Growing Market | Asia Pacific |
| Largest Market | North America |
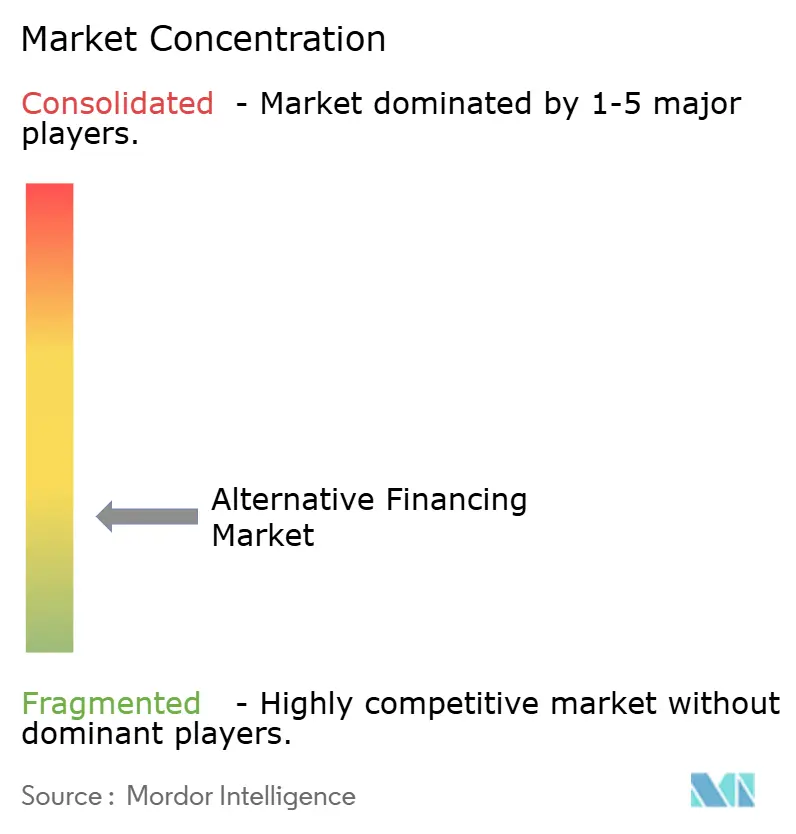
| Market Concentration | Low |
Major Players *Disclaimer: Major Players sorted in no particular order Image © Mordor Intelligence. Reuse requires attribution under CC BY 4.0. | |
Alternative Financing Market Analysis by Mordor Intelligence
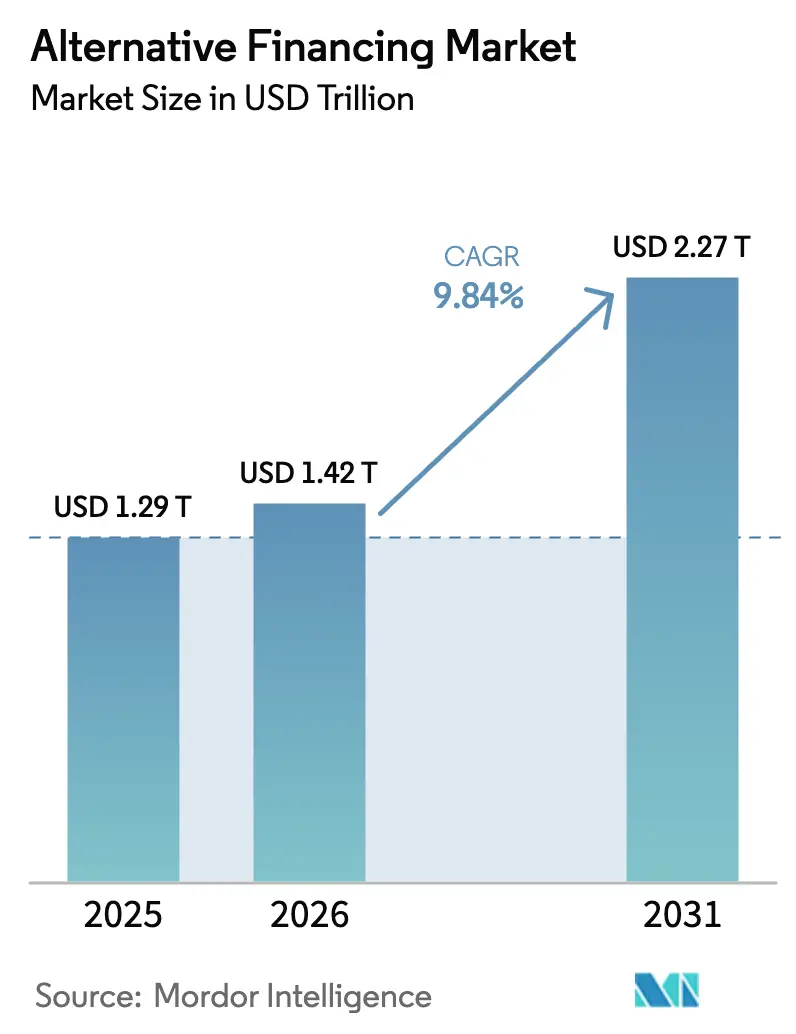
The Alternative Financing Market size was valued at USD 1.29 trillion in 2025 and estimated to grow from USD 1.42 trillion in 2026 to reach USD 2.27 trillion by 2031, at a CAGR of 9.84% during the forecast period (2026-2031).
Rapid growth stems from borrowers and investors bypassing traditional banks, whose Basel III and Basel IV capital rules have elevated the cost of holding certain loans, creating a sizeable funding gap that non-bank lenders now fill. Open-banking legislation—most notably the United States Consumer Financial Protection Bureau’s (CFPB) Section 1033 rule—has standardised data portability, letting fintech platforms underwrite risk with richer real-time insights and reach underserved segments. Parallel innovations in securitisation have unlocked institutional capital: marketplace-loan asset-backed securities (ABS) issuance has doubled since the global financial crisis to roughly USD 330 billion, giving platforms efficient balance-sheet rotation and attractive yield products for investors [1]RBC Capital Markets, “Marketplace Lending and ABS Outlook 2025,” rbccm.com .
Key Report Takeaways
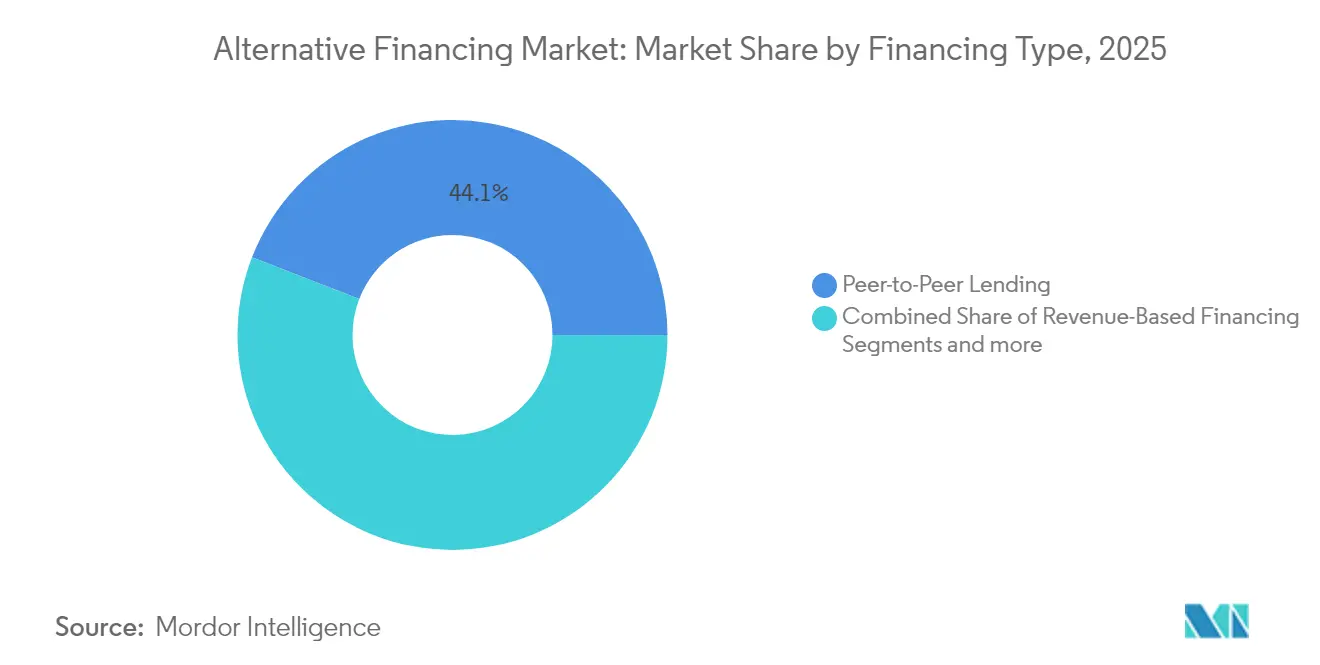
- By financing type, peer-to-peer lending led with 44.12% of the alternative financing market share in 2025, while revenue-based financing is projected to expand at a 27.26% CAGR to 2031.
- By end user, small and medium enterprises held 55.12% share of the alternative financing market size in 2025; individual consumers are forecast to grow at a 21.25% CAGR through 2031.
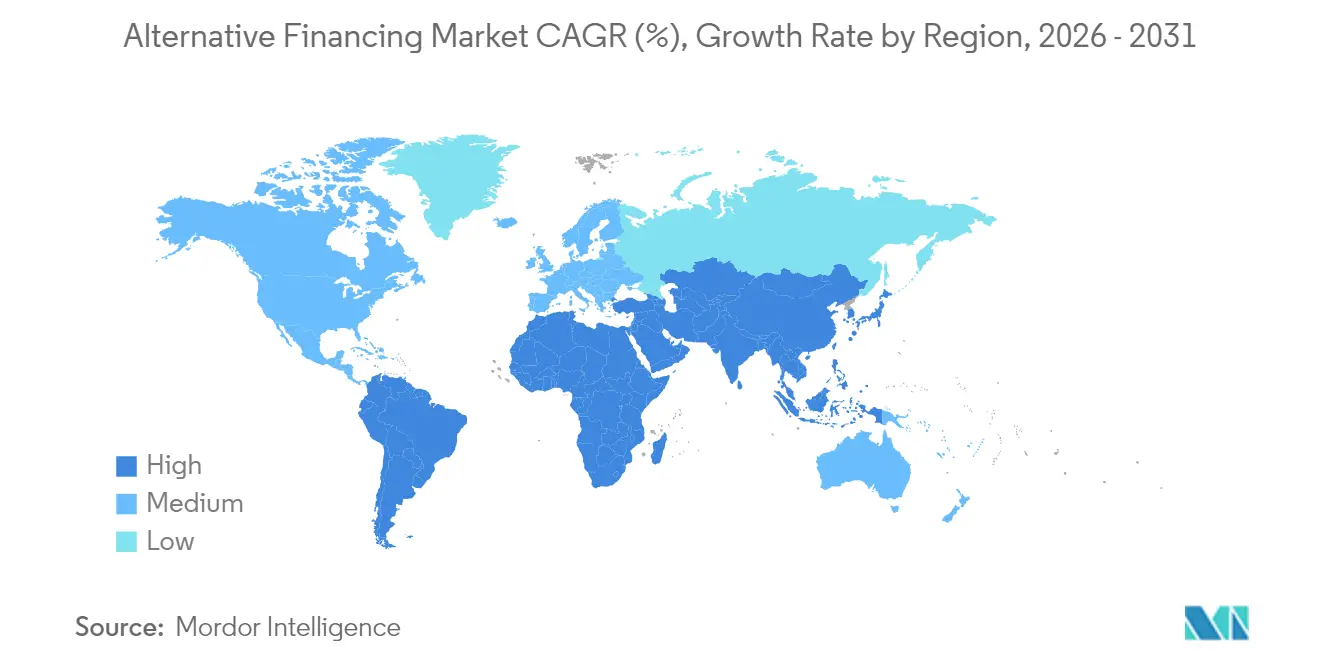
- By geography, North America commanded 34.20% of revenue of the alternative financing market in 2025; Asia-Pacific is advancing at a 14.23% CAGR between 2026 and 2031.
Note: Market size and forecast figures in this report are generated using Mordor Intelligence’s proprietary estimation framework, updated with the latest available data and insights as of 2026.
Global Alternative Financing Market Trends and Insights
Drivers Impact Analysis*
| Driver | (~) % Impact on CAGR Forecast | Geographic Relevance | Impact Timeline |
|---|---|---|---|
| Digital-first SME credit-gap expansion | +2.5% | Global, emphasis on APAC and Europe | Medium term (2–4 years) |
| Retail-investor ‘search-for-yield’ momentum | +1.6% | North America, core EU markets | Short term (≤ 2 years) |
| Open-banking legislation & JOBS Act provisions | +1.2% | North America and EU; spillover to APAC | Long term (≥ 4 years) |
| Institutional securitisation of marketplace debt | +1.80% | Global, led by North America | Medium term (2–4 years) |
| Real-world-asset tokenisation | +0.90% | Global, early adoption in developed economies | Long term (≥ 4 years) |
| Bank capital-rule tightening | +2.0% | Global, strongest in EU and North America | Short term (≤ 2 years) |
| Source: Mordor Intelligence | |||
Digital-first SME credit-gap expansion
SMEs constitute 99% of enterprises across OECD economies. However, they face a significant global financing gap, which traditional banks struggle to bridge due to restrictive collateral requirements and the high costs associated with manual onboarding processes. Fintech lenders use cloud-based loan-management systems and AI scoring to automate most of the applications, shrinking approval times to minutes while lowering the marginal cost per dollar originated. Embedded-finance providers integrate lending directly into accounting, e-commerce, and payroll platforms, creating a continuous data loop that enhances credit visibility and customer stickiness. Digital origination also allows lenders to syndicate exposures rapidly through marketplace ABS or whole-loan sales, turning working-capital loans into tradable assets that satisfy yield-hungry institutions. Collectively, these forces enlarge the addressable borrower base and raise platform throughput, contributing a forecast +2.8% uplift to the overall CAGR.
Retail-investor ‘search-for-yield’ momentum
After successive years of low policy rates, retail and accredited investors migrated toward higher-yielding private-credit instruments, fuelling a global private-credit asset pool of USD 1.7 trillion in 2025. Equity and reward-based crowdfunding campaigns have reported double-digit net returns, validating retail demand for direct exposure to entrepreneurial ventures. Platforms package short-duration consumer receivables into regulated notes, providing predictable amortization schedules that rival investment-grade bonds yet generate superior spreads. Institutional allocators mirror that behavior, purchasing marketplace-loan ABS and collateralized fund obligations, enlarging secondary-market liquidity that further attracts yield seekers. Momentum is expected to add almost two percentage points to the sector’s CAGR through 2027.
Open-banking legislation & JOBS Act provisions
The CFPB’s final Section 1033 rule mandates that US banks holding over USD 850 million in assets must furnish consumer-authorised data to third parties by April 2026, breaking long-standing information asymmetries [2]CFPB, “Personal Financial Data Rights Rule,” consumerfinance.gov . Similar directives are underway in Singapore and Australia, extending global coverage. Democratized access to cash flow and account-history data enhances underwriting precision for thin-file borrowers and reduces fraud. Retail investment caps under the US JOBS Act have been lifted in line with income thresholds, widening the investor base for Regulation Crowdfunding offerings, which reached USD 623 million in 2024 issuances. These combined measures create long-run catalysts for platform volume and product innovation.
Institutional securitization of marketplace loans
Collateralised loan obligations and marketplace-loan ABS topped USD 250 billion in 2024, reflecting mainstream investor appetite for consumer and SME receivables packaged with credit-enhancement triggers [3]SIFMA, “US Securitised Products 2024 Review,” sifma.org . Marketplace originators employ warehouse credit lines from regional banks and asset managers to aggregate loans ahead of term securitization, freeing capital for continued origination. Rating-agency acceptance—LendingClub’s 2024 shelf-secured investment-grade tranches—draws pension and insurance allocations seeking floating-rate exposure. Advances in blockchain ledgers reduce reporting lags, allowing real-time collateral verification and lowering structuring costs. Collectively, scalable securitization channels are forecast to inject +2.1% to the five-year CAGR.
Restraints Impact Analysis*
| Restraint | (~) % Impact on CAGR Forecast | Geographic Relevance | Impact Timeline |
|---|---|---|---|
| Patch-work global regulatory regimes & licensing caps | −1.8% | Global; most acute in EU multi-state and emerging markets | Long term (≥ 4 years) |
| Rising default and fraud risk in macro slowdown | −2.1% | Global; heightened in unsecured consumer lending | Short term (≤ 2 years) |
| Higher cost of capital versus deposit-funded banks | −1.4% | Global; affects non-bank lenders lacking cheap deposits | Medium term (2–4 years) |
| Liquidity squeezes in ABS warehouses for non-bank lenders | −1.2% | North America and EU core ABS markets | Short term (≤ 2 years) |
| Source: Mordor Intelligence | |||
Patch-work global regulatory regimes & licensing caps
Country-specific lending licenses, state-by-state disclosure laws, and diverging Basel IV adoption timelines increase compliance budgets, especially for cross-border scale-ups. In the U.S., more than half the states now require APR-style cost disclosures for commercial loans, creating customized workflows that smaller platforms find difficult to handle. The European Banking Authority’s guidelines on significant risk transfer add deal-by-deal approval layers for banks purchasing fintech-originated portfolios, delaying funding cycles. Meanwhile, money transmission statutes in emerging markets often oblige local entity formation and minimum capital deposits, slowing geographic rollouts. Lack of regulatory harmonization is projected to shave 1.8 percentage points off headline growth over the decade.
Rising default and fraud risk amid economic slowdown
High-profile collapses such as Greensill Capital exposed vulnerabilities in supply-chain-finance verification, prompting investors to tighten due diligence filters. Consumer-loan net charge-offs ticked up through 2024 as inflation squeezed discretionary income, and buy-now-pay-later operators now fall under renewed CFPB supervision akin to card issuers. Fraud rings exploit digital onboarding by deploying synthetic identities; industry data show a 35% year-over-year increase in suspected synthetic-ID loan applications in Q1 2025 [4]TransUnion, “2025 Consumer Credit Forecast,” transunion.com . Platforms respond by integrating behavioural biometrics and device-graph analytics, but model efficacy remains untested through a full recession. These pressures subtract roughly 2.1 percentage points from projected growth until macro conditions stabilise.
*Our forecasts treat driver/restraint impacts as directional, not additive. The impact forecasts reflect baseline growth, mix effects, and variable interactions.
Segment Analysis
By Financing Type: Revenue-based Models Reshape Capital Access
Revenue-based finance, though holding a modest slice of 2025 originations, is outpacing every peer class with a 27.26% CAGR as sellers of software-as-a-service and consumer brands prefer repayment linked to monthly sales rather than fixed amortisation schedules. The movement gained credibility when venture firm General Catalyst allocated recurring capital to underwrite up to 80% of clients’ marketing budgets, signalling institutional acceptance. Peer-to-peer lending still commands the largest 44.12% slice of overall volumes in 2025, but the category has morphed into institutionally funded marketplace origination; LendingClub alone handled USD 2 billion in Q1 2025 loans, most purchased by asset managers seeking seasoned consumer credit. Securitisation now allows P2P platforms to recycle capital within 45 days, maintaining shares even as newer models arise.
Operational efficiency differentiates segments: AI-powered decision-making at Upstart automates 92% of personal-loan approvals. Buy-now-pay-later volumes continue to surge; Affirm’s latest USD 4 billion warehouse expands its lending headroom to underwrite more than USD 20 billion in three years, evidencing deep private-credit liquidity. Invoice-finance and supply-chain-finance platforms incorporate blockchain for immutable audit trails, shortening pay-out cycles from weeks to days and cutting fraud. Merchant cash-advance providers, on the other hand, face stricter state-level caps after allegations of confessions-of-judgment abuse, nudging the segment toward transparent, revenue-share repayment terms. Environmental, social and governance (ESG) filters increasingly influence product design, with lenders offering rate discounts for certified sustainable-practice borrowers, adding a qualitative layer to credit scoring.


By End User: SME Dominance Meets Consumer Innovation
SMEs captured 55.12% of 2025 originations, mirroring their under-representation in traditional bank portfolios and the pressing need for working capital to support supply-chain resilience and e-commerce expansion. Alternative lenders harvest live invoicing, point-of-sale and logistics data to score applicants previously deemed ‘thin-file,’ reducing rejection rates and boosting lifetime customer value. Driven by ongoing Basel capital incentives that discourage banks from engaging in this segment, the alternative financing market share for SMEs is anticipated to remain strong through 2031. Individual consumers, however, exhibit the steepest growth path at 21.25% CAGR, thanks to AI vehicle-finance algorithms that cover 90% of US car buyers and BNPL adoption amongst Gen Z cohorts who favour interest-free instalments. ESG-linked social-impact funds have doubled Asia-Pacific social-bond issuance over three years, signalling investor appetite for products that lend to micro-entrepreneurs and rural borrowers.
At the enterprise end of the spectrum, large corporates employ alternative financing tactically—often through receivables securitisation—to optimise working-capital cycles without breaching covenant headroom. Non-profit organisations leverage mission-driven crowdfunding portals for community infrastructure projects, aligning donor intent with transparent on-chain reporting. Lenders across user categories are integrating sustainability dashboards; platforms now allow borrowers to visualise carbon-emission intensity relative to financing costs, promoting behavioural shifts. Lastly, embedded-finance APIs stitched into accounting and ERP suites have lowered onboarding friction for micro-enterprises, contributing to double-digit month-over-month client adds at several regional providers and reinforcing SME dominance.
Geography Analysis
North America’s 34.20% revenue in 2025 stems from a confluence of open-data regulation and deep securitisation liquidity. Federal pre-emption of certain state usury limits has fostered a uniform national market for high-yield instalment loans, though new commercial-finance disclosure statutes in states like California and Missouri create compliance overhead for smaller platforms. Canada’s federal retail-payment supervision framework, coming into force in 2026, will extend licence obligations to non-bank PSPs, nudging cross-border platforms to unify risk controls. Mexico’s fintech law continues to attract payments and lending start-ups seeking a regulated foothold in Latin America’s second-largest economy, further enlarging the region’s footprint.
Asia-Pacific is the fastest-growing block at 14.23% CAGR between 2026 and 2031, driven by an explosion in digital-payment volume and government-backed open-banking agendas. Fintech revenue is projected to rise from USD 245 billion in 2021 to USD 1.5 trillion by 2030, with India and Indonesia delivering the largest incremental volumes. Singapore’s MAS Payment Services Act offers passportable e-money licences, simplifying multi-market expansion for regional lenders. Mainland China’s Ant Group has split into independent units to align with domestic prudential requirements while using Alipay+ to export technology—connecting 1.5 billion consumer wallets to 88 million merchants across 57 countries—thereby funnelling cross-border lending flows. Developed Asia (Australia, New Zealand, Japan) is seeing private-credit funds fill middle-market funding gaps left by bank retrenchment, with Australia hosting USD 60 billion in committed private-credit dry powder by end-2024.
Europe offers a balanced opportunity, underpinned by PSD3, the instant-payment directive and the European Banking Authority’s push for significant risk-transfer securitisations that allow banks to share loan risk with institutional investors. The UK’s Consumer Credit Act overhaul aims to streamline rules for small-sum instalment plans, potentially accelerating BNPL penetration. Continental players face licence ‘passporting’ uncertainty post-Brexit, causing some platforms to establish parallel entities in Dublin and Amsterdam to retain EU access. In the Middle East and Africa, UAE and Saudi Arabia free-zone regulators now grant digital-bank charters within 90 days, spurring cross-border expansion among payments-first lenders. Latin America remains venture-capital heavy: fintechs received over 40% of regional VC dollars despite a 2024 downturn, with embedded-credit adoption in Brazil and Colombia offsetting funding-cycle volatility.

Regulatory Landscape
Alternative financing operates across overlapping banking, securities, payments, and consumer-credit perimeters, which leaves platforms managing a patchwork of licensing and disclosure requirements. In the United States, marketplace and P2P models are commonly subject to SEC oversight when investor-facing notes are treated as securities, while underlying credit origination and servicing continue to be shaped by state lending and brokerage rules. In parallel, the CFPB final Section 1033 rule standardizes consumer-authorized data access, with phased compliance beginning in April 2026 for covered institutions, particularly banks above the stated asset threshold in the rule. Together, these rules support broader data portability for underwriting, but compliance remains multi-layered across federal and state regimes.
In Europe, the European Crowdfunding Service Providers Regulation (ECSPR), effective since November 2021, creates a single authorization path for crowdfunding and certain P2P activity to operate cross-border within the EU, with an offer cap of EUR 5 million per project over 12 months. In the United Kingdom, loan-based crowdfunding continues under the Financial Conduct Authority (FCA) authorization framework, with conduct and reporting requirements and limited investor protection features such as no automatic FSCS coverage for typical platform activity. In India, the Reserve Bank of India has issued Non-Banking Financial Companies, Peer to Peer Lending Platform Directions (2025), formalizing registration and operating requirements for NBFC-P2P entities while tightening governance and reporting expectations for digital lending intermediaries.
Value Chain Analysis
The alternative financing value chain begins with borrower acquisition and data capture, often using open-banking and embedded-finance integrations, followed by automated underwriting, pricing, and decisioning for platform-led credit models. Funding then comes from a mix of retail participation for certain crowdfunding and platform note structures, and increasingly from institutional channels such as forward-flow agreements, warehouse lines, and securitization takeouts. After origination, loan servicing, collections, and customer support form the operating layer that protects portfolio performance and investor outcomes.
Specialist enablers have become key nodes across the chain. These include KYC/AML and fraud vendors, payments processors and money-movement partners, and legal and compliance advisors that help platforms navigate country-by-country licensing and disclosure requirements. Capital-markets infrastructure is another backbone, where arrangers, rating agencies, trustees, and custodians support marketplace-loan ABS and related structures used for balance-sheet rotation and funding cost management. Regulatory sandboxes and innovation hubs associated with the UK FCA also influence the chain by shaping how new products are tested, documented, and monitored before scale-up, which pushes platforms toward stronger governance, reporting, and operational controls.
Competitive Landscape
The alternative financing market exhibits a fragmented structure, with the top five players holding a relatively small share of total revenue. This low concentration level fosters opportunities for innovation in both product offerings and geographic expansion. Scale advantages manifest through capital markets access: LendingClub reduces funding costs by securitizing consumer loans through investment-grade shelves, offering a cost advantage over whole-loan sales. Concurrently, Upstart utilizes AI-driven automation to efficiently sustain a low loan-processing expense ratio. Banks seek equity stakes or outright take-overs of technology-rich platforms—US regional banks have acquired minority positions in BNPL providers to capture millennial deposit flows—and fintechs, in turn, apply for limited-purpose bank charters to secure cheaper Federal Home Loan Bank advances. Block-chain RWA tokenisation is reshaping competitive dynamics; early adopters such as Figure Technologies originate and settle mortgage-backed securities entirely on distributed ledgers, accelerating post-closing funding and providing investors with immutable audit trails.
White-space opportunities abound in cross-border SME payables and healthcare supply-chain finance. Ant International reports that AI-enabled merchant-acquiring services tripled payment throughput in 2024, while cross-border settlement times fell to under one hour for many corridors. Sustainable-infrastructure finance is gaining traction; platforms partner with solar panel OEMs to deliver point-of-sale loans that match equipment lifecycle to repayment tenor, attracting green-bond buyers. Regulatory technology (RegTech) vendors capitalise on compliance fragmentation by offering plug-and-play licence management, increasingly bundled with KYC orchestration engines. Marketing rules have also evolved; the US Financial Industry Regulatory Authority (FINRA) now permits forward-looking performance projections in institutional materials under Rule 2210, letting marketplace lenders provide more granular loss-curve disclosures to professional investors.
Alternative Financing Industry Leaders
LendingClub
Funding Circle
GoFundMe
Kickstarter
Indiegogo
- *Disclaimer: Major Players sorted in no particular order

Market Opportunities and Future Outlook
A near-term opportunity is scaling institutional funding partnerships that turn digital originations into repeatable, off-balance-sheet liquidity through forward-flow and related structures. Funding Circle provides current evidence for this pathway, reporting GBP 900 million of new forward-flow agreements signed in H1 2026, alongside GBP 1.05 billion of SME term loan originations, and growth in assets under management to GBP 3.0 billion. The figures indicate that institutional capital is being structured to support platform throughput and product breadth, including card and pay-later-like propositions such as FlexiPay, and they also create room for platforms that can combine credit performance with capital-markets-ready reporting, especially in SME working capital where bank retrenchment and compliance costs remain a persistent factor.
Embedded finance and vertical-specific lending also present an actionable whitespace, particularly when platforms can price risk using richer cash-flow data and point-of-sale signals. LendingClub started underwriting and originating home improvement loans through a partnership with Wisetack in April 2026, which shows how alternative lenders use partner channels to move into adjacent consumer-credit categories beyond direct acquisition. As open-banking regimes expand and data portability becomes more standardized, platforms with integrated consented-data pipelines, stronger fraud controls, and standardized disclosures can differentiate on speed, personalization, and portfolio monitoring across geographies where regulatory conditions still vary materially.
Recent Industry Developments
- June 2026: Funding Circle Holdings plc renewed a 200 million pound forward flow agreement with Deutsche Bank to support UK small business lending. The arrangement reinforces the UK SME lending pipeline and improves capital efficiency. It enhances Funding Circle's liquidity position and ability to scale originations.
- April 2026: LendingClub Corporation launched home improvement financing and began underwriting and originating loans through an inaugural partnership with Wisetack. The move expands the home improvement lending segment and embeds LendingClub into the consumer home improvement ecosystem. It broadens the product vertical through strategic partnerships to reach homeowners and suppliers.
- February 2026: Funding Circle Holdings plc announced a new 700 million pound forward flow commitment over two years with Waterfall Asset Management, with senior financing from Citi. The facility increases lending capacity and diversifies funding sources. It signals greater engagement with institutional capital to support growth.


Research Methodology Framework and Report Scope
Market Definition and Coverage
For this study, the market covers non-bank funding raised and deployed through digital and platform-led models, including peer-to-peer lending and crowdfunding, and it is measured in value terms in USD across major economies.
Scope exclusions: Traditional bank loans, standard capital markets issuance, and pure payment processing revenues are excluded where they do not represent alternative financing proceeds.
Segmentation Overview
- By Financing Type
- Peer-to-Peer Lending
- Crowdfunding (Equity, Reward/Donation)
- Revenue-Based Financing
- Merchant Cash Advance
- Invoice & Supply-Chain Finance
- Others (BNPL,Micro-Lending,Equipment Finance)
- By End User
- Individual Consumers
- Small & Medium Enterprises (SMEs)
- Large Enterprises
- Non-profit & Social-impact Organizations
- By Geography
- North America
- Canada
- United States
- Mexico
- South America
- Brazil
- Peru
- Chile
- Argentina
- Rest of South America
- Europe
- United Kingdom
- Germany
- France
- Spain
- Italy
- BENELUX (Belgium, Netherlands, Luxembourg)
- NORDICS (Denmark, Finland, Iceland, Norway, Sweden)
- Rest of Europe
- Asia-Pacific
- India
- China
- Japan
- Australia
- South Korea
- South East Asia
- Rest of Asia-Pacific
- Middle East and Africa
- United Arab Emirates
- Saudi Arabia
- South Africa
- Nigeria
- Rest of Middle East and Africa
- North America
Data Sources, Market Sizing, and Validation
Desk Research
Desk research was used to set clean market boundaries and to build the first version of demand and supply indicators that can be checked country by country. We relied on public data series and official publications, including World Bank financial inclusion indicators, IMF financial statistics, OECD financing data, BIS publications on credit markets, and SEC filings for listed platforms and intermediaries.
To keep the model grounded, we also reviewed central bank releases on lending conditions, government SME finance updates, and reputable press coverage on regulatory changes and platform performance. Where coverage gaps appeared in private company disclosure, we used paid subscriptions for company financials and intelligence, news and financials, and patent databases to validate business scale and product activity. The sources listed here are illustrative only, and many other references were used to collect, validate, and clarify data points through the research process.
Primary Interviews and Surveys
Primary work focused on interviews and structured surveys with platform operators, investors, risk and underwriting teams, and borrower-side users across key regions, so adoption assumptions and pricing behavior could be tested against real reporting and underwriting practices. These discussions helped us confirm which products are actively counted as alternative financing in each market, and they also helped tighten inputs such as approval rates, ticket sizes, and the funding-purpose mix when desk sources were not detailed enough.
Distribution of primary research fieldwork respondents
| Company type | Respondent position | Region |
|---|---|---|
| Top tier: 39% | CXOs: 12% | APAC: 52% |
| Mid tier: 45% | Functional/Unit leaders: 32% | EMEA: 29% |
| Smaller Players: 16% | Managers: 56% | Americas: 19% |
Market-Sizing & Forecasting
Sizing starts with a top-down build where platform activity is reconstructed using country-level adoption signals, credit demand context, and observed financing flows, and then allocated across the included alternative financing products. Once that first total is formed, selective bottom-up checks are used to calibrate it, such as sampling published transaction volumes, applying observed average ticket sizes, and testing implied revenue or fee pools against available financial disclosures.
Key inputs tracked in the model include digital borrower penetration, SME credit gap direction, platform origination or funding volumes, average deal or loan ticket size trends, default and delinquency expectations that affect funding continuity, and major regulatory changes that expand or constrain platform operations. Forecasting uses scenario analysis supported by exponential smoothing on higher-frequency indicators, with assumptions refined based on what experts expect for interest rate conditions, investor risk appetite, and product-mix shifts. When bottom-up proxies were missing for smaller markets, gaps were handled through peer-market analogs that were later pressure-tested during primary conversations.
Data Validation & Update Cycle
Outputs are validated through several checks so extreme jumps are investigated before results are finalized. Model totals are compared with independent signals such as reported platform volumes, funding round activity, and macro credit indicators, and then variances are reviewed by another analyst for reasonableness.
When mismatches are material, we re-check definitions, currency conversions, and time alignment, and then re-contact selected respondents to confirm whether a product boundary or a local regulation caused the change. Reports are refreshed annually, with interim updates if a major policy shift, market disruption, or a large demand swing makes prior assumptions stale. Before delivery, a final pass is completed so clients receive the most current view available at the time of publication.
Mordor Intelligence's Alternative Financing Market Sizing Compared With Other Published Estimates
Published market values for alternative financing can differ widely because teams do not always count the same funding products, they apply different currency timing, and they can treat platform flow versus revenue as the same thing. Differences also appear when one estimate is anchored to a narrow set of geographies, while another blends regions with very different adoption maturity.
By tracking platform origination and funding-flow measures and refreshing the scope logic annually, Mordor Intelligence keeps the total tied to proceeds raised through included alternative financing models, instead of mixing in broader consumer credit or adjacent fintech revenues that inflate totals. Another driver is the forecast style, where some sources lean into aggressive growth assumptions around investor participation, while our scenarios are constrained by rate conditions, default expectations, and observed ticket-size progression from interviews.
Benchmark comparison
| Source | Market Size | Gaps in Research Methodology |
|---|---|---|
| Mordor Intelligence | USD 1.29 T (2025) | |
| Trade Journal A | USD 260.65 B (2024) | Uses a different base year and appears to cover a narrower alternative finance definition, with faster growth assumptions and less clarity on whether flows, revenue, or both are counted. |
| Industry Brief B | USD 64.30 B (2028) | Reports incremental growth over a period rather than a point-in-time market size, which can be misread as total market value, and the scope is sensitive to product and geography inclusion. |
The comparison shows that timing, what is being measured (flows versus revenue), and what is included in scope are the main reasons for the spread. Using repeatable inputs like funding volumes, ticket-size direction, and adoption signals makes the final number easier to trace and re-check when new data arrives, which helps decision-makers plan with fewer surprises.


Key Questions Answered in the Report
What is the current size of the Alternative Financing Market?
The Alternative Financing Market size reached USD 1.42 trillion in 2026 and is forecast to hit USD 2.27 trillion by 2031 at a 9.84% CAGR.
Which financing type is growing the fastest?
Revenue-based financing is expanding at a 27.26% CAGR because repayments flex with monthly sales, making it attractive to cash-flow-volatile businesses.
Why is Asia-Pacific the fastest-growing region?
Digital-first consumer behaviour, supportive licensing in hubs like Singapore, and expected fintech revenues rising to USD 1.5 trillion by 2030 power a 14.23% CAGR in Asia-Pacific.
How fragmented is the competitive landscape?
The top five players account for a limited share of revenues, resulting in a moderate market concentration score and creating opportunities for niche entrants to establish themselves.
What regulatory trend most benefits the sector?
Open-banking mandates such as the CFPB’s Section 1033 rule and Europe’s PSD3 provide uniform data-sharing standards that enhance underwriting accuracy and broaden borrower inclusion.
Which recent development signals institutional acceptance of alternative finance?
The issuance of marketplace-loan ABS has gained momentum, with LendingClub's investment-grade securitization tranches reflecting strong acceptance within mainstream capital markets.
Page last updated on:






