
Alpha Methylstyrene Market Size and Share
Market Overview
| Study Period | 2021 - 2031 |
|---|---|
| Market Volume (2026) | 307.70 kilotons |
| Market Volume (2031) | 369.18 kilotons |
| Growth Rate (2026 - 2031) | 3.71 % |
| Fastest Growing Market | Asia Pacific |
| Largest Market | Asia Pacific |
| Market Concentration | High |
Major Players *Disclaimer: Major Players sorted in no particular order Image © Mordor Intelligence. Reuse requires attribution under CC BY 4.0. | |

Alpha Methylstyrene Market Analysis by Mordor Intelligence
The Alpha Methylstyrene Market size is estimated at 307.70 kilotons in 2026, and is expected to reach 369.18 kilotons by 2031, at a CAGR of 3.71% during the forecast period (2026-2031). This growth rests on three structural pivots: Asia-Pacific refinery-to-chemicals integration, automotive lightweighting, and electronics miniaturization. Roughly 95% of global Alpha-Methylstyrene output remains tied to phenol economics, so supply swings more with phenol than with direct Alpha-Methylstyrene demand. Capacity rationalization in Japan and Europe has begun as integrated Chinese complexes push surplus volumes into export channels, while producers that control phenol, acetone, and Alpha-Methylstyrene in one site achieve clear cost advantages. High-purity grades are gaining momentum because downstream users now specify benzene-free and phenol-below-20 ppm limits, a trend most visible in electronics and medical devices.
Key Report Takeaways
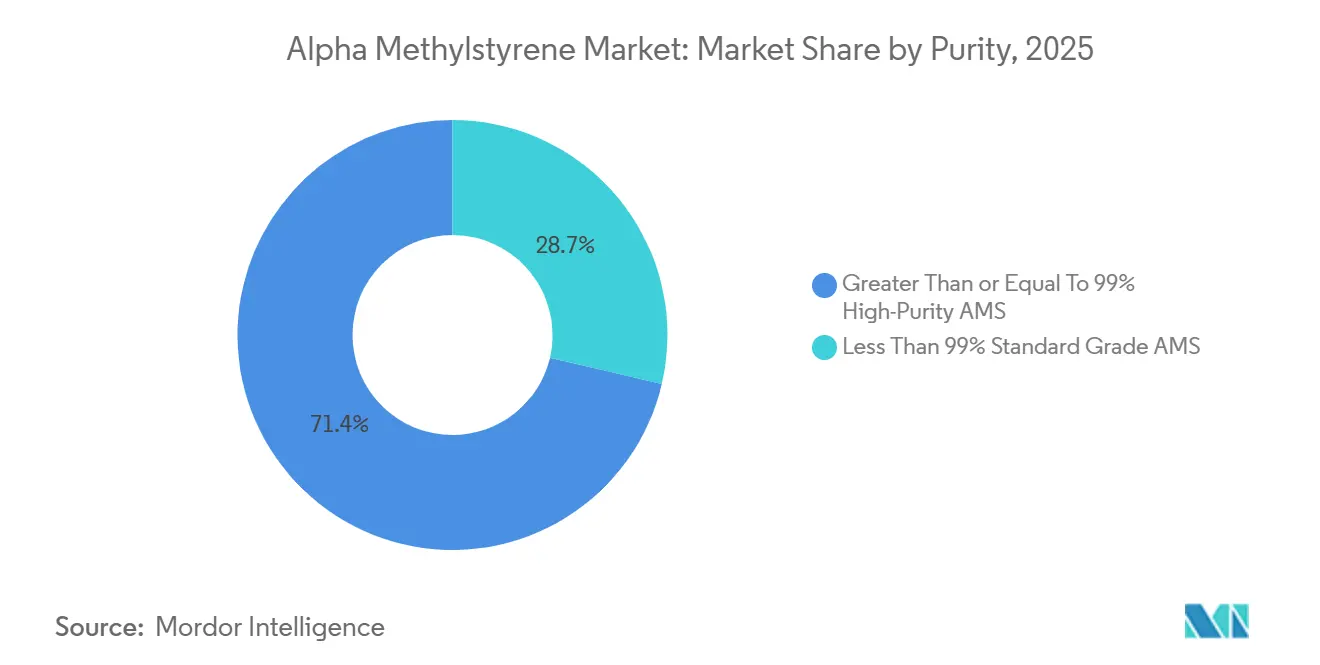
- By purity, high-purity (≥99%) grades commanded 71.35% of the alpha-methylstyrene market share in 2025, while the same category is forecast to expand at a 4.69% CAGR through 2031.
- By form, liquid bulk held 90.88% of the alpha-methylstyrene market size in 2025, yet solid flaked material is projected to grow at a 4.35% CAGR over the same period.
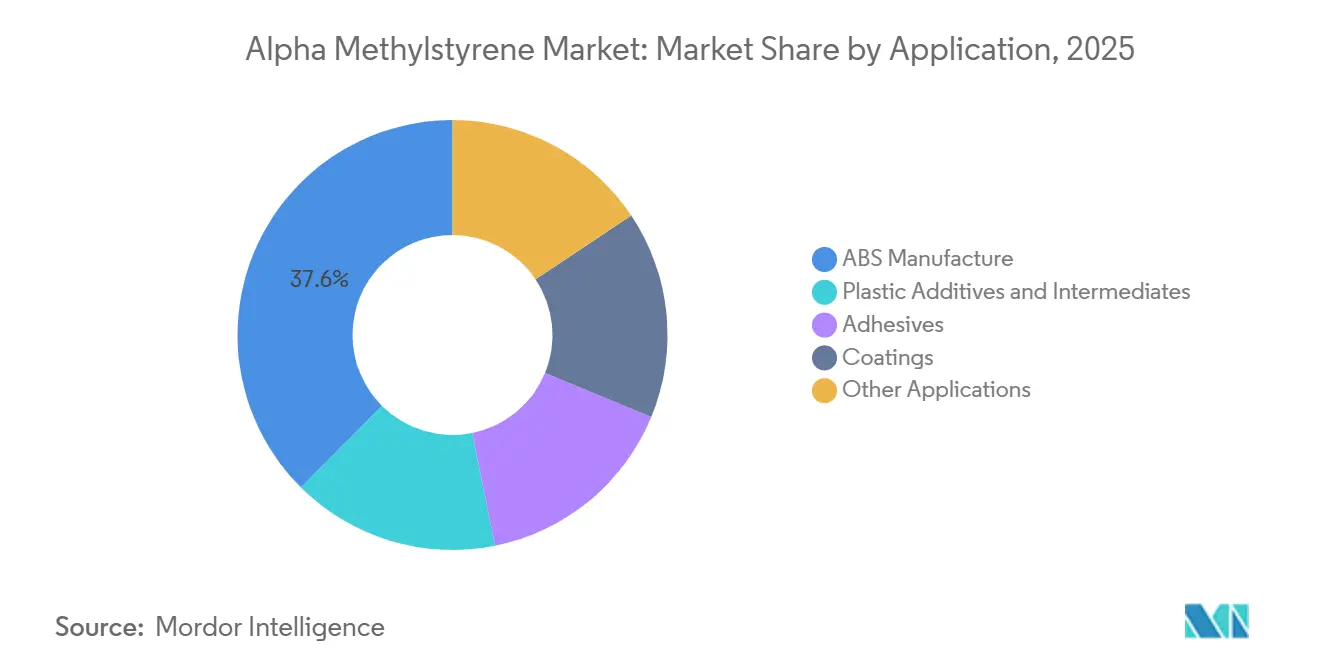
- By application, ABS manufacture led with 37.56% of the alpha-methylstyrene market size in 2025, whereas plastic additives and intermediates record the highest expected CAGR at 4.18% to 2031.
- By end user, the automotive segment accounted for 32.75% of the alpha-methylstyrene market share in 2025, and the tire segment is poised for a 5.22% CAGR to 2031.
- By geography, Asia-Pacific controlled 56.06% of 2025 volume and is forecast to advance at a 5.62% CAGR through 2031.
Note: Market size and forecast figures in this report are generated using Mordor Intelligence’s proprietary estimation framework, updated with the latest available data and insights as of January 2026.
Market Trends and Insights
Drivers Impact Analysis of Alpha Methylstyrene Market*
| Drivers | (~) % Impact on CAGR Forecast | Geographic Relevance | Impact Timeline |
|---|---|---|---|
| Surging demand in lightweight automotive parts | +1.2% | Asia-Pacific, North America, Europe | Medium term (2-4 years) |
| Rising consumption in heat-resistant electronic encapsulants | +0.9% | Asia-Pacific, North America | Medium term (2-4 years) |
| Growing use in medical devices | +0.5% | North America, Europe, South and Southeast Asia | Long term (≥4 years) |
| Emergence of para-cumylphenol in battery electrolytes | +0.3% | Europe, Asia-Pacific EV hubs | Long term (≥4 years) |
| Closed-loop AMS recovery in caprolactam complexes | +0.4% | Europe, Japan, China | Short term (≤2 years) |
| Source: Mordor Intelligence | |||
Surging Demand in Lightweight Automotive Parts
Automakers specify Alpha-Methylstyrene-modified ABS to push heat-deflection temperatures beyond 100 °C while trimming component weight by nearly one-fifth, an essential gain as battery packs crowd interior space. A 2020 patent from INEOS Styrolution documents ABS grades with up to 10 wt% Alpha-Methylstyrene that meet strict VOC and thermal targets for interior trims[1]. Strong electric-vehicle output in China keeps the throughput of such resins high, and North American suppliers are mirroring the formulation shift. Adoption should crest in the medium term as the EV mix accelerates and legacy internal-combustion programs sunset.
Rising Consumption in Heat-Resistant Electronic Encapsulants
Semiconductor packaging now requires polymers that survive 260 °C reflow without warping. High-purity Alpha-Methylstyrene meets this bar and complies with RoHS plus REACH, enabling its use in laptop, smartphone, and IoT housings produced across East Asia. The FDA permits indirect food contact under several CFR clauses, which further broadens appliance and packaging demand[2]. With Asia-Pacific responsible for more than 70% of global electronics assembly, the driver maintains a mid-term push.
Growing Use in Medical Devices Boosting Demand
Repeated steam-sterilization cycles and harsh disinfectants prompt device makers to favor Alpha-Methylstyrene-based polymers for housings and single-use components. The resin’s thermal stability and chemical inertness make it compatible with ISO 13485 and U.S. FDA quality frameworks. North America and Europe dominate early uptake, but Indian and ASEAN contract manufacturers are scaling output to serve cost-sensitive export markets.
Emergence of Para-Cumylphenol as Battery-Electrolyte Additive
Para-cumylphenol derived from Alpha-Methylstyrene improves the thermal stability of lithium-ion electrolytes used in high-energy nickel-rich cells. Recent peer-reviewed work on similar aromatic additives demonstrated reduced flammability at low concentration while maintaining 5.0 V electrochemical windows. Europe and key Asian EV hubs are piloting such formulations, setting the stage for long-term, niche but lucrative demand.
Restraints Impact Analysis of Alpha Methylstyrene Market*
| Restraints | (~) % Impact on CAGR Forecast | Geographic Relevance | Impact Timeline |
|---|---|---|---|
| Hazardous waste streams and stricter REACH/EPA limits on cumene | -0.8% | Europe, North America, global | Short term (≤2 years) |
| Volatility in crude-derived feedstock pricing | -0.6% | Europe, Southeast Asia, global | Short term (≤2 years) |
| Rise of bio-based styrenic analogues | -0.3% | North America, Europe, Asia-Pacific bio-hubs | Long term (≥4 years) |
| Source: Mordor Intelligence | |||
Hazardous Waste Streams and Stricter REACH/EPA Limits on Cumene
Cumene’s classification as a hazardous air pollutant drives capital spending on VOC abatement, while RCRA rules curb the storage time of Alpha-Methylstyrene wastes with a flash point of 53.9 °C. Smaller standalone producers struggle with the resulting compliance cost, accelerating consolidation.
Volatility in Crude-Derived Feedstock Pricing
Benzene and propylene, which form cumene, track crude oil swings. When phenol demand softens, but cumene costs stay high, merchant Alpha-Methylstyrene margins compress sharply. Import-dependent Europe faces the steepest exposure, prompting hedging and contract repricing strategies.
*Our forecasts treat driver/restraint impacts as directional, not additive. The impact forecasts reflect baseline growth, mix effects, and variable interactions.
Alpha Methylstyrene Market Segment Analysis
By Purity:
Higher Grades Capture Premium MarginsHigh-purity (≥99%) Alpha-Methylstyrene controlled 71.35% of 2025 volume and is forecast for a 4.69% CAGR to 2031, twice the pace of standard grades. Electronics and pharmaceutical buyers insist on benzene-free material with phenol below 20 ppm, allowing producers such as DOMO Chemicals to fetch 10-20% price premiums. The Alpha-Methylstyrene market size for high-purity volumes is therefore set to widen its lead as validation protocols tighten across printed-circuit and medical-device supply chains. Conversely, the commoditized standard grade remains burdened by Asian oversupply and has limited scope for differentiation.
ASTM’s dedicated D7977 test method now gives downstream buyers tighter control over polymer contaminants, reinforcing the bifurcation of the Alpha-Methylstyrene market. Integrated complexes that purify on-site can guarantee supply continuity, positioning themselves as partners of choice for high-spec applications in semiconductors, diagnostic probes, and thermoformed medical trays.
By Form:
Liquid Bulk Prevails but Safety Concerns Aid SolidsLiquid Alpha-Methylstyrene dominates with 90.88% of 2025 shipments because continuous ABS and SAN polymerization plants depend on metered liquid feed. The Alpha-Methylstyrene market share for this form remains elevated, yet regulatory focus on VOC exposure is spurring a 4.35% CAGR in solid flakes.
Flaked material melts in sealed vessels, curbing vapor loss and easing compliance with tight workplace-exposure limits. EU guidelines for large-volume organic chemicals favor such approaches, giving solids momentum in Europe and Japan, where environmental permitting standards are strictest.
By Application:
ABS Leads, Additives Gain GroundABS polymerization absorbed 37.56% of the 2025 demand, anchoring the alpha-methylstyrene market. Plastic additives and intermediates will, however, post a faster 4.18% CAGR to 2031 as formulators swap in Alpha-Methylstyrene to raise glass-transition temperatures in automotive interiors and appliance housings.
Patented graft-sheath blends show that modest Alpha-Methylstyrene loadings deliver elevated Vicat softening points without compromising impact strength, a balance valued by tier-1 suppliers. Para-cumylphenol, synthesized from the monomer, further broadens reach into battery electrolytes and specialty polycarbonates, reinforcing the additive segment’s upbeat outlook.

By End User:
Automotive Dominates, Tires AccelerateAutomotive captured 32.75% of 2025 volume, relying on alpha-methylstyrene-modified ABS for dashboards, door panels, and under-hood parts. The tire segment will log the fastest 5.22% CAGR through 2031 as SBR compounders deploy Alpha-Methylstyrene-influenced tackifiers that cut rolling resistance in electric-vehicle tires.
Regulatory tire-labeling schemes in the EU and upcoming U.S. rules elevate wet-grip and efficiency metrics, both of which benefit from Alpha-Methylstyrene chemistry. Electronics, building materials, and personal-care absorb steady volumes, but none match the automotive and tire thrust that now shapes investment decisions across the alpha-methylstyrene industry.
Geography Analysis
APAC Alpha Methylstyrene Market
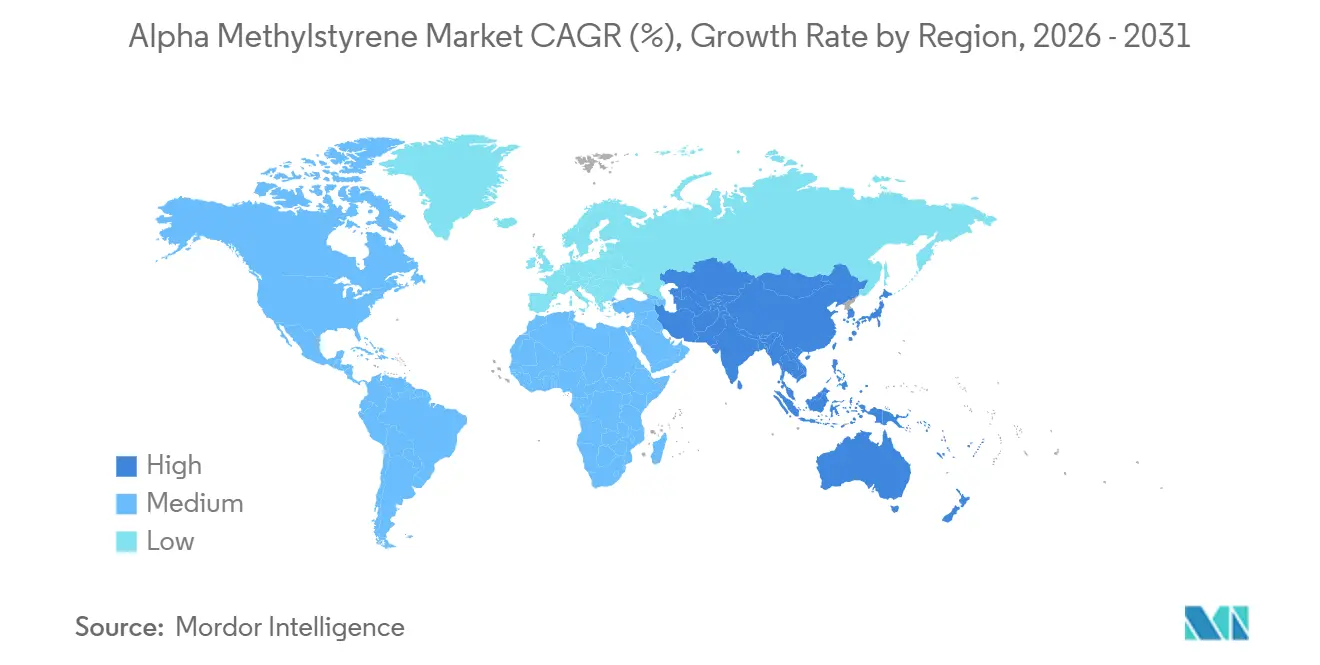
Asia-Pacific held 56.06% of global volume in 2025 and is projected to grow at a 5.62% CAGR to 2031 on the back of mega complexes in China that pair 20 million tons/year refineries with aromatics units churning out benzene, phenol, and ultimately Alpha-Methylstyrene. The hubs of Zhejiang Petroleum & Chemical and Hengli Petrochemical epitomize this integrated model, forcing older Japanese and European plants offline.
North America and Europe Alpha Methylstyrene Market
North America, while losing some volume share, specializes in high-purity output for electronics and healthcare. INEOS Phenol’s 2023 takeover of Mitsui Phenols Singapore underscores the region’s drive to secure Asian customer proximity and diversify feedstock risk. Europe grapples with tighter REACH rules, yet its producers invest in zeolite alkylation and VOC capture that elevate product quality and cut emissions, maintaining a premium foothold.
MEA and South America Alpha Methylstyrene Market
The Middle East and Africa and South America represent nascent pockets that import most of their needs. Low-cost naphtha in the Gulf could anchor future Alpha-Methylstyrene units, but the absence of downstream ABS and SAN clusters dilutes short-term prospects. Overall, the three established regions will continue to account for more than 90% of Alpha-Methylstyrene market transactions to 2031.
Regulatory Landscape
Alpha-methylstyrene (AMS) is regulated primarily through hazardous-chemicals frameworks that govern classification, labeling, exposure control, and waste handling for volatile organic liquids. In the European Union, CLP (EC) No 1272/2008 drives GHS-aligned classification and labeling, while REACH (EC) No 1907/2006 obligations shape market access for manufacturers and importers; these compliance requirements are increasingly reflected in customer specifications that emphasize low residuals (for example, phenol below 20 ppm for high-purity AMS used in electronics and medical supply chains).
Workplace exposure and environmental controls also influence operating practices and product form choices. In the United States, NIOSH guidance lists a 50 ppm TWA recommended exposure limit for AMS, while OSHA requirements for hazardous chemicals and plant safety management reinforce vapor-control, storage, and handling measures for flammable liquids. Updates to safety documentation remain an ongoing compliance anchor across regions; for example, Fujifilm Wako updated an AMS Safety Data Sheet in April 2026 aligned to Japan JIS Z 7253:2019, mirroring the broader trend toward tighter hazard communication and cross-border documentation consistency.
Value Chain Analysis
AMS supply is dominated by co-product generation from the cumene (Hock) process used to make phenol and acetone, which keeps AMS availability closely tied to phenol operating rates and turnarounds rather than stand-alone AMS demand. Feedstocks start with benzene and propylene (to cumene), then phenol/acetone production generates AMS, which is recovered and purified to standard or high-purity grades; integrated producers that control phenol, acetone, and AMS on one site generally hold a cost and reliability advantage, consistent with the market context that roughly 95% of global AMS output is tied to phenol economics.
Downstream, AMS primarily flows into ABS and other styrenic resins (as a comonomer to raise heat performance), with additional pull from adhesives, coatings, and plastic additives/intermediates. Distribution is largely bulk liquid for continuous polymerization plants, with flaked/solid formats used where tighter VOC handling or storage requirements favor lower vapor loss. Technology and process know-how also shape the chain, including purification to meet benzene-free and very low phenol limits and recovery/hydrogenation options that convert AMS back to cumene, effectively setting a floor via alternative internal uses and tightening the link between AMS pricing and broader aromatics economics.
Competitive Landscape
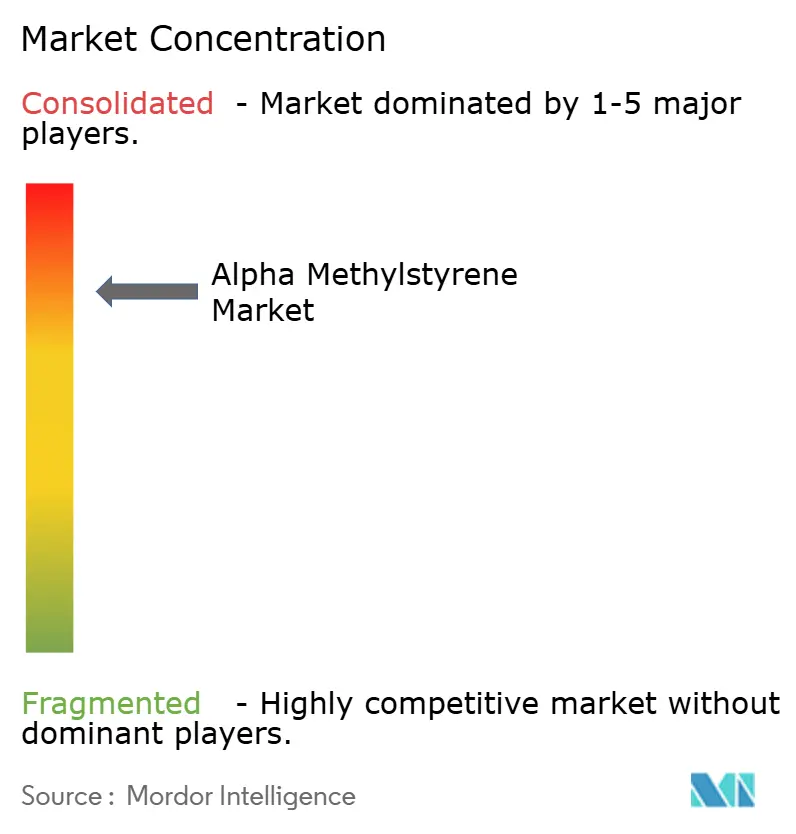
The Alpha Methylstyrene market is highly consolidated, with the top five players accounting for a significant market share. INEOS Phenol’s USD 330 million acquisition of Mitsui Phenols Singapore in 2023 boosted its Asian presence and signaled a broader consolidation trend. Mitsui Chemicals, meanwhile, elected to shutter its aging Ichihara unit by 2026 and co-opt logistics with Mitsubishi Chemical to defend domestic supply reliability. DOMO Chemicals leverages its caprolactam chain to deliver ≥99.6% purity Alpha-Methylstyrene, capturing high-margin electronics and pharma orders. Honeywell UOP’s technology packages, which fold in Alpha-Methylstyrene hydrogenation for up-cycle to cumene, give licensees a closed-loop edge that slashes waste and improves economics. Start-ups commercializing biosourced styrenic monomers represent a credible long-term threat, especially if carbon-pricing schemes reward lower-footprint feedstocks. For now, incumbents with deep integration and purification know-how retain the upper hand but must continue to invest in specialty grades to protect margins when commodity cycles soften.
Alpha Methylstyrene Industry Leaders
-
INEOS
-
Advansix
-
Eni S.p.A. (Versalis)
-
Moeve (Cepsa)
-
Domo Chemicals
- *Disclaimer: Major Players sorted in no particular order
Alpha Methylstyrene Market Companies Covered in this Report
- Advansix
- ALTIVIA
- Chang Chun Group
- Deepak
- Domo Chemicals
- Eni S.p.A.
- INEOS
- Kraton Corporation
- KUMHO PandB CHEMICALS.,INC.
- LG Chem
- Mitsubishi Chemical Group Corporation
- Moeve (Cepsa)
- ROSNEFT
- Seqens
- SI Group, Inc.
- SIBUR Holding PJSC
- Solvay
- Sumitomo Chemical Co., Ltd.
- Yangzhou Lida Resin Co.,Ltd.
Market Opportunities and Future Outlook
A major opportunity area sits in high-purity AMS where electronics, medical devices, and high-spec automotive interiors increasingly specify benzene-free material and phenol below 20 ppm, creating whitespace for producers with on-site purification and validated quality systems. This is visible in the current market structure: high-purity (>=99%) grades already accounted for 71.35% of 2025 volume, and suppliers use tighter analytical controls (for example, ASTM D7977 contamination testing referenced in the report context) to differentiate beyond commodity supply.
On the supply side, the phenol-linked nature of AMS creates openings for trade rebalancing and regional sourcing strategies when capacity changes occur at phenol/acetone hubs. The report context highlights capacity rationalization in Japan and Europe alongside export pressure from integrated Chinese refinery-to-chemicals complexes, and Europe faces additional constraints from VOC and waste compliance costs tied to cumene and AMS handling. In this environment, integrated sites that can stabilize phenol-acetone-AMS operations, offer solid/flaked options for VOC management, or provide closed-loop recovery concepts in adjacent complexes (for example, caprolactam-linked recovery mentioned in the report context) have clearer pathways to win higher-margin, specification-driven demand rather than competing only on merchant volumes.
Recent Industry Developments in Alpha Methylstyrene Market
- June 2026: INEOS Phenol confirmed that its Doel, Belgium facility restart was postponed, with management indicating it would not restart in 2027 amid volatile European market conditions. As Doel is part of the phenol-acetone chain that co-produces alpha-methylstyrene, the decision tightens regional optionality for merchant material and reinforces the market shift toward lower-cost, integrated supply hubs.
- January 2025: Mitsui Chemicals and Mitsubishi Chemical began a joint study to pool storage and logistics for phenol-related products, including alpha-methylstyrene. The initiative targets lower logistics emissions and better supply continuity during plant turnarounds, supporting reliability for downstream ABS and additives customers in Japan.
- April 2023: INEOS Phenol closed its USD 330 million acquisition of Mitsui Phenols Singapore, adding 20,000 tpa of alpha-methylstyrene capacity alongside phenol and acetone assets. The deal strengthened INEOS Phenol's proximity to Asian polycarbonate and ABS value chains and underscored consolidation advantages for integrated producers.
Alpha Methylstyrene Market Report Scope and Research Methodology
Market Definition and Coverage
For this report, the alpha-methylstyrene market covers the demand and supply of alpha-methylstyrene (AMS) as a standalone chemical, sold as bulk liquid or solid flakes for use as an intermediate or co-monomer in industrial formulations.
Scope exclusions: finished polymers and downstream derivatives made from AMS (such as ABS resin and para-cumylphenol) are excluded from the AMS market value.
Segments Covered in This Report
- By Purity
- Greater Than or Equal To 99% High-Purity AMS
- Less Than 99 % Standard Grade AMS
- By Form
- Liquid (Bulk)
- Solid (Flaked)
- By Application
- ABS Manufacture
- Plastic Additives and Intermediates
- Adhesives
- Coatings
- Other Applications
- By End-user Industry
- Automotive
- Tire
- Plastics
- Electronics
- Other Applications
- By Geography
- Asia-Pacific
- China
- India
- Japan
- South Korea
- ASEAN Countries
- Rest of Asia
- North America
- United States
- Canada
- Mexico
- Europe
- Germany
- United Kingdom
- France
- Italy
- Spain
- NORDIC Countries
- Rest of Europe
- South America
- Brazil
- Argentina
- Rest of South America
- Middle East and Africa
- Saudi Arabia
- South Africa
- Rest of Middle East and Africa
- Asia-Pacific
Data Sources, Market Sizing, and Validation
Desk Research
We start by building a fact base around AMS production, trade, and end-use pull signals, since the market tracks broader petrochemical and polymer activity. We use public sources such as UN Comtrade trade statistics, USITC trade data, Eurostat industrial and trade series, and national statistical offices to understand volumes, import dependence, and shifts in regional flows.
To ground the price and supply context, we also refer to sources such as IEA petrochemicals outlooks, customs and port releases where available, and peer-reviewed polymer and chemical-engineering journals for application and substitution cues. Company annual reports, investor presentations, and reputable chemical industry press help cross-check capacity announcements and operating status. When needed, we use paid subscriptions for company financials and intelligence, patent databases, and an import-export shipment-level database to validate movements at a practical level. These desk sources are not exhaustive, and other references are reviewed during data collection, validation, and clarification.
Primary Interviews and Surveys
Primary work is used to pressure-test what we saw in public data, especially around typical contract pricing behavior, plant utilization patterns, and how demand changes by application over the year. Interviews cover producers, distributors, and downstream formulators across APAC, EMEA, and the Americas, which lets us confirm and adjust assumptions on grade mix, buying cycles, and regional demand splits where the public record is unclear.
Distribution of primary research fieldwork respondents
| Company type | Respondent position | Region |
|---|---|---|
| Top tier: 25% | CXOs: 19% | APAC: 44% |
| Mid tier: 56% | Functional/Unit leaders: 38% | EMEA: 33% |
| Smaller Players: 19% | Managers: 43% | Americas: 23% |
Market-Sizing & Forecasting
Sizing is built using a top-down approach where production and trade data are reconstructed into an apparent-consumption view for AMS, and then filtered by the portion realistically available to end-use applications. Since AMS is often moved in bulk and demand follows a few well-understood industrial chains, we keep the logic repeatable across geographies.
To corroborate totals, selective bottom-up approximations are run using sampled regional supplier volumes, distributor channel checks, and an ASP times volume view by grade and form. These checks help adjust for double counting and unallocated flows. Key model inputs include operating rates and capacity changes for AMS and linked chains, import-export balances by region, the share of AMS directed to plastic additives and intermediates versus other uses, typical contract pricing ranges versus spot pricing, and regional manufacturing indicators that track plastics and resin activity.
For forecasting, we mainly use scenario analysis with a light multivariate overlay, since price and volume can move differently across cycles. Demand outlooks from interviews are translated into practical assumptions on utilization recovery, regional trade shifts, and price normalization, then applied consistently across the forecast period. Where bottom-up signals are thin for a country, gaps are handled using regional trade proxies and validated application shares, and then rechecked with at least one primary input before finalizing.
Data Validation & Update Cycle
Validation is done through several checks so the final outputs do not depend on a single data stream. We compare model results against independent signals such as trade intensity, known capacity movements, and application-level demand direction, then investigate any sharp year-to-year jumps that do not align with the underlying market indicators.
Before sign-off, assumptions and calculations go through multi-step analyst reviews. Follow-up outreach is triggered when interview feedback conflicts with desk indicators or when a major capacity or regulatory event occurs. The report is refreshed annually, and interim updates are made when material events change supply, pricing, or trade flows. Before delivery, we re-check the key inputs so clients receive the latest updated view.
Mordor Intelligence's Alpha Methylstyrene Market Estimate Compared With Other Published Estimates
Published market sizes for AMS do not always match because each source makes different choices on what counts as the market, which year is treated as the anchor, and how prices are applied to convert volumes into value. Differences also show up when one study relies more on announced capacity plans, and another relies more on realized trade and utilization signals.
Trade flows, utilization direction, and typical contract price ranges are the evidence checks that keep Mordor Intelligence's AMS estimate aligned to the sale of neat AMS (bulk liquid and flake), rather than counting downstream products that use AMS as an input. In some published figures, the value expands because it blends AMS with adjacent derivatives or uses broad resin-demand proxies that can inflate the implied AMS demand pool, particularly when currency timing and regional price spreads are simplified.
Benchmark comparison
| Source | Market Size | Gaps in Research Methodology |
|---|---|---|
| Mordor Intelligence | USD 0.00 B (2026) | |
| Global Consultancy A | USD 0.51 B (2024) | Uses a value-first build with broad application buckets and does not clearly separate neat AMS from downstream derivative value, which can push the total upward in years where resin and additives pricing is firm. |
| Industry Publisher B | USD 0.56 B (2025) | Applies standardized price assumptions and longer forecast windows, which can smooth out contract versus spot differences and can overstate value if utilization is assumed close to full rates. |
The spread in the table is mainly explained by boundary choices and by how volume is converted into value using price assumptions. Our approach stays traceable to observable supply, trade, and application signals, so clients can see how each input affects the final number and update it consistently when conditions change.
Key Questions Answered in the Report
How large is the Alpha-Methylstyrene market in 2026?
The market is estimated at 307.70 kilotons in 2026 and is projected to expand at a 3.71% CAGR through 2031.
Which region drives most Alpha-Methylstyrene demand?
Asia-Pacific leads with 56.06% of global volume in 2025 and the fastest 5.62% growth outlook.
Why are high-purity grades gaining share?
Electronics, medical, and automotive customers now demand benzene-free material with phenol below 20 ppm, boosting ≥99% purity volumes.
What end-use segment is growing fastest?
The tire sector, fueled by electric-vehicle efficiency goals, is forecast to grow at a 5.22% CAGR to 2031.
How exposed is the market to feedstock volatility?
Highly exposed, since 95% of supply comes as a phenol co-product, tying margins to crude-linked benzene and propylene prices.
Are bio-based alternatives a real threat?
Yes, bio-refineries are piloting renewable styrenics that could erode 10-15% of specialty demand after 2030 if scale economics improve.