Almond Market Size and Share
Almond Market Analysis by Mordor Intelligence
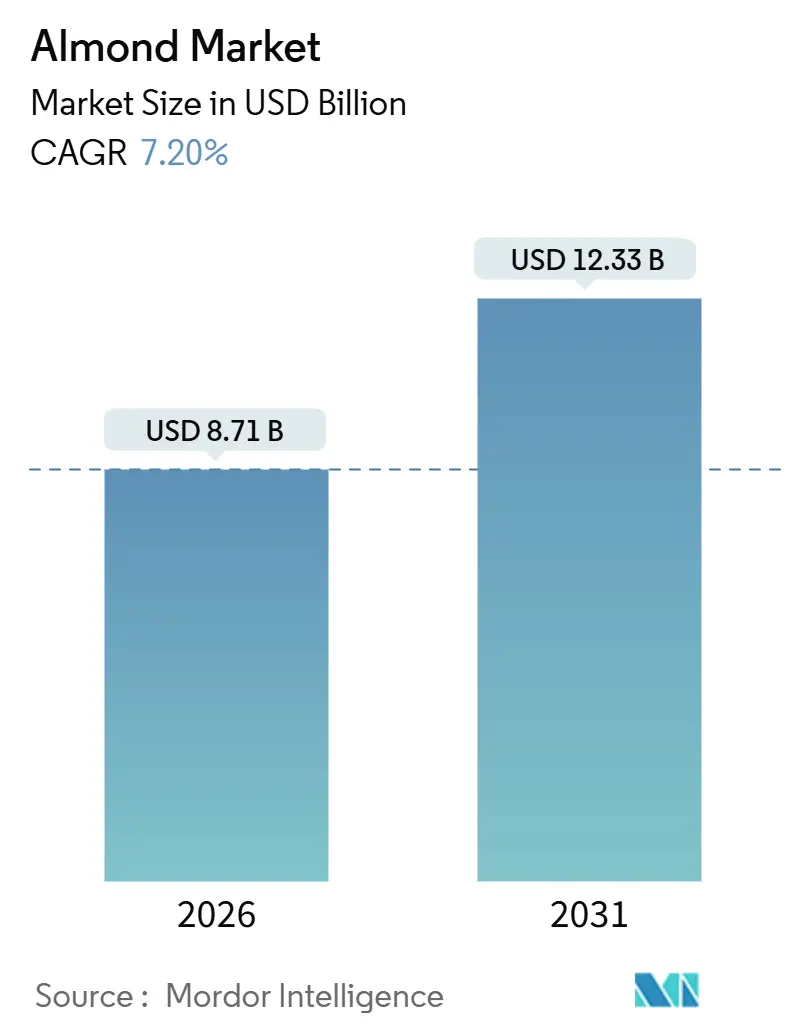
The almond market size is estimated at USD 8.71 billion in 2026 and is projected to reach USD 12.33 billion by 2031, growing at a 7.20% CAGR during the forecast period. Strong plant-based dairy uptake, orchard mechanization, and resilient breeding programs are shifting almonds from a snack into a strategic protein source that underpins large portions of the global plant-based food chain. Growing middle-class demand in Asia, premium ingredient positioning in Europe, and vertically integrated processing in California are creating opportunities for price realization, despite lingering farm-gate price pressure. Precision irrigation, genome-edited rootstocks, and carbon credit programs are reducing water risk exposure while increasing investor confidence in long-term orchard assets. Consolidation among processors is enabling capital-intensive upgrades such as steam sterilization that support stricter aflatoxin rules in importing nations. These developments position the almond market for sustained value creation, even as producers face groundwater quotas and spikes in pollination costs.
Key Report Takeaways
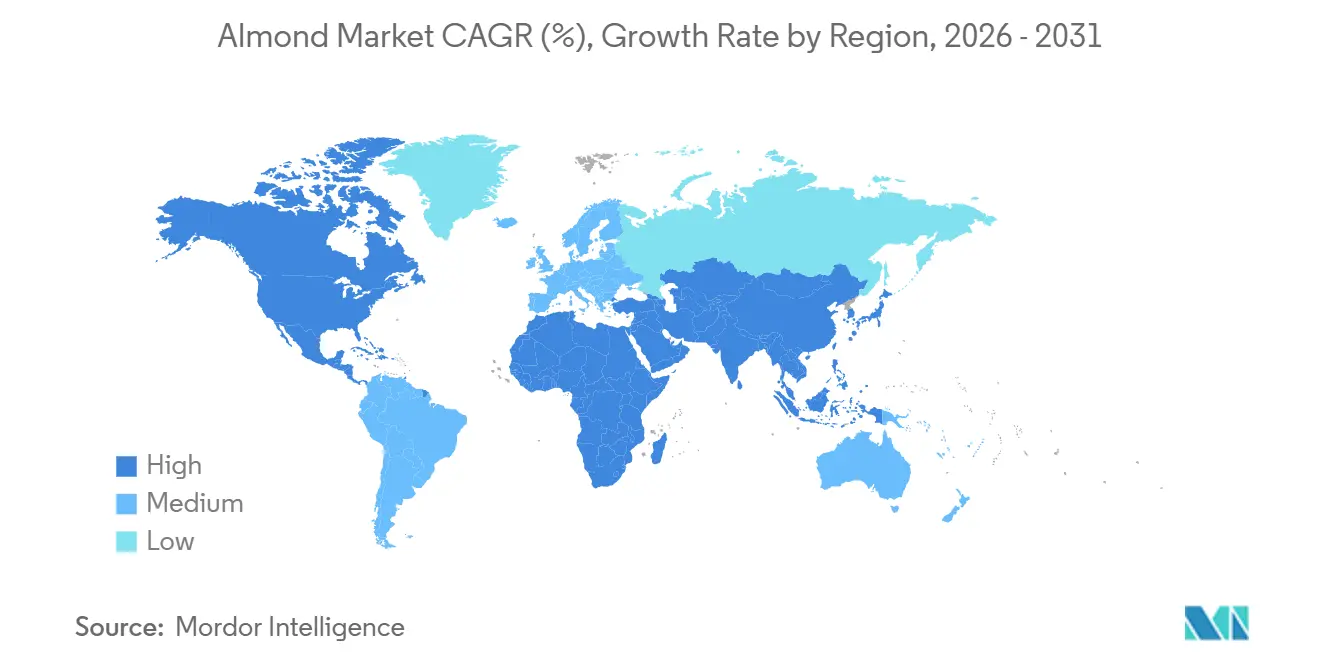
- By geography, North America led the almond market share in 2025, with 38.2%, while the Asia-Pacific region is forecast to expand at a 7.8% CAGR through 2031.
Note: Market size and forecast figures in this report are generated using Mordor Intelligence’s proprietary estimation framework, updated with the latest available data and insights as of January 2026.
Global Almond Market Trends and Insights
Drivers Impact Analysis
| Driver | (~) % Impact on CAGR Forecast | Geographic Relevance | Impact Timeline |
|---|---|---|---|
| Rising demand from plant-based dairy and confectionery industries | +1.8% | Global, with concentration in North America, and Asia-Pacific urban centers | Medium term (2-4 years) |
| Expansion of mechanized orchards | +1.2% | North America (California), Australia, and Spain (irrigated zones) | Long term (≥ 4 years) |
| Government subsidies for nut cultivation | +0.8% | North America (USDA MAP), Spain (CAP), Australia (MASC), and Chile | Short term (≤ 2 years) |
| Genome-edited rootstocks boost salinity tolerance | +0.6% | North America (California Central Valley), Australia (Murray-Darling Basin), and Spain (Andalucía) | Long term (≥ 4 years) |
| Carbon-credit premiums for low-water "blue-footer" almonds | +0.4% | North America (California) and Australia, with pilot programs in Spain | Medium term (2-4 years) |
| High-oleic almond varieties extend snack shelf life | +0.9% | Global, with early adoption in North America processing hubs | Medium term (2-4 years) |
| Source: Mordor Intelligence | |||
Rising Demand from Plant-Based Dairy and Confectionery Industries
Almond milk, yogurt alternatives, and chocolate fillings are capturing incremental volume from consumers who seek lactose-free and vegan options. The European Union imported 261,534 metric tons in the 2023-24 season, allocating most of this volume to food processing and confectionery. India’s imports climbed in the same year as urban snack demand accelerated. Saudi Arabia’s packaged food sales reached USD 22.9 billion in 2023, creating opportunities for almond inclusions in premium bars and bakery fillings [1]Source: United States Department of Agriculture, “Almond Production and Marketing,” USDA.gov. Asia-Pacific beverage makers are increasingly substituting dairy ingredients with almond-based alternatives due to the high prevalence of lactose intolerance. Processors that invest in steam sterilization and slicing capacity can therefore secure premium contracts with multinational food brands that demand ready-to-use, shelf-stable almond inputs.
Expansion of Mechanized Orchards
Mechanical shakers, continuous-flow hullers, and AI-enabled irrigation controllers are cutting harvest labor costs while improving water productivity. Spain planted 765,541 hectares by 2023, with 15.5% still pre-bearing yet already fitted for mechanized harvest systems. Olam Food Ingredients has pledged to push irrigation distribution uniformity to 90% across all orchards by 2030, up from an 80% baseline, using smart sensors and AI to monitor tree health [2]Source: Olam Food Ingredients, “New Almond Sustainability Targets,” OFI.com. Australia’s hedgerow systems yield 0.463 kilograms per cubic meter of water, compared to 0.331 kilograms under open-vase configurations, underscoring the efficiency gain of mechanized layouts. Wonderful Pistachios and Almonds invested USD 500 million in Central Valley processing and employee programs that support large-scale orchard modernization. These capital-intensive upgrades favor cooperative and corporate growers over smallholders, hastening consolidation within the almond market.
Government Subsidies for Nut Cultivation
Public incentives are lowering entry barriers and accelerating the rollout of orchards in leading producer regions. The USDA Market Access Program funds overseas promotion that helps California growers build consumer awareness in China, Germany, and Japan. Spain utilizes European Union Common Agricultural Policy payments to expand organic almond acreage, enabling one-third of the national tree-nut area to achieve organic certification, with 82% of this area dedicated to almonds [3]Source: Ministerio de Agricultura Pesca y Alimentación, “Avances superficies y producciones de cultivos,” MAPA.gob.es. Chile’s tax deferral laws support the establishment of orchards targeting Asian buyers. Australia’s risk-mitigation schemes lower financing costs but exclude some almond blocks, creating uneven uptake. Subsidy asymmetry gives Spanish and United States growers a cost advantage over producers in Iran and Morocco, shaping trade flows within the almond market.
Genome-Edited Rootstocks Boost Salinity Tolerance
Researchers at the University of California, Davis, and the Commonwealth Scientific and Industrial Research Organisation (CSIRO) use CRISPR-Cas9 to create rootstocks that control sodium uptake, thereby stabilizing yields in saline soils common to the Central Valley and the Murray-Darling Basin. Field trials are underway under the oversight of the United States Department of Agriculture's Animal and Plant Health Inspection Service (USDA APHIS), with commercial releases projected late in the decade. Spain’s agricultural institute runs parallel programs for drought-prone Andalucía. Adoption in Europe may lag due to the hurdles posed by Directive 2001/18/EC, giving California and Australia a head start. Salinity-tolerant trees can extend orchard lifespans and open new growing zones, expanding the almond market production frontier.
Restraints Impact Analysis
| Restraint | (~) % Impact on CAGR Forecast | Geographic Relevance | Impact Timeline |
|---|---|---|---|
| Water scarcity and irrigation caps | -1.3% | California (SGMA), Australia (Murray-Darling Basin), Spain (southeast), and Chile | Long term (≥ 4 years) |
| Volatile farm-gate prices from oversupply cycles | -0.9% | Global, with acute pressure in California and Spain | Short term (≤ 2 years) |
| Rising bee-rental costs following varroa-mite flare-ups | -0.7% | North America (California and Pacific Northwest) and Australia | Medium term (2-4 years) |
| Stricter aflatoxin action limits in emerging markets | -0.5% | Asia-Pacific (China, India, and Vietnam), Middle East (Egypt and Saudi Arabia), and Africa | Medium term (2-4 years) |
| Source: Mordor Intelligence | |||
Water Scarcity and Irrigation Caps
California’s Sustainable Groundwater Management Act forces basin-level sustainability by 2040, reducing pumping rights and raising compliance fees that erode grower margins. According to the Ministerio de Agricultura, Pesca y Alimentación (MAPA), rainfall deficits in 2024/25 resulted in a production decline of over 35% in Murcia and Valencia, while Aragón and Castilla-La Mancha reported increases. Chilean output remains constrained by the limited availability of surface water in northern zones. Growers invest in micro-sprinklers and deficit irrigation yet face capital recovery challenges, especially smallholders active in the almond market.
Volatile Farm-Gate Prices from Oversupply Cycles
Farm-gate price volatility, driven by cyclical oversupply and inventory drawdowns, erodes grower profitability and discourages orchard expansion. The challenge is that almond orchards have a 25- to 30-year productive lifespan, creating supply rigidity and delayed price responses to demand signals. Growers are exploring value-added processing, including almond flour, butter, and oil, to capture downstream margins, yet these investments require scale and market access that favor cooperatives and large processors over independent operators. Inventories continue to decline, yet supply growth still outpaces demand during some seasons, amplifying earnings volatility within the almond market.
Geography Analysis
In 2025, North America accounted for 38.2% of the almond market share, supported by California’s crop forecast for 2026-2031, which is based on bearing acres. Vertically integrated cooperatives export domestic production to over 100 countries, leveraging logistical advantages through dedicated shipping programs. Canada relies on imports for its snack and foodservice channels due to the absence of domestic orchards, which is caused by climatic constraints. Regulatory changes, such as groundwater fees under the preventive control rules of the Food Safety Modernization Act, have increased compliance costs while enhancing transparency in the supply chain. Investments in deficit irrigation and micro-sprinkler retrofits demonstrate regional adaptation strategies aimed at maintaining the almond production base.
The Asia-Pacific region is the fastest-growing, projected to grow at a CAGR of 7.8% through 2031. India's tariff rollback on United States almonds boosted imports for the 2023-24 period. China's recovery from the 2023 economic contraction led to increased purchases in 2024 and revitalized food-service demand. Vietnam experienced a surge in imports, driven by strong growth in bakery exports. Australia achieved a record almond harvest in 2024, with the majority of shipments directed to Asian buyers seeking counter-seasonal supply. Iran expanded shipments to Europe, while localized slicing and roasting units in India and China reduced lead times and enabled flavor customization, enhancing almond market penetration. Europe maintains a balance of significant domestic production alongside continued demand for imports. Italy's aging orchards are producing declining volumes, while Portugal and Greece focus on heritage varieties valued for their flavor. Spain's competitive position is supported by origin labeling and geographic proximity, which contribute to a strong and stable European almond market.
The Middle East and Africa offer rising consumption, rooted in confectionery traditions and driven by the modernization of snacks. Tunisia’s exports to the United States slipped in 2024, illustrating competitiveness challenges. In-shell consumption spikes during Ramadan, while kernel demand from bakery plants calls for diced and slivered formats. Suppliers that adjust packaging and product mix capture incremental almond market share. South America grows as a niche supplier. Limited processing capacity and water constraints curb the near-term upside, yet the counter-seasonal harvest window from January to March allows Chile to achieve attractive pricing when Northern Hemisphere stocks are low.
Competitive Landscape
Competitive intensity is moderate to high as vertically integrated cooperatives partner with large processors to command processing and export capacity. Wonderful Pistachios and Almonds oversees 250,000 acres and produces 650 million pounds annually, establishing itself as a global leader in scale. Blue Diamond Growers operates cooperative processing lines that deliver value-added flour and butter formats to international food companies. Olam Food Ingredients secured the first Rainforest Alliance certification for California almonds in June 2024, demonstrating supply-chain transparency that resonates with corporate buyers facing environmental reporting mandates.
Mid-tier players differentiate through sustainability and regional proximity. Select Harvests, Australia’s largest grower, mitigates climate exposure by balancing owned, leased, and third-party orchards. Spanish cooperative Almendras Llopis leverages mandatory origin labeling to promote locally sourced organic kernels across European retailers. Sahyadri Farms in India expands its sourcing programs to meet the rising demand for confectionery and shorten lead times. Technology investment accelerates across the board, with AI-driven irrigation controllers, drone canopy monitoring, and blockchain traceability improving input efficiency and buyer confidence in the almond market.
White-space areas include the adoption of high-oleic cultivars, carbon-credit monetization linked to water-efficient practices, and regional processing hubs in Asia that roast, slice, and pack almonds near consumption centers. Processors with steam sterilization, pasteurization, and micro-slicing lines command premiums by satisfying strict aflatoxin thresholds and extended shelf-life requirements. Independent growers lacking scale increasingly sign multi-year offtake agreements with cooperatives or downstream roasters to secure stable cash flow amid volatile spot prices.
Recent Industry Developments
- January 2025: Spain's Ministry of Agriculture implemented mandatory country-of-origin labeling regulations effective January 1, 2025, requiring disclosure on almond packaging sold in the European Union, creating an opportunity for product differentiation and valorization.
- June 2024: Olam Food Ingredients (Olam Group) secured the inaugural Rainforest Alliance certification for California almonds in the United States, underscoring its commitment to responsible sourcing. In partnership with the Almond Board of California, the California Water Action Collaborative, and other entities, this certification not only bolsters corporate sustainability objectives but also sets its almond ingredients apart in global supply chains.
- January 2024: The Wonderful Company published updated corporate information indicating that Wonderful Pistachios and Almonds operates 250,000 acres in partnership with grower networks, produces over 650 million pounds of nuts annually, and has invested over USD 500 million in California's Central Valley to support employee and community wellbeing, positioning the company as the world's largest vertically integrated pistachio and almond processor.
Research Methodology Framework and Report Scope
Market Definitions and Key Coverage
Our study defines the global almond market as the trade value of raw, sweet almonds, whether in-shell or shelled, sold at the first wholesale hand-off from growers or processors to food, snack, or ingredient buyers.
Scope exclusion: We leave out downstream derivatives such as almond milk, butter, flour, oil, bitter varieties grown for flavor extraction, and any nut blends.
Segmentation Overview
- By Geography
- North America
- United States
- Production Analysis (Area Harvested, Yield, and Production Volume)
- Consumption Analysis (Consumption Value and Volume)
- Import Market Analysis (Import Value, Volume, and Key Supplying Markets)
- Export Market Analysis (Export Value, Volume, and Key Destination Markets)
- Wholesale Price Trend Analysis and Forecast
- Regulatory Framework
- List of Key Players
- Logistics and Infrastructure
- Seasonality Analysis
- Canada
- Production Analysis (Area Harvested, Yield, and Production Volume)
- Consumption Analysis (Consumption Value and Volume)
- Import Market Analysis (Import Value, Volume, and Key Supplying Markets)
- Export Market Analysis (Export Value, Volume, and Key Destination Markets)
- Wholesale Price Trend Analysis and Forecast
- Regulatory Framework
- List of Key Players
- Logistics and Infrastructure
- Seasonality Analysis
- United States
- Europe
- Spain
- Production Analysis (Area Harvested, Yield, and Production Volume)
- Consumption Analysis (Consumption Value and Volume)
- Import Market Analysis (Import Value, Volume, and Key Supplying Markets)
- Export Market Analysis (Export Value, Volume, and Key Destination Markets)
- Wholesale Price Trend Analysis and Forecast
- Regulatory Framework
- List of Key Players
- Logistics and Infrastructure
- Seasonality Analysis
- Italy
- Production Analysis (Area Harvested, Yield, and Production Volume)
- Consumption Analysis (Consumption Value and Volume)
- Import Market Analysis (Import Value, Volume, and Key Supplying Markets)
- Export Market Analysis (Export Value, Volume, and Key Destination Markets)
- Wholesale Price Trend Analysis and Forecast
- Regulatory Framework
- List of Key Players
- Logistics and Infrastructure
- Seasonality Analysis
- Portugal
- Production Analysis (Area Harvested, Yield, and Production Volume)
- Consumption Analysis (Consumption Value and Volume)
- Import Market Analysis (Import Value, Volume, and Key Supplying Markets)
- Export Market Analysis (Export Value, Volume, and Key Destination Markets)
- Wholesale Price Trend Analysis and Forecast
- Regulatory Framework
- List of Key Players
- Logistics and Infrastructure
- Seasonality Analysis
- Greece
- Production Analysis (Area Harvested, Yield, and Production Volume)
- Consumption Analysis (Consumption Value and Volume)
- Import Market Analysis (Import Value, Volume, and Key Supplying Markets)
- Export Market Analysis (Export Value, Volume, and Key Destination Markets)
- Wholesale Price Trend Analysis and Forecast
- Regulatory Framework
- List of Key Players
- Logistics and Infrastructure
- Seasonality Analysis
- Spain
- Asia-Pacific
- Iran
- Production Analysis (Area Harvested, Yield, and Production Volume)
- Consumption Analysis (Consumption Value and Volume)
- Import Market Analysis (Import Value, Volume, and Key Supplying Markets)
- Export Market Analysis (Export Value, Volume, and Key Destination Markets)
- Wholesale Price Trend Analysis and Forecast
- Regulatory Framework
- List of Key Players
- Logistics and Infrastructure
- Seasonality Analysis
- Australia
- Production Analysis (Area Harvested, Yield, and Production Volume)
- Consumption Analysis (Consumption Value and Volume)
- Import Market Analysis (Import Value, Volume, and Key Supplying Markets)
- Export Market Analysis (Export Value, Volume, and Key Destination Markets)
- Wholesale Price Trend Analysis and Forecast
- Regulatory Framework
- List of Key Players
- Logistics and Infrastructure
- Seasonality Analysis
- China
- Production Analysis (Area Harvested, Yield, and Production Volume)
- Consumption Analysis (Consumption Value and Volume)
- Import Market Analysis (Import Value, Volume, and Key Supplying Markets)
- Export Market Analysis (Export Value, Volume, and Key Destination Markets)
- Wholesale Price Trend Analysis and Forecast
- Regulatory Framework
- List of Key Players
- Logistics and Infrastructure
- Seasonality Analysis
- India
- Production Analysis (Area Harvested, Yield, and Production Volume)
- Consumption Analysis (Consumption Value and Volume)
- Import Market Analysis (Import Value, Volume, and Key Supplying Markets)
- Export Market Analysis (Export Value, Volume, and Key Destination Markets)
- Wholesale Price Trend Analysis and Forecast
- Regulatory Framework
- List of Key Players
- Logistics and Infrastructure
- Seasonality Analysis
- Vietnam
- Production Analysis (Area Harvested, Yield, and Production Volume)
- Consumption Analysis (Consumption Value and Volume)
- Import Market Analysis (Import Value, Volume, and Key Supplying Markets)
- Export Market Analysis (Export Value, Volume, and Key Destination Markets)
- Wholesale Price Trend Analysis and Forecast
- Regulatory Framework
- List of Key Players
- Logistics and Infrastructure
- Seasonality Analysis
- Iran
- South America
- Chile
- Production Analysis (Area Harvested, Yield, and Production Volume)
- Consumption Analysis (Consumption Value and Volume)
- Import Market Analysis (Import Value, Volume, and Key Supplying Markets)
- Export Market Analysis (Export Value, Volume, and Key Destination Markets)
- Wholesale Price Trend Analysis and Forecast
- Regulatory Framework
- List of Key Players
- Logistics and Infrastructure
- Seasonality Analysis
- Argentina
- Production Analysis (Area Harvested, Yield, and Production Volume)
- Consumption Analysis (Consumption Value and Volume)
- Import Market Analysis (Import Value, Volume, and Key Supplying Markets)
- Export Market Analysis (Export Value, Volume, and Key Destination Markets)
- Wholesale Price Trend Analysis and Forecast
- Regulatory Framework
- List of Key Players
- Logistics and Infrastructure
- Seasonality Analysis
- Chile
- Middle East
- Saudi Arabia
- Production Analysis (Area Harvested, Yield, and Production Volume)
- Consumption Analysis (Consumption Value and Volume)
- Import Market Analysis (Import Value, Volume, and Key Supplying Markets)
- Export Market Analysis (Export Value, Volume, and Key Destination Markets)
- Wholesale Price Trend Analysis and Forecast
- Regulatory Framework
- List of Key Players
- Logistics and Infrastructure
- Seasonality Analysis
- Egypt
- Production Analysis (Area Harvested, Yield, and Production Volume)
- Consumption Analysis (Consumption Value and Volume)
- Import Market Analysis (Import Value, Volume, and Key Supplying Markets)
- Export Market Analysis (Export Value, Volume, and Key Destination Markets)
- Wholesale Price Trend Analysis and Forecast
- Regulatory Framework
- List of Key Players
- Logistics and Infrastructure
- Seasonality Analysis
- Saudi Arabia
- Africa
- Morocco
- Production Analysis (Area Harvested, Yield, and Production Volume)
- Consumption Analysis (Consumption Value and Volume)
- Import Market Analysis (Import Value, Volume, and Key Supplying Markets)
- Export Market Analysis (Export Value, Volume, and Key Destination Markets)
- Wholesale Price Trend Analysis and Forecast
- Regulatory Framework
- List of Key Players
- Logistics and Infrastructure
- Seasonality Analysis
- Tunisia
- Production Analysis (Area Harvested, Yield, and Production Volume)
- Consumption Analysis (Consumption Value and Volume)
- Import Market Analysis (Import Value, Volume, and Key Supplying Markets)
- Export Market Analysis (Export Value, Volume, and Key Destination Markets)
- Wholesale Price Trend Analysis and Forecast
- Regulatory Framework
- List of Key Players
- Logistics and Infrastructure
- Seasonality Analysis
- Morocco
- North America
Detailed Research Methodology and Data Validation
Primary Research
Mordor analysts interviewed orchard owners in California and Spain, Asian importers, and European ingredient buyers. The calls clarified contract ASPs, planned replanting, and consumption shifts toward snack packs, letting us adjust desk assumptions and cross-verify shipment volumes.
Desk Research
We began with public datasets that frame supply: USDA-NASS crop reports, Almond Board of California Almanac, FAOSTAT harvest and yield time-series, UN Comtrade customs codes 0802, and International Nut & Dried Fruit Council shipment dashboards. Our team also pulled trade-lane micro-data from Volza, company filings via D&B Hoovers, and press flow on Dow Jones Factiva to spot capacity changes and price swings.
These sources anchor acreage trends, producer margins, export premiums, and retail spreads; however, many others were reviewed to round out pricing, policy, and weather impacts.
Market-Sizing & Forecasting
A top-down harvest-to-value construct links global acreage, weighted yield, shell-out ratio, and average farmgate price, which are then indexed to trade and domestic utilization shares. Supplier roll-ups and channel checks act as a selective bottom-up sense check. Variables such as bearing acreage, non-pareil premium, export share to Asia, per-capita nut intake, and water-use rules feed a multivariate regression with an ARIMA overlay to project demand through 2030. Gaps in country-level data are bridged with peer-country analogs that primary experts endorsed before final sign-off.
Data Validation & Update Cycle
Outputs pass variance scans against historical shocks, price elasticity bands, and independent shipment benchmarks. Another analyst reviews anomalies, and reports refresh yearly, with mid-cycle updates if droughts, tariff moves, or major crop failures arise.
Why Mordor's Almond Baseline Numbers Give Buyers Reliable Confidence
Published almond values often differ.
Divergence usually traces to how firms bundle derivatives, convert currencies, or freeze price years.
Benchmark comparison
| Market Size | Anonymized source | Primary gap driver |
|---|---|---|
| USD 7.10 B (2025) | Mordor Intelligence | - |
| USD 9.92 B (2024) | Regional Consultancy A | Includes almond ingredients and derivative foods, widening scope |
| USD 8.61 B (2025) | Trade Journal B | Uses production value only, omits Asia retail demand |
| USD 8.23 B (2024) | Global Consultancy C | Applies top-down data with 2020 constant prices and no supplier checks |
The comparison shows that once scope creep and outdated pricing are stripped away, Mordor's balanced, variable-linked baseline emerges as the most transparent and repeatable yardstick for strategic planning.
Key Questions Answered in the Report
What is the current value of the almond market worldwide?
The almond market size is USD 8.71 billion in 2026 and is forecast to reach USD 12.33 billion by 2031.
Which region leads global almond production and exports?
North America, anchored by California, accounts for 38.20% of almond market share and exports roughly 70% of its output.
Why are plant-based dairy makers driving almond demand?
Lactose-free and vegan formulations rely on almonds for clean flavor and protein, lifting almond milk and yogurt volumes across Europe and Asia.
How are growers dealing with water scarcity?
Producers adopt deficit irrigation, micro-sprinklers, and invest in salinity-tolerant rootstocks to comply with groundwater caps and sustain yields.
What premium opportunities exist for almond growers?
Carbon-credit payouts for low-water "blue-footer" almonds, high-oleic varieties that lengthen snack shelf life, and sustainability certifications offer added revenue streams.


