
Aliphatic Hydrocarbon Solvents and Thinners Market Size and Share
Market Overview
| Study Period | 2021 - 2031 |
|---|---|
| Market Volume (2026) | 4.07 Million tons |
| Market Volume (2031) | 4.84 Million tons |
| Growth Rate (2026 - 2031) | 3.51 % |
| Fastest Growing Market | Asia Pacific |
| Largest Market | Asia Pacific |
| Market Concentration | Medium |
Major Players *Disclaimer: Major Players sorted in no particular order Image © Mordor Intelligence. Reuse requires attribution under CC BY 4.0. | |
Aliphatic Hydrocarbon Solvents and Thinners Market Analysis by Mordor Intelligence
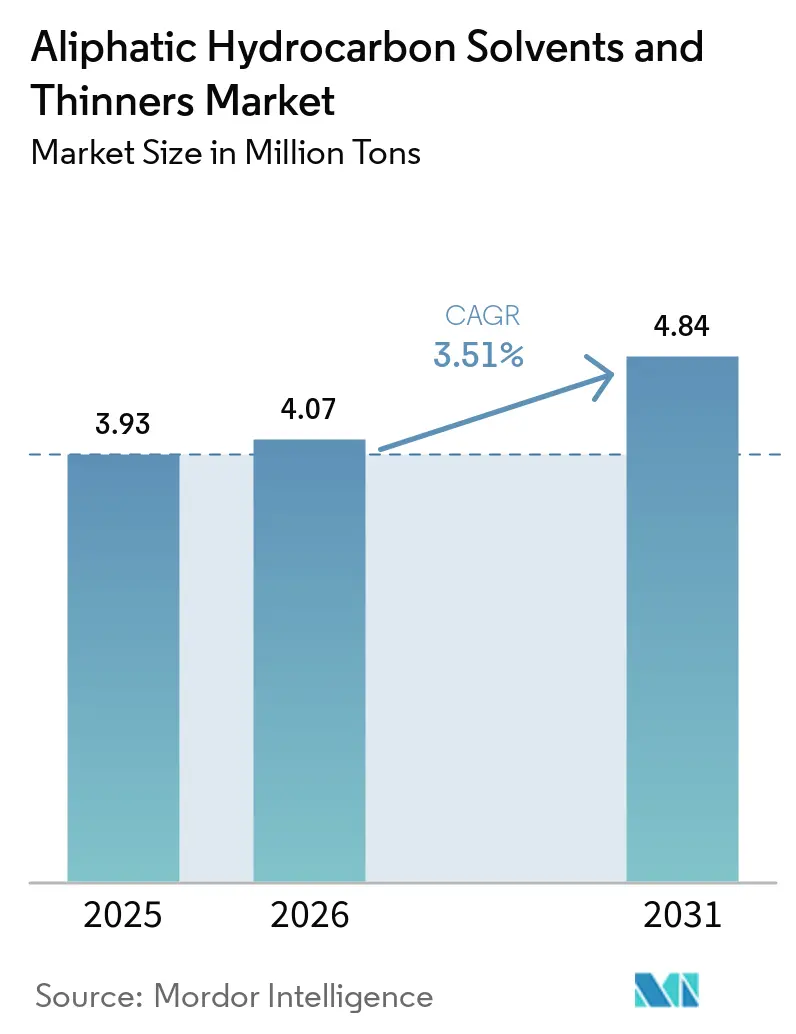
The Aliphatic Hydrocarbon Solvents And Thinners Market size was valued at 3.93 million tons in 2025 and is estimated to grow from 4.07 million tons in 2026 to reach 4.84 million tons by 2031, at a CAGR of 3.51% during the forecast period (2026-2031). Demand progresses in line with repainting cycles, automotive‐refinishing throughput, adhesive‐formulation adjustments, and a measured shift toward lower‐aromatic grades rather than radical technology change. Hexane remains the single largest solvent, anchored by edible-oil extraction and rubber polymerization, while paints and coatings continue to absorb the lion’s share of volume as industrial maintenance cycles outpace new construction. Regulatory initiatives limit aromatics and total VOCs, stimulating preference for C6-C8 paraffins and positioning low-aromatic mineral spirits as substitutes for higher-toxicity aromatics. Feedstock-supply swings driven by naphtha inventories, crude-to-chemicals projects, and refinery operating decisions reward integrated producers with captive refining capacity. Geographic momentum favors Asia-Pacific, where urbanization, infrastructure build-outs, and rapid vehicle‐parc expansion bolster solvent demand ahead of North America and Europe.
Key Report Takeaways
- By solvent type, hexane accounted for 29.30% of the aliphatic hydrocarbon solvents and thinners market share in 2025 and heptane is forecast to post the fastest growth, expanding at a 4.38% CAGR to 2031.
- By application, paints and coatings held 44.14% of the aliphatic hydrocarbon solvents and thinners market size in 2025 and rubber manufacturing is projected to advance at the quickest pace, registering a 4.02% CAGR through 2031.
- By geography, Asia-Pacific led with 41.08% volume share in 2025, while the region is also expected to log the strongest 4.32% CAGR toward 2031.
Note: Market size and forecast figures in this report are generated using Mordor Intelligence’s proprietary estimation framework, updated with the latest available data and insights as of January 2026.
Global Aliphatic Hydrocarbon Solvents and Thinners Market Trends and Insights
Drivers Impact Analysis*
| Driver | (~) % Impact on CAGR Forecast | Geographic Relevance | Impact Timeline |
|---|---|---|---|
| Increasing Application in Paints and Coatings | +1.2% | Global, with concentration in Asia-Pacific and North America | Medium term (2-4 years) |
| Expanding Demand from Adhesives and Sealants | +0.7% | Asia-Pacific core, spill-over to Middle East and Latin America | Long term (≥ 4 years) |
| Growth in Construction Activities Globally | +0.9% | Asia-Pacific, Middle East, selective North American metros | Medium term (2-4 years) |
| Rising Automotive Refinishing Volumes | +0.5% | North America, Europe, emerging in China and India | Short term (≤ 2 years) |
| Shift Toward Low-Aromatic Health-Safer Grades | +0.6% | Europe and North America, gradual adoption in Asia-Pacific | Long term (≥ 4 years) |
| Source: Mordor Intelligence | |||
Increasing Application in Paints and Coatings
Global paint output climbed to 48.3 million tons in 2024, and solvent-borne formulations still represented 38% of that total despite continued water-borne gains. Capacity additions—such as BASF’s 50,000-ton-per-year alkyd-resin line in Shanghai—specifically target OEM primers and metal topcoats that require aliphatic thinners to remain within China’s GB 24409-2020 VOC limits[1]. Maintenance repainting, rather than new construction, increasingly drives tonnage because older assets need higher film-build and multi-coat systems. In India, organized producers lifted manufacturing capacity by 1.2 million liters per day through 2025, translating into incremental solvent demand that supports local suppliers. Yet policy developments, including California’s proposed 2027 limit of 100 g/L VOC in industrial maintenance coatings, foreshadow lower solvent intensity in western U.S. markets. Formulators therefore walk a tightrope: maximize solvency and dry-time performance while staying under tightening VOC ceilings.
Expanding Demand from Adhesives and Sealants
Solvent-based adhesive systems retain niche relevance wherever extended open time, rapid green-strength, and low-temperature application remain mandatory. A hexane-heptane blend released by Henkel in 2024 cut cure time by 30% and lifted laminating line speeds to 325 m/min, illustrating how incremental solvent chemistry advances can unlock throughput gains without new equipment. Rapid parcel growth in Asia-Pacific keeps pressure-sensitive label and tape output rising, thereby sustaining mineral-spirits demand. The Middle East’s USD 2.8 trillion active project pipeline underpins polyurethane-sealant volumes, and each square meter of curtain wall still requires solvent-containing sealant. Although water-borne acrylics nibble at construction segments, solvent formulations continue to dominate demanding façade and expansion-joint jobs where bond reliability outweighs VOC considerations.
Growth in Construction Activities Globally
Asia-Pacific accounted for 45% of worldwide construction spending in 2024, and infrastructure programs, rather than residential real estate, supplied the bulk of new surface-area to coat. India’s National Highways Authority awarded 8,500 km of road contracts in fiscal 2025, consuming road-marking paint dependent on mineral spirits carriers. Saudi Arabia’s NEOM project specified solvent-borne epoxies for steel exposed to Red Sea humidity, proving that extreme environments still favor aliphatic thinners despite low-VOC aspirations. North American renovation spending rose 6.8% in 2024, and repainting requires 2.3 times more paint per square meter than new construction. Consequently, stable solvent demand persists even when housing starts stall.
Rising Automotive Refinishing Volumes
The global vehicle parc touched 1.5 billion units in 2024, with an aging U.S. fleet averaging 12.6 years. North American collision-repair centers processed 18.2 million claims, driving solvent-borne refinish consumption because clearcoats and primers largely remain beyond water-borne capability. In China, luxury-vehicle share reached 14.2%, triggering demand for multi-stage metallic systems that employ heptane thinners for flow and leveling. These dynamics decouple refinishing from new-vehicle sales, making solvent demand resilient through economic cycles.
Restraints Impact Analysis*
| Restraint | (~) % Impact on CAGR Forecast | Geographic Relevance | Impact Timeline |
|---|---|---|---|
| Stringent VOC and Hazardous-Air-Pollutant Regulations | -0.8% | North America and Europe, emerging in China and India | Short term (≤ 2 years) |
| Growing Adoption of Water-Borne and High-Solids Coatings | -0.6% | Global, with fastest penetration in North America and Europe | Medium term (2-4 years) |
| Volatility in Naphtha-Based Feedstock Supply | -0.4% | Global, with acute impact in import-dependent Asia-Pacific markets | Short term (≤ 2 years) |
| Source: Mordor Intelligence | |||
Stringent VOC and Hazardous-Air-Pollutant Regulations
The U.S. EPA slashed VOC limits on architectural finishes to 50 g/L for flat paints and 150 g/L for non-flat coatings in December 2024, cutting solvent loading to roughly 15 wt %[2]. California doubled down, imposing a 10 g/L ceiling on interior flats through SCAQMD Rule 1113, effectively banning solvents in the largest local market. China followed suit with GB 30981.1-2025, capping aromatic content in industrial cleaning solvents at 0.5 wt %. Compliance costs escalate; a mid-sized German paint maker spent USD 2.5 million in 2024 on reformulations alone, underscoring how regulatory stringency erodes demand even where low-aromatic grades offer interim relief.
Growing Adoption of Water-Borne and High-Solids Coatings
Water-borne architectural coatings captured 62% of North American volume in 2025 as major producers resigned solvent lines to meet odor and VOC expectations. High-solids technology offers another pathway by boosting non-volatile content above 70 wt %, evidenced by PPG’s Delfleet Evolution truck coating that cut solvent usage 40% per vehicle while meeting 250 g/L VOC. Yet conversion is capital intensive; retrofitting a 50-million-L plant may require USD 25 million in new dispersion, pH-control, and effluent systems—hurdles smaller regional players struggle to overcome. Performance gaps linger in chemical-resistant spaces, preserving a floor for solvent demand, but the trajectory clearly shifts away from traditional mineral spirits in mass-market interior paints.
*Our forecasts treat driver/restraint impacts as directional, not additive. The impact forecasts reflect baseline growth, mix effects, and variable interactions.
Segment Analysis
By Solvent Type: Hexane Strength Persists Amid Heptane Upside
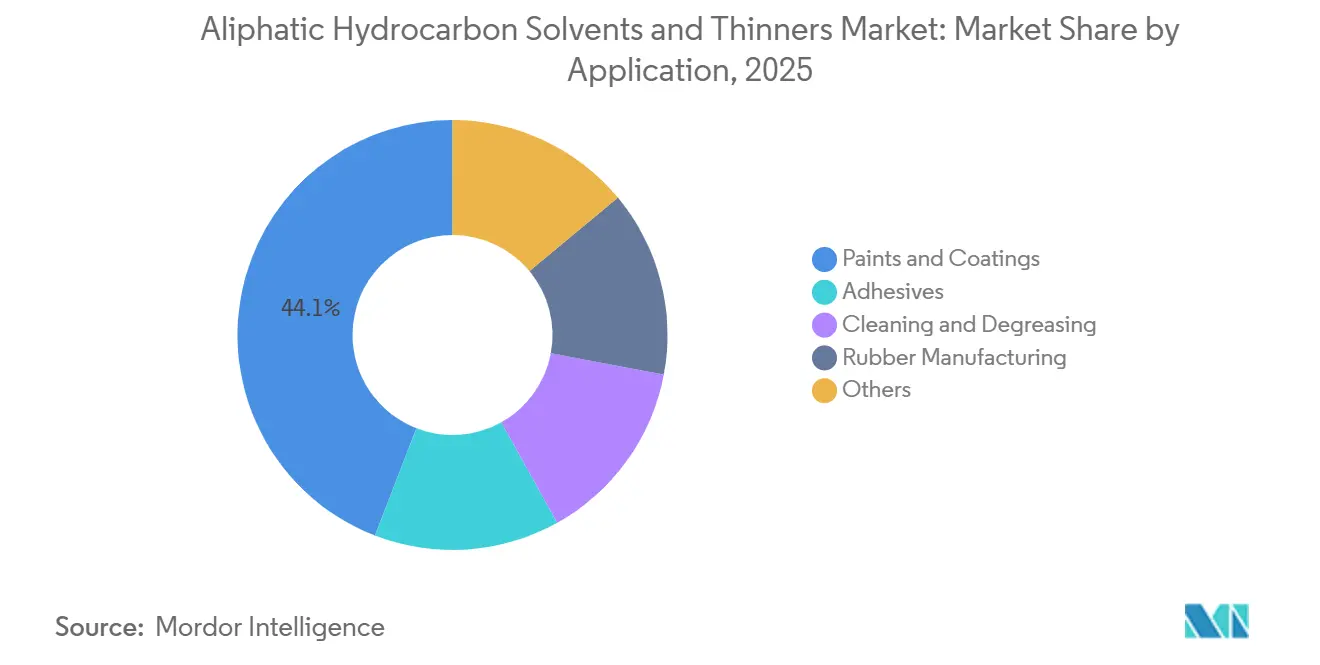
Hexane commanded 29.30% of the aliphatic hydrocarbon solvents and thinners market in 2025, owing to its indispensability in oilseed extraction and synthetic-rubber workflows. Global usage in edible-oil processing reached 1.18 million tons in 2024 following capacity additions across Brazil, Argentina, and the U.S. Midwest. Heptane, while smaller, is forecast to post the fastest 4.38% CAGR through 2031 because pharmaceutical synthesis values its higher flash point and lower toxicity. Mineral spirits remain the workhorse of paint thinning and industrial cleaning but must absorb incremental hydrotreatment costs to comply with Europe’s ultra-low-aromatic thresholds. Gasoline’s share continues to slide as occupational-safety rules favor higher-flash-point alternatives. Specialty blends, including VM&P naphtha and odorless variants, supply niche printing-ink and aerosol-propellant segments, adding diversity but limited incremental growth.
Mineral-spirits suppliers pursue differentiation via purity. ShellSol D60’s aromatic content below 1 wt % achieved 18% penetration in European industrial cleaning in 2024. ExxonMobil’s Baytown retrofit underscores the drive to cut naphthalene content under 10 ppm, opening pharmaceutical and food-contact markets. As solvent-quality specifications tighten, players with hydrotreating assets can command premiums, keeping this segment profitable despite volume headwinds.
By Application: Paints and Coatings Dominate, Rubber Manufacturing Accelerates
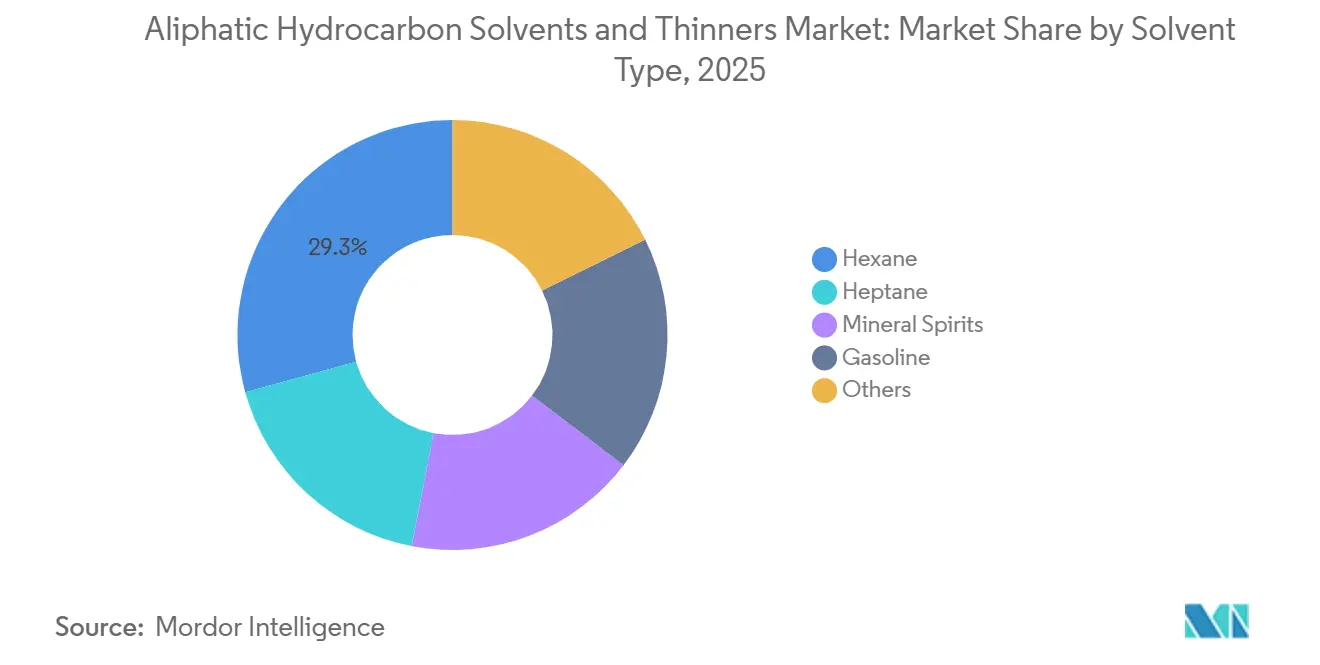
Paints and coatings absorbed 44.14% of demand in 2025, and the aliphatic hydrocarbon solvents and thinners market size linked to the category will continue expanding on maintenance cycles even as water-borne systems encroach. Industrial‐maintenance coatings, comprising nearly 28% of segment volume, rely on aliphatic thinners for single-coat 40-60 μm film thickness that water-borne products cannot duplicate. Rubber manufacturing, buoyed by Asia-Pacific tire production exceeding 2.1 billion units in 2024, will rise at a 4.02% CAGR, driven by solution-styrene-butadiene production that consumes hexane as the polymerization medium. Adhesives and sealants grow steadily as flexible packaging proliferation and automotive interiors need balanced open time and bond strength profiles that solvent systems still deliver. Solvent cleaning steadily declines outside aerospace and precision machining, where residue-free finishing remains essential.
Looking forward, formulators must balance performance, cost, and compliance. Water-borne penetration will continue, but high-solids and exempt-solvent blends are likely to maintain a solvent baseline in heavy-duty applications. Rubber manufacturing stands out for solvent resilience, underpinned by polymer-grade purity requirements that aqueous alternatives cannot meet at scale.
Geography Analysis
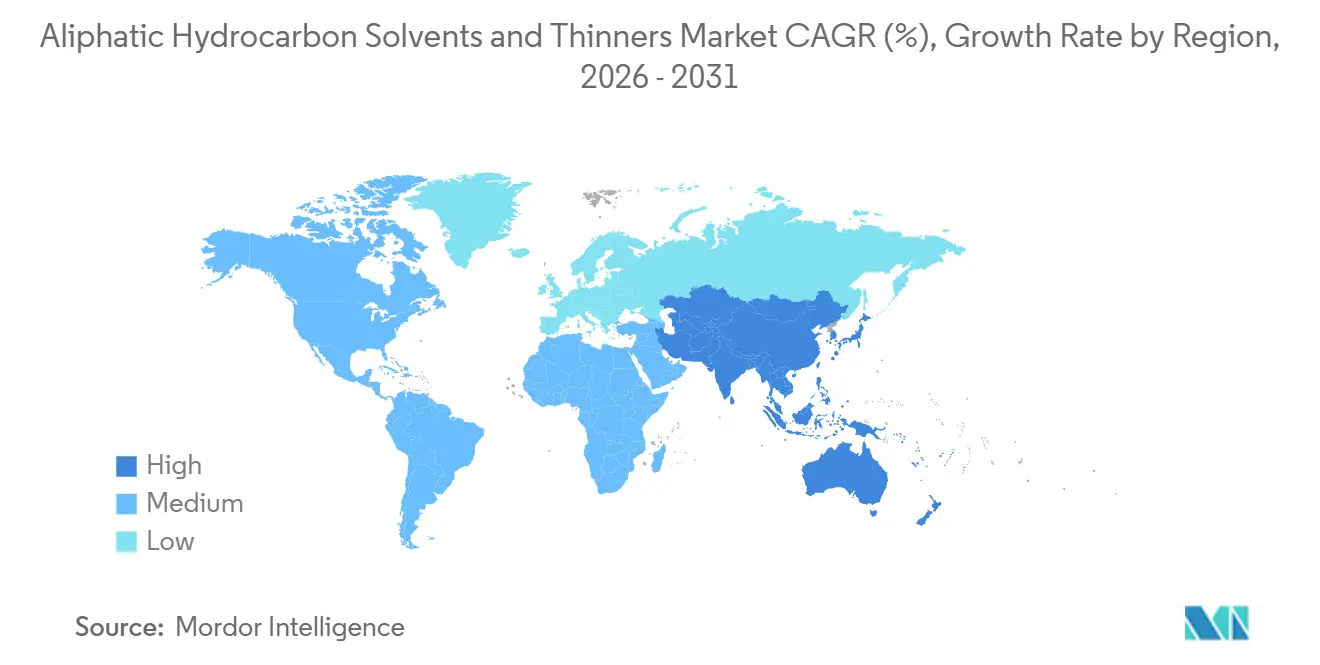
Asia-Pacific accounted for 41.08% of 2025 volume, and the aliphatic hydrocarbon solvents and thinners market in the region is projected to post a 4.32% CAGR through 2031. China leads on urban facade repainting and industrial infrastructure, generating steady offtake. India’s 5.9 million vehicle output plus ongoing road‐building propel solvent demand, and organized paint capacity expansions promise downstream pull. Mature markets Japan and South Korea grow modestly on automotive refinishing, while ASEAN members register mid-single-digit gains tied to electronics assembly and construction.
North America’s share masks diverging patterns. The United States uses solvent-borne paints mainly in exterior wood, high-gloss, and specialty primers, but Step-change VOC rules steadily erode per-liter solvent intensity. Canada leverages colder climates that favor solvent-borne curing. Mexico gains from automotive nearshoring and maintains stricter fire-code allowances for mineral-spirits cleaning.
Europe faces the toughest VOC regimes. Germany’s usage slipped as automotive lines switched to water-borne basecoats. The United Kingdom preserved demand in marine and offshore protective coatings. Nordic countries defend mineral-spirits wood-finishing traditions, while Eastern Europe remains a pocket of growth where regulatory alignment lags. Russia grew on local refining and import-substitution policies.
South America is dominated by Brazil, tied to construction and vehicle refinishing. Argentina’s contraction was mitigated by lithium-brine extraction, which employs hexane for lithium chloride separation. The Middle East and Africa combined delivered substantial growth, led by Saudi Arabia’s megaprojects and South Africa’s aging vehicle parc requiring solvent-rich refinish systems.
Regulatory Landscape
VOC reduction remains the primary regulatory lever shaping aliphatic hydrocarbon solvent and thinner use in paints, coatings, and consumer solvent products. In the United States, the EPA finalized amendments for national VOC emission standards for aerosol coatings (40 CFR Part 59). In June 2025, it issued an interim final rule extending the compliance deadline from July 17, 2025 to January 17, 2027, giving formulators and suppliers time to align to adjusted reactivity factors and limits.
In Europe, eco-labeling and REACH compliance increasingly influence solvent selection and documentation. The European Commission adopted Commission Decision (EU) 2025/2607 (December 2025), updating EU Ecolabel criteria for paints and varnishes and related coating categories and tightening VOC/SVOC-related requirements through 31 December 2032. Separately, ECHA added n-hexane (CAS 110-54-3) to the SVHC Candidate List on 4 February 2026 (Article 57(f), neurotoxicity), raising downstream communication obligations for supply chains using hexane-heavy formulations, particularly where food processing and rubber manufacturing purity requirements intersect with EU chemical disclosure duties.
Value Chain Analysis
The value chain begins with crude oil and naphtha streams and runs through integrated refineries and petrochemical complexes that hydrotreat and fractionate into C6-C8 paraffins (including hexane and heptane), mineral spirits, and specialty low-aromatic cuts. Producers with captive refining and hydrotreating assets supply bulk volumes, while merchant blenders tailor boiling range, aromatic content, and odor profiles to meet application needs in paints and coatings, adhesives, rubber manufacturing, and cleaning and degreasing. As VOC and broader chemical-management rules tighten, quality control (aromatics, sulfur, and trace impurities) and batch certification have gained practical importance for downstream buyers.
Distribution typically flows from producers to chemical distributors and then to paint/coatings and industrial end users, with packaging, storage, and transport governed by flammability and occupational exposure requirements. In Europe, industry bodies such as ESIG and ESVOC support harmonized compliance and data tools that help participants document environmental profiles and safe use. On the demand side, regional rulemaking directly affects product availability and formulation in consumer-facing thinner channels, including South Coast AQMDs June 17, 2026 working group activity on Proposed Amended Rule 1143 covering consumer paint thinners and multi-purpose solvents, which can support shifts toward lower-VOC, higher-flash-point, and lower-aromatic solvent grades in regulated local markets.
Competitive Landscape
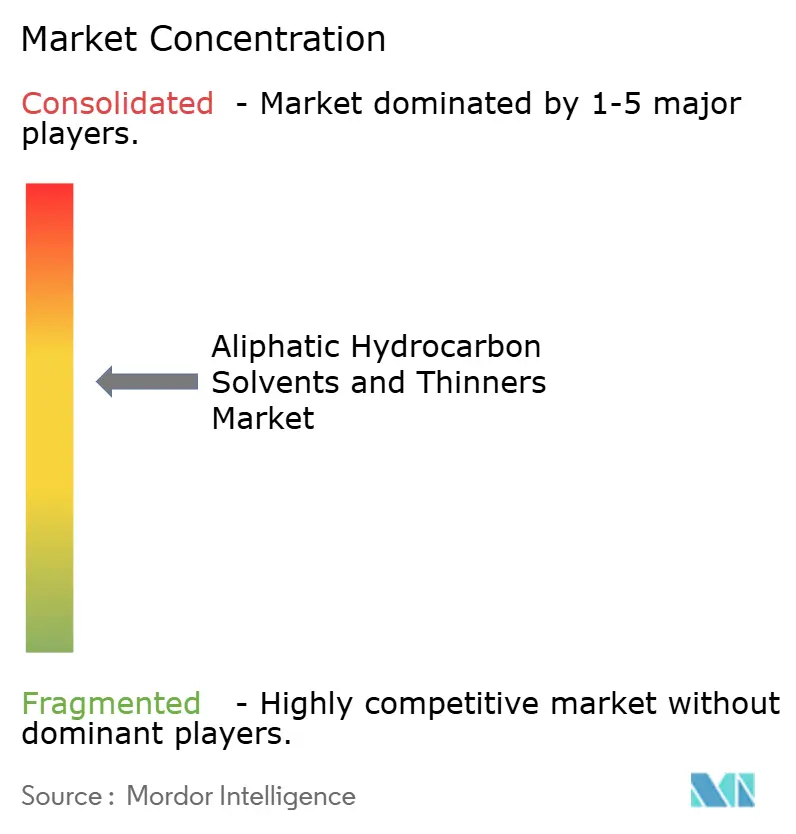
The aliphatic hydrocarbon solvents and thinners market features moderate concentration. Integrated players—BASF, ExxonMobil, Shell, TotalEnergies, and Chevron Phillips—collectively held 38% global share in 2025, backed by captive naphtha supply and multi-site logistics. Shell’s Pernis and ExxonMobil’s Baytown complexes each top 200,000 t/y of aliphatic capacity, capturing economies of scale and hydro-processing synergies that push cash costs under USD 420 per ton. BASF’s 35,000 t/y ultra-low-aromatic line in Shanghai addresses high-purity niches willing to pay 15-20% premiums.
Strategic moves highlight low-aromatic expansion and bio-feed integration. Shell’s 2025 arrangement with Neste will redirect 50,000 t/y of HVO-based naphtha into solvent production, offering customers a 60-70% greenhouse-gas reduction. Smaller regional suppliers—Gandhar Oil Refinery in India and SK geocentric in South Korea—compete on lead time, flexible packaging, and localized technical service. Technology differentiation remains incremental, focusing on additive packages that lower odor and improve storage stability like Honeywell’s Hydrofluor line that doubles shelf life in steel drums.
The aliphatic hydrocarbon solvents and thinners industry maintains price discipline through feedstock linkage; however, merchant blenders without refining integration remain exposed to naphtha volatility, reinforcing gradual consolidation as scale economies widen.
Aliphatic Hydrocarbon Solvents and Thinners Industry Leaders
-
Exxon Mobil Corporation
-
Shell plc
-
BASF
-
Chevron Phillips Chemical Company LLC
-
TotalEnergies
- *Disclaimer: Major Players sorted in no particular order
Market Opportunities and Future Outlook
A key whitespace sits in low-aromatic and high-purity aliphatic cuts that help formulators stay compliant while preserving solvency and drying performance in industrial maintenance coatings, automotive refinish, and demanding adhesive niches. Regulatory programs provide the immediate proof points: the EU Ecolabel update under Commission Decision (EU) 2025/2607 (adopted December 2025, valid through 31 December 2032) and tightening VOC frameworks in major markets raise the value of documented, low-VOC/SVOC-compatible solvent options, favoring product lines positioned by boiling range and aromatic content consistency rather than broad commodity mineral spirits.
An additional opportunity area is compliance-led product stewardship and supply-chain transparency for UVCB solvent families, where classification by carbon number and aromatic content (as used in standardized industry categories referenced by ESIG) can become a purchasing requirement in regulated end uses. ECHAs February 4, 2026 SVHC Candidate List addition of n-hexane increases documentation and customer communication needs across segments where hexane remains a core solvent, reinforcing demand for traceable sourcing, impurity control, and clearly specified substitutes, such as higher-flash-point aliphatic fractions, where customers seek to reduce regulatory friction without fully redesigning solvent-borne systems.
Recent Industry Developments
- June 2026: South Coast AQMD held a working group meeting on Proposed Amended Rule 1143 covering consumer paint thinners and multi-purpose solvents. The activity signals continued tightening of VOC-related requirements at a major US air district, influencing which aliphatic thinner grades can remain in retail and small-pack channels. This elevates the role of compliant low-VOC formulations and can shift distributor and blender portfolios toward higher-flash-point, lower-aromatic options.
- December 2025: The European Commission adopted Commission Decision (EU) 2025/2607 updating EU Ecolabel criteria for paints, varnishes, and related coating categories through 31 December 2032. The revised criteria reinforce lower VOC/SVOC thresholds as a market access lever for decorative and performance coatings. Solvent and thinner suppliers supporting EU-facing formulators face stronger demand for documented low-aromatic, low-odor fractions aligned to ecolabel procurement.
- December 2024: The US EPA finalized tighter national VOC limits for architectural coatings, reducing allowable solvent loading in common paint categories. The rule accelerated reformulation activity among paint makers and their solvent suppliers, particularly for flat and non-flat coatings where compliance is heavily VOC-driven. As a result, demand patterns have shifted toward lower-aromatic aliphatic grades and other pathways that maintain application performance under stricter VOC ceilings.
Research Methodology Framework and Report Scope
Market Definition and Coverage
This market covers petroleum-derived aliphatic hydrocarbon solvents and thinners that are used primarily to dilute, clean, degrease, and support formulation performance across industrial and commercial applications.
Scope exclusions: Oxygenated solvents and aromatic solvent families are excluded, and we also exclude downstream formulated products where the solvent is only one ingredient.
Segmentation Overview
- By Solvent Type
- Hexane
- Heptane
- Mineral Spirits
- Gasoline
- Others
- By Application
- Paints and Coatings
- Adhesives
- Cleaning and Degreasing
- Rubber Manufacturing
- Others
- By Geography
- Asia-Pacific
- China
- India
- Japan
- South Korea
- ASEAN Countries
- Rest of Asia-Pacific
- North America
- United States
- Canada
- Mexico
- Europe
- Germany
- United Kingdom
- France
- Italy
- NORDIC Countries
- Rest of Europe
- South America
- Brazil
- Argentina
- Rest of South America
- Middle-East and Africa
- Saudi Arabia
- South Africa
- Rest of Middle-East and Africa
- Asia-Pacific
Data Sources, Market Sizing, and Validation
Desk Research
Desk work starts by building a consistent view of supply availability, trade movement, and demand pull from major end uses. For trade flows, we refer to public sources such as UN Comtrade. For hydrocarbon and refinery context, we use the US Geological Survey. For VOC-related rules that influence solvent substitution and demand, we review the US EPA. For regulatory signals and chemical classification, we also use the European Chemicals Agency. In parallel, we review technical publications and peer-reviewed journals on evaporation rates, safety handling, and substitution trends for commonly discussed aliphatic grades.
To keep the market numbers grounded, we cross-check producer and downstream user disclosures such as annual reports, investor presentations, and product technical data sheets, which help clarify grade mix and typical use cases. When needed, paid subscriptions for company financials and intelligence, patent databases, and shipment-level import and export data are used to confirm capacity announcements and trade directions. This list is not exhaustive, and other public and subscription sources were also used for data collection, validation, and clarification.
Primary Interviews and Surveys
Primary work is used to pressure-test what we see in public data, especially on where volume is actually going by application and how pricing and grade preferences are shifting. We speak with stakeholders across the value chain, including producers, distributors, formulators, and large industrial users, and then we validate key assumptions across APAC, EMEA, and the Americas so differences in regional grade availability and usage do not get averaged out.
Distribution of primary research fieldwork respondents
| Company type | Respondent position | Region |
|---|---|---|
| Top tier: 30% | CXOs: 17% | APAC: 41% |
| Mid tier: 52% | Functional/Unit leaders: 31% | EMEA: 34% |
| Smaller Players: 18% | Managers: 52% | Americas: 25% |
Market-Sizing & Forecasting
Sizing is built using top-down reconstruction where production, refinery output indicators, and import and export trends are mapped to the demand pool for key solvent-using applications, then adjusted for visible substitution patterns. To keep the totals realistic, we also run selective bottom-up checks using sampled supplier revenue splits, channel checks on typical grade mix, and simple volume times average price calculations in a few anchor countries.
Inputs used in the model include paint and coatings output indicators, construction activity signals, automotive refinish and maintenance demand proxies, industrial cleaning intensity, and refinery feedstock and margin cycles that influence solvent availability and pricing. Since this market is volume-led but pricing can swing with oil-linked inputs, we build an average selling price pathway by grade and region using a mix of public price references and interview feedback. Forecasting is then carried using scenario analysis supported by variable-level expectations from industry experts, so shocks such as VOC tightening or sudden feedstock constraints can be represented without forcing an overfit curve. Where bottom-up information is missing for smaller countries, proxy ratios are applied from similar markets and then reviewed during validation.
Data Validation & Update Cycle
Validation is done through repeated cross-checks across demand signals, trade flows, and the implied consumption that falls out of the model. When a region shows a jump that does not align with paint demand, refinery context, or trade direction, the assumptions are revisited and respondents are re-contacted to confirm what changed. Before sign-off, outputs go through multi-step analyst reviews that check unit consistency, year-over-year variance, and any potential double counting across applications.
The report is refreshed annually, and interim updates are made when there are material events such as major capacity changes, trade disruptions, or meaningful regulatory shifts affecting solvent usage. Right before delivery, we run a final pass to incorporate the latest public releases and ensure clients receive the most current view.
Mordor Intelligence's Aliphatic Hydrocarbon Solvents and Thinners Market Size Measured Against Other Published Estimates
Published market sizes for this space can look far apart because some sources size it in revenue terms, others size it in tons, and many do not treat thinners and solvent grades in the same way. The base year, currency conversion timing, and how refinery-linked price swings are handled also change the reported value.
Key gap drivers usually come down to whether adjacent solvent families are mixed in, whether distribution margins are included in the priced value, and whether the model assumes a fast shift toward lower-aromatic grades in coatings and cleaning. Differences also show up when one estimate uses a single global average price, while another applies region-level prices that track feedstock cycles and end-use mix.
Benchmark comparison
| Source | Market Size | Gaps in Research Methodology |
|---|---|---|
| Mordor Intelligence | USD 4.07 M (2026) | |
| Industry Data Provider A | USD 4.05 B (2024) | Uses a value-based total and a different base year, and it appears to include a wider set of labeled naphtha and specialty paraffinic types that can extend beyond the narrower thinner-use pool in some countries. |
| Market Platform B | USD 4.65 B (2025) | Relies on a higher growth and price progression path, and it aggregates multiple end-use channels where distributor and online channel markups may be captured differently from a manufacturer-level pricing view. |
The table mainly shows a unit mismatch and a scope mismatch, and in Mordor Intelligence's model the core market is kept as aliphatic hydrocarbon solvent and thinner demand measured in tons, which is then validated against application pull signals before any value translation is attempted. When scope and unit are aligned first and then checked against trade and end-use indicators, the resulting number becomes easier to trace and repeat for updates.
Key Questions Answered in the Report
What is the size of the aliphatic hydrocarbon solvents and thinners market?
The Aliphatic Hydrocarbon Solvents And Thinners Market size was valued at 3.93 million tons in 2025 and is estimated to grow from 4.07 million tons in 2026 to reach 4.84 million tons by 2031, at a CAGR of 3.51% during the forecast period (2026-2031).
Which solvent type holds the largest share?
Hexane leads with 29.30% of global volume in 2025, thanks to its role in edible-oil extraction and rubber polymerization.
Which region is growing fastest?
Asia-Pacific combines the largest 41.08% share in 2025 with a 4.32% forecast CAGR through 2031.
How are VOC regulations affecting demand?
Stricter VOC caps in the United States, Europe, and China are reducing solvent loading in coatings and encouraging low-aromatic grades.