
Alcohol Ethoxylates Market Size and Share
Market Overview
| Study Period | 2021 - 2031 |
|---|---|
| Market Volume (2026) | 3.61 Million tons |
| Market Volume (2031) | 4.32 Million tons |
| Growth Rate (2026 - 2031) | 3.66 % |
| Fastest Growing Market | Asia Pacific |
| Largest Market | Asia Pacific |
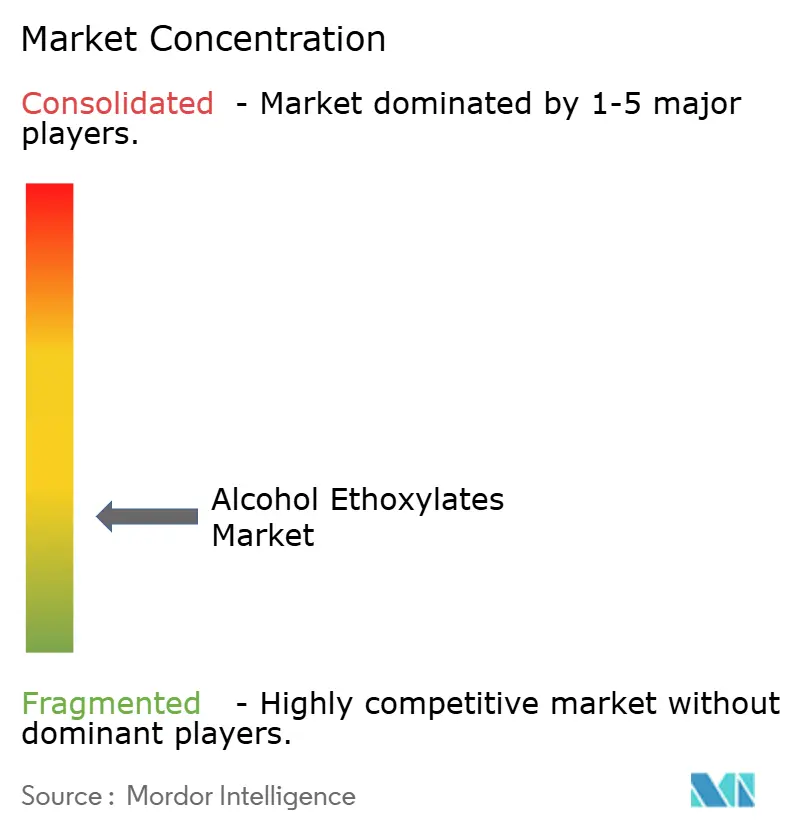
| Market Concentration | Low |
Major Players *Disclaimer: Major Players sorted in no particular order Image © Mordor Intelligence. Reuse requires attribution under CC BY 4.0. | |
Alcohol Ethoxylates Market Analysis by Mordor Intelligence
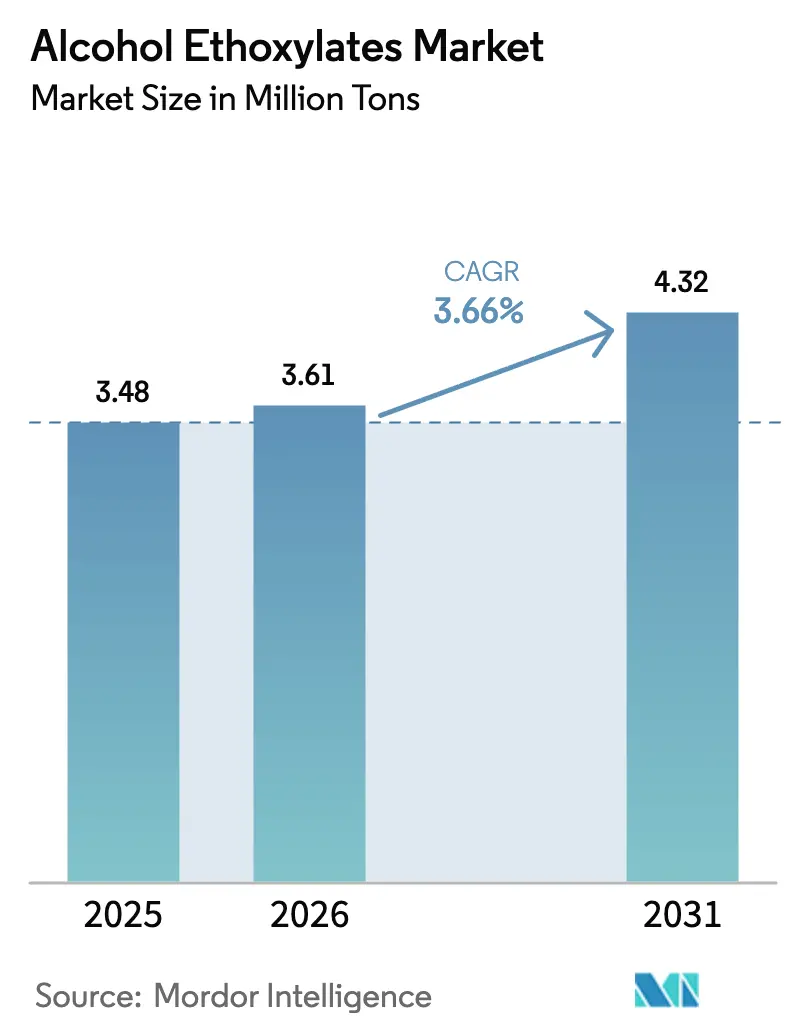
The Alcohol Ethoxylates Market size is projected to expand from 3.48 million tons in 2025 and 3.61 million tons in 2026 to 4.32 million tons by 2031, registering a CAGR of 3.66% between 2026 to 2031. Oleochemical feedstocks, RSPO-certified supply chains, and corporate renewable-carbon pledges are accelerating the pivot away from petrochemical routes, while tightening eco-toxicity rules in North America and Europe are steering formulators toward biodegradable nonionic surfactants that align with green-label programs. Brand owners are prioritizing ultra-mild detergency in personal-care and institutional-cleaning products, which supports premium pricing for narrow-range grades even when feedstock costs spike. Rapid build-outs of integrated ethylene-oxide and alkoxylation plants in China, India, and Saudi Arabia are squeezing merchant margins, yet the regionally balanced demand profile sustains long-term volume growth opportunities for both bulk and specialty producers. Competitive strategies now revolve around backward integration into fatty-alcohol production, enzyme-catalyzed process technology, and mass-balance certification that enables incremental sustainability claims without a full oleochemical cost premium.
Key Report Takeaways
- By origin type, oleochemical grades held 58.32% of the alcohol ethoxylates market share in 2025 and are expanding at a 3.97% CAGR to 2031.
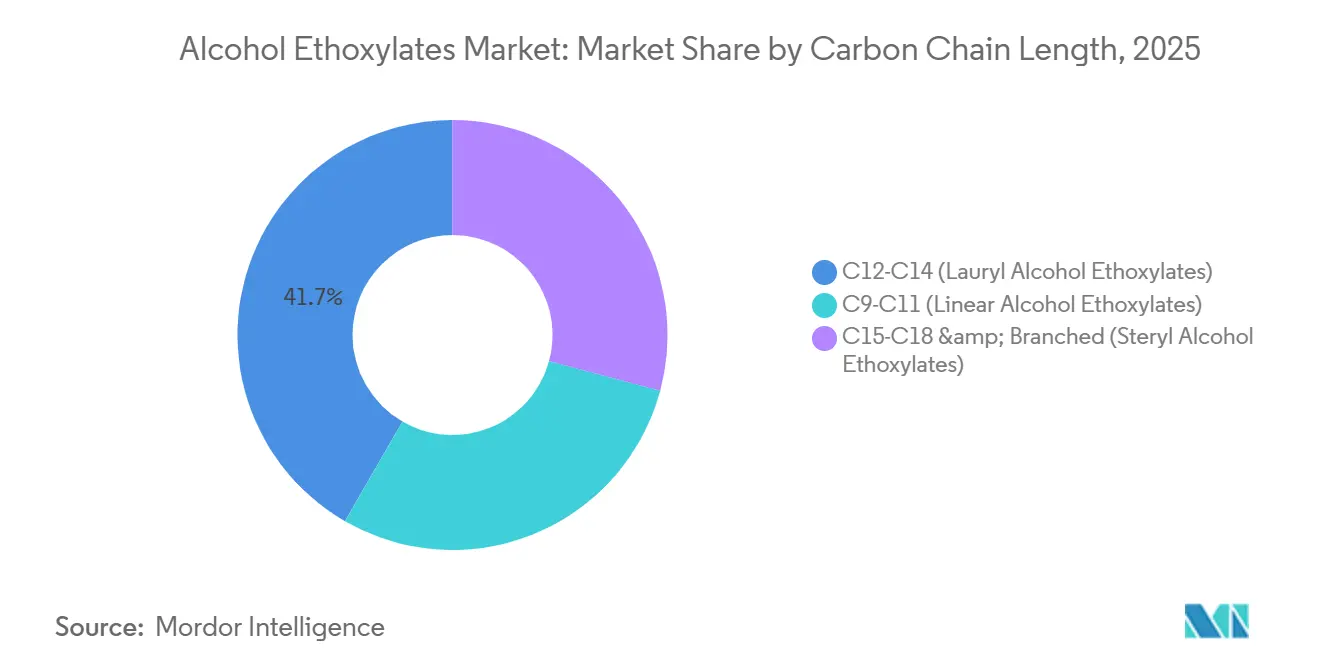
- By carbon chain length, C12-C14 grades captured 41.66% revenue share in 2025; the same segment is forecast to grow at a 4.12% CAGR through 2031.
- By form, liquid products accounted for 62.93% of the alcohol ethoxylates market size in 2025 and are advancing at a 4.35% CAGR to 2031.
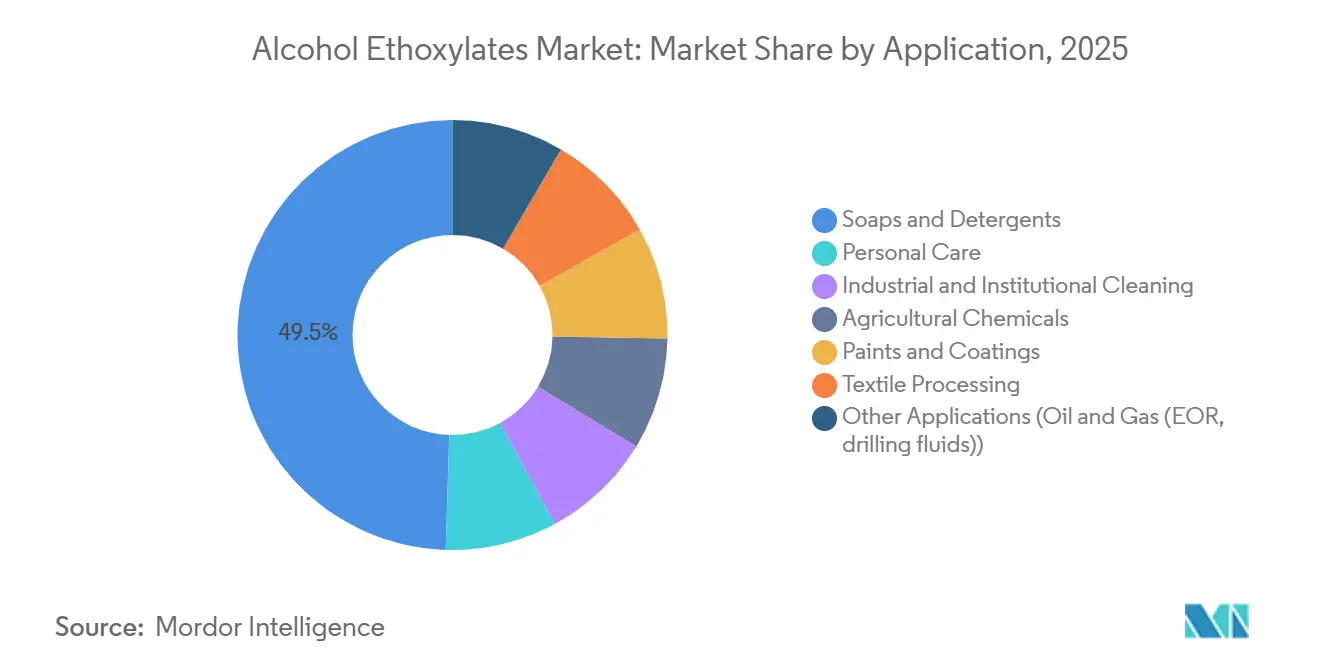
- By application, soaps and detergents led with 49.51% share of the alcohol ethoxylates market size in 2025, while personal-care recorded the highest projected CAGR at 4.42% through 2031.
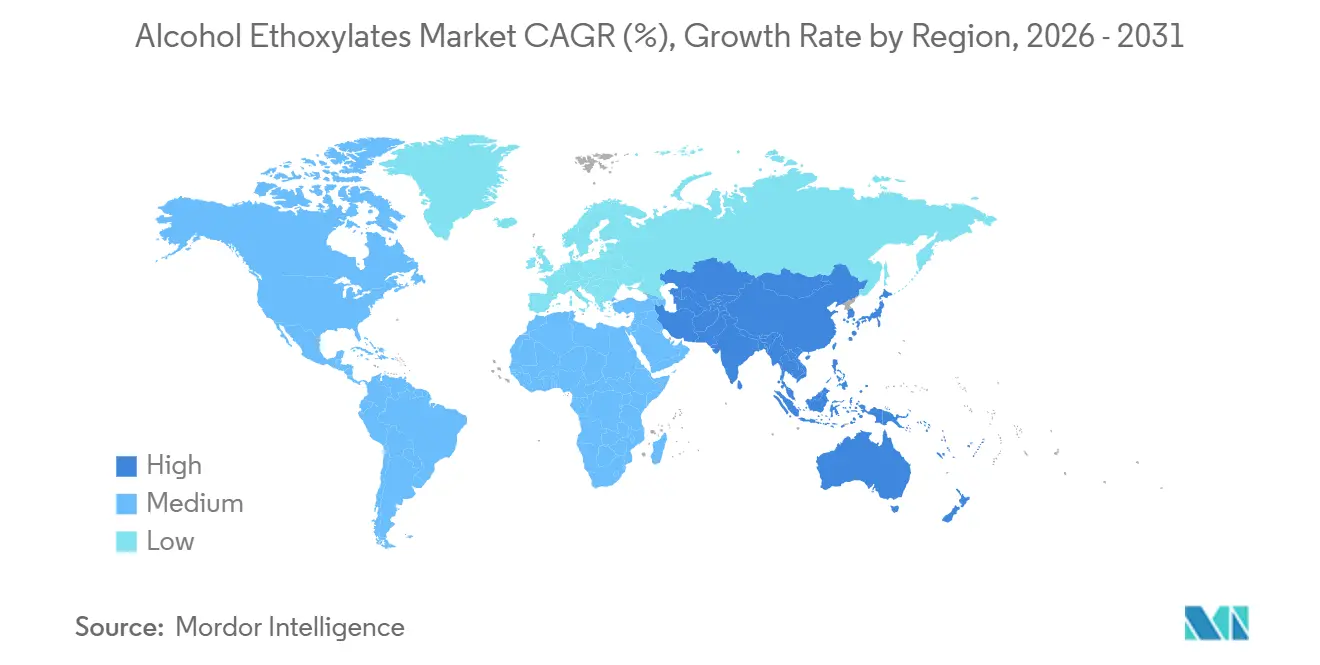
- By geography, Asia-Pacific accounted for 52.34% of the alcohol ethoxylates market size in 2025 and is growing with the fastest CAGR of 4.82% through 2031.
Note: Market size and forecast figures in this report are generated using Mordor Intelligence’s proprietary estimation framework, updated with the latest available data and insights as of January 2026.
Market Trends and Insights
Drivers Impact Analysis of Alcohol Ethoxylates Market*
| Drivers | (~) % Impact on CAGR Forecast | Geographic Relevance | Impact Timeline |
|---|---|---|---|
| Surging personal- and home-care demand across Asia-Pacific | +1.2% | Asia-Pacific core, spill-over to Middle East and Africa | Medium term (2-4 years) |
| Expanding industrial and institutional cleaning formulations | +0.9% | North America and Europe, emerging in ASEAN | Short term (≤ 2 years) |
| Growing agrochemical use as sustainable adjuvants | +0.6% | Global, with concentration in North America, Brazil, India | Long term (≥ 4 years) |
| Rapid build-out of dedicated EO/alkoxylation capacity | +0.7% | Asia-Pacific (China, India, Thailand), Middle East | Medium term (2-4 years) |
| Shift to enzyme-catalyzed, bio-based ethoxylation processes | +0.4% | Europe and North America, pilot scale in Asia | Long term (≥ 4 years) |
| Source: Mordor Intelligence | |||
Surging Personal- and Home-Care Demand Across Asia-Pacific
Urbanization, rising disposable incomes, and government-sponsored sanitation programs in China, India, and ASEAN economies are lifting per-capita consumption of liquid detergents, fabric softeners, and rinse-off personal-care products that rely on alcohol ethoxylates for mildness, foam control, and cold-water detergency. China’s tier-2 and tier-3 cities are replacing bar soap with liquid handwash at a mid-single-digit annual pace, while India’s rural detergent penetration sits below 50%, providing a multiyear runway as e-commerce and direct-to-consumer logistics expand access. Clean-beauty brands across the region are quickly swapping sulfated anionics for C12-C14 alcohol ethoxylates that deliver comparable lather with lower skin irritation, mirroring Western reformulation patterns but accelerating through social-media influence. The preference for RSPO-certified, palm-kernel-based lauryl alcohol streamlines supply chains and shortens lead times compared with petrochemical alternatives, locking in regional feedstock advantages. As demand concentrates in liquids and single-dose pods, premium formulations maintain pricing power even when feedstock volatility compresses merchant margins.
Expanding Industrial and Institutional Cleaning Formulations
Healthcare facilities, food-service operators, and hospitality chains are tightening hygiene protocols to comply with post-pandemic standards and green-building certifications, driving adoption of low-foaming alcohol ethoxylates in automated scrubbers and central dosing systems. U.S. EPA Safer Choice and EU Ecolabel criteria reward readily biodegradable nonionics, triggering a shift from alkylphenol ethoxylates to linear grades that meet OECD 301 benchmarks. Institutional buyers value performance consistency across variable water hardness, enabling formulators to absorb feedstock swings and preserve margin, a resilience not always feasible in price-sensitive consumer detergents. Concentrated cleaning capsules typically contain 10-15% alcohol ethoxylates by weight, letting distributors reduce packaging waste in line with corporate ESG mandates. The growing network of third-party-certified suppliers consolidates procurement, further entrenching linear alcohol ethoxylates as the default workhorse surfactant in the institutional channel.
Growing Agrochemical Use as Sustainable Adjuvants
Regulators in the United States, European Union, and Brazil are tightening maximum-residue limits on crop-protection actives, spurring herbicide and insecticide formulators to incorporate alcohol ethoxylates that improve spray retention and canopy penetration, lowering active-ingredient loading without compromising efficacy[1]U.S. EPA, “Pesticide Registration Manual,” epa.gov. C9-C11 and C12-C14 grades with 8-12 ethylene-oxide units balance wetting, emulsification, and low phytotoxicity, meeting new ecotoxicity thresholds that nonylphenol ethoxylates can no longer satisfy. Brazil’s soybean and sugarcane sectors adopt domestic, oleochemical-derived adjuvants from Oxiteno to meet export sustainability criteria, while U.S. and Indian growers retrofit tank-mix regimes for lower chemical usage. Long formulation approval cycles lock in alcohol ethoxylates for 3-5 years, giving producers a stable, counter-cyclical revenue stream that offsets detergent seasonality. As climate variability heightens pest pressure, demand for high-efficacy adjuvants strengthens through 2031.
Rapid Build-Out of Dedicated EO/Alkoxylation Capacity
Integrated petrochemical and oleochemical players commissioned more than 400,000 tons of new ethoxylation capacity between 2024 and 2025, with BASF’s Zhanjiang unit, Stepan’s Pasadena expansion, Evonik’s Singapore and Shanghai projects, and Sasol’s Nanjing facility anchoring the wave[2]BASF, “Press Release—Zhanjiang Verbund Site Update 2024,” basf.com. Captive ethylene-oxide supply lowers variable cost, allowing regional champions to squeeze merchant tollers on standard grades. Spot prices for C12-C14 liquid alcohol ethoxylates dipped 4% in early 2026 as Chinese producers ramped up utilization, pressuring high-cost European plants to differentiate via enzyme-catalyzed narrow-range products. Middle-East players leverage advantaged gas-based ethylene to supply Africa and South Asia, eroding freight-cost protection historically enjoyed by Southeast-Asian exporters. Additional capacity also intensifies feedstock competition, prompting fatty-alcohol refiners to lock multi-quarter contracts with ethoxylators to secure throughput in volatile palm-oil cycles.
Restraints Impact Analysis of Alcohol Ethoxylates Market*
| Restraints | (~) % Impact on CAGR Forecast | Geographic Relevance | Impact Timeline |
|---|---|---|---|
| Feedstock (ethylene oxide and fatty alcohol) price volatility | -0.8% | Global, acute in Asia-Pacific and Europe | Short term (≤ 2 years) |
| Tightening eco-toxicity regulations on ethoxylates/NPEs | -0.5% | North America, Europe, and emerging in Asia-Pacific | Medium term (2-4 years) |
| Competition from bio-based alternative surfactants | -0.8% | North America, Europe, and Asia-Pacific | Long term (≥ 4 years) |
| Source: Mordor Intelligence | |||
Feedstock Price Volatility
Unplanned cracker outages drove U.S. Gulf Coast ethylene-oxide spot prices up 30% in December 2024, while Malaysian flooding and Indonesian export quotas lifted fatty-alcohol prices 25% month-on-month, creating a margin vice for ethoxylators without upstream integration. European and North American tollers face dual exposure: imported C12-C14 feedstocks from Southeast Asia and regional ethylene-oxide supply subject to energy-price shocks. Multi-quarter supply contracts hedge risk but tie up working capital, limiting flexibility for specialty-grade development. Vertically integrated players such as SABIC, Shell, and Sasol exploit their feedstock control to undercut independents and capture share, accelerating industry consolidation. Persistent volatility also nudges formulators toward alternative surfactants like alkyl polyglucosides when budget certainty outranks performance differentiation.
Tightening Eco-Toxicity Regulations on Ethoxylates/NPEs
California’s 2024 listing of nonylphenol ethoxylates as a Priority Product mandates phase-out by 2027, forcing industrial degreasers and textile auxiliaries to transition to linear alcohol ethoxylates. The U.S. EPA’s Significant New Use Rule freezes legacy NPEs out of new product development, and ECHA’s Annex XVII caps residual NPE at 0.01% in EU-market formulations. Compliance requires aquatic-toxicity and biodegradation testing that can exceed USD 500,000 and delay launches by up to 18 months, a burden smaller regional formulators struggle to absorb. Although regulations create pull-through demand for linear alcohol ethoxylates, they also open niches for biosurfactants and glucosides as formulators diversify portfolios to future-proof against further restrictions. Multinationals with turnkey regulatory dossiers seize shelf space vacated by local brands unable to navigate the compliance maze.
*Our forecasts treat driver/restraint impacts as directional, not additive. The impact forecasts reflect baseline growth, mix effects, and variable interactions.
Alcohol Ethoxylates Market Segment Analysis
By Origin Type:
Oleochemical Dominance Reflects Sustainability MandatesOleochemical alcohol ethoxylates held 58.32% volume share in 2025, and their 3.97% CAGR through 2031 is set to widen the gap over petrochemical grades as brand owners pledge 100% renewable carbon by 2030. The alcohol ethoxylates market benefits from Southeast-Asian vertical integration, where palm-oil refiners downstream into fatty-alcohols and ethoxylation, capturing value while guaranteeing RSPO mass-balance certification at competitive cost structures. Petrochemical variants remain essential in the Middle East and U.S. Gulf Coast, where captive ethylene and propylene chains offset sustainability premiums, sustaining supply into commodity oilfields and industrial cleaners. Mass-balance accounting schemes from BASF and Dow offer a hybrid pathway, allocating renewable-feedstock credits across global networks, though acceptance varies by certification body. Emerging technologies that synthesize ethylene oxide from bio-ethanol or ferment sugars directly into fatty alcohols hint at a third, fully bio-based pathway that could command premium pricing in pharma excipients where traceability outweighs cost.
Oleochemical supply resilience is reinforced by Indorama Ventures’ USD 1.3 billion purchase of Oxiteno, which extended its fatty-alcohol footprint into Latin America and created a USD 3.6 billion surfactant segment potentially poised for a public listing. Wilmar, KLK OLEO, and Musim Mas invest aggressively in renewable electricity and methane-capture to lower scope-1 emissions, raising the barrier to entry for smaller tollers unable to achieve comparable ESG scores. The alcohol ethoxylates market, therefore, rewards producers that can certify chain-of-custody, optimize carbon intensity, and guarantee logistics agility during feedstock shocks.
By Carbon Chain Length:
C12–C14 Balances Performance and MildnessC12-C14 alcohol ethoxylates accounted for 41.66% of volume in 2025 and are projected to grow at a 4.12% CAGR to 2031, outperforming shorter and longer chain segments due to their hydrophilic-lipophilic balance of 12-15 that yields superior detergency and skin-mild foam. RSPO-certified lauryl alcohol represents roughly 70% of global C12-C14 fatty-alcohol supply, ensuring ample feedstock for both bulk detergents and premium personal-care applications. Narrow-range variants that concentrate the ethylene-oxide distribution around the target molar ratio command 15-20% premiums, as formulators value lower irritation indexes and improved foam aesthetics in sulfate-free shampoos. C9-C11 grades, while lower-foaming and favored in hard-surface cleaners, face odor and volatility limitations in cosmetics. C15-C18 and branched steryl chains serve high-temperature oilfield and polymerization end-uses where emulsion stability at >100 °C is critical, but the energy transition and coatings reformulations cap their expansion prospects.
Demand for C12-C14 grades also benefits from European energy-efficiency mandates that encourage cold-wash detergents, where lauryl ethoxylates maintain soil removal at 20-30 °C, enabling electrical-utility savings for consumers. In emerging Asia-Pacific, increasing liquid-detergent penetration amplifies volume, as liquids require higher active-matter loading than powders. Headwinds include competing biosurfactants and alkyl polyglucosides, but cost and performance differentials keep C12-C14 alcohol ethoxylates entrenched in mainstream formulations.


By Form:
Liquid Grades Dominate on Handling and Formulation EaseLiquid alcohol ethoxylates held 62.93% share in 2025 and are advancing at a 4.35% CAGR through 2031, reflecting formulators’ preference for ambient-temperature handling and compatibility with automated filling lines. Liquids simplify just-in-time blending, essential for personal-care contract manufacturers managing batch sizes from 500 kg to 50,000 kg in fast turnover cycles. Cold-water solubility supports growth in detergent pods and sachets popular among urban millennials in China and Indonesia, where storage space is at a premium. Paste and solid forms retain relevance in powder detergents and certain agrochemical adjuvants, where low water content minimizes hydrolysis risk and cuts freight weight by up to 30% on intercontinental routes. However, the global shift toward liquid laundry formats erodes paste demand, particularly as e-commerce platforms favor compact, spill-resistant packaging.
Industrial segments such as metal degreasing and textile scouring continue using high-active-matter pastes (90-95%) to reduce tankage footprint, yet the rise of centralized toll blending threatens this niche. Solid flakes and prills find limited use in enhanced oil recovery, dissolved onsite into high-salinity brines, but oilfield operators increasingly specify liquid concentrates to minimize dust exposure and streamline logistics. Consequently, liquid grades will solidify their majority stake in the alcohol ethoxylates market through the forecast horizon.
By Application:
Personal Care Accelerates as Detergents PlateauSoaps and detergents comprised 49.51% of volume in 2025 but are growing below the overall alcohol ethoxylates market as saturation in developed economies tempers incremental demand. In contrast, personal-care formulations expand at a 4.42% CAGR to 2031, the fastest among end-uses, as clean-beauty brands phase out sulfated anionics in favor of gentle, nonionic blends led by C12-C14 alcohol ethoxylates. Industrial and institutional cleaning maintains steady momentum, fueled by post-pandemic hygiene upgrades in healthcare and hospitality that value linear alcohol ethoxylates’ low-foaming and biodegradation credentials. Agrochemicals, paints, coatings, and textile processing are witnessing rising ethoxylate consumption, with agrochemicals the standout as tighter residue limits spur adoption of efficiency-boosting adjuvants.
Paints and coatings leverage alcohol ethoxylates for pigment wetting and foam control during high-shear dispersion, but construction cycles and silicone-based substitute additives restrict upside. Textile processing faces relocation of garment manufacturing to South Asia and Africa, regions where specialty chemical supply chains remain thin, slowing adoption of advanced surfactants. Oilfield use cases, including drilling fluids and enhanced recovery, grow modestly as operators extract additional barrels from mature reservoirs.
Geography Analysis
APAC Alcohol Ethoxylates Market
Asia-Pacific commanded 52.34% of global volume in 2025 and is poised to advance at a 4.82% CAGR through 2031, underscored by rising disposable incomes, urban migration, and sanitation campaigns proliferating liquid-detergent usage in China, India, and key ASEAN markets. China’s transition from bar soaps to liquid handwash continues at a mid-single-digit pace, supported by e-commerce penetration in lower-tier cities. India’s rural detergent gap offers multi-year upside as government hygiene initiatives and micro-distribution models bridge last-mile access. ASEAN hubs such as Indonesia and Vietnam attract greenfield ethoxylation investments to sidestep import tariffs and localize value chains, while mature Japan and South Korea target high-value narrow-range grades for cosmetics.
North America and Europe Alcohol Ethoxylates Market
In North America and Europe, market maturity and stringent eco-toxicity rules limit incremental tonnage. Uptake of linear alcohol ethoxylates in institutional cleaning accelerates, yet biosurfactant substitution in premium personal-care products moderates overall growth. Both regions deploy bio-based ethoxylation capacity—Croda’s Snaith plant and BASF’s Ludwigshafen retrofit—to capture incentives under the EU Green Deal and U.S. BioPreferred program. Regulatory rigor fuels demand for turnkey, fully compliant surfactant systems, giving integrated majors an edge over smaller, regional suppliers.
MEA and South America Alcohol Ethoxylates Market
South America and the Middle East and Africa are witnessing rising demand for alcohol ethoxylates. Brazil’s oleochemical ecosystem, centered on Oxiteno’s integrated facilities, serves domestic agrochemical and home-care sectors that value local content and RSPO-certified supply. Argentina’s macroeconomic volatility constrains surfactant imports, while the Middle East leverages low-cost ethylene to export petrochemical-derived alcohol ethoxylates into Africa, eroding freight advantages once enjoyed by Asian producers. South Africa’s detergent shift toward liquids is tempered by infrastructure gaps and price sensitivity that keep powder formats dominant across sub-Saharan markets.

Regulatory Landscape
Alcohol ethoxylates are covered under high-production-volume chemical frameworks that shape market access and downstream stewardship requirements. In the European Union, REACH (EC No 1907/2006) sets registration and data obligations for substances manufactured or imported above 1 tonne/year, while in the United States, alcohol ethoxylates are captured in EPA substance registries under TSCA-facing identifiers used for compliance and supply-chain screening. In Canada, the Chemicals Management Plan and related assessments provide the risk-management basis for poly-alkoxylates/ethers groups.
Environmental compliance is increasingly reflected in water-quality expectations and product-substitution programs across cleaning and industrial uses. Under the Canadian Environmental Protection Act, 1999, Canada issued a federal freshwater quality guideline for alcohol ethoxylates at 70 micrograms per litre (0.07 mg/L), calculated using an average homologue distribution of C13.7EO5, which informs effluent control and monitoring practices for downstream industrial users. Trade and classification also affect landed costs: alcohol ethoxylates are commonly classified under HS heading 3402 (including 3402.42 for non-ionic surface-active agents), and in February 2025, India Customs Authority for Advance Rulings confirmed that fatty alcohol ethoxylates with 3 or more moles of ethylene oxide are classifiable under Tariff Item 3402 42 00, supporting clearer import classification for formulators and distributors.
Value Chain Analysis
The value chain starts with upstream feedstocks and intermediates, mainly fatty alcohols (from oleochemical routes linked to palm kernel/coconut and from petrochemical routes) and ethylene oxide produced from ethylene crackers. These inputs move into midstream alkoxylation, where ethoxylation typically uses base catalysts such as potassium hydroxide under elevated temperatures and controlled pressure, and many producers integrate ethylene oxide supply and alkoxylation to improve safety, utilization, and variable cost position. Vertical integration also helps reduce exposure to ethylene oxide and fatty-alcohol price swings, while simplifying logistics for large-volume liquid grades.
Downstream, alcohol ethoxylates are supplied to formulators across detergents, personal care, industrial and institutional cleaning, agrochemical adjuvants, and other specialty applications, and then to brand owners and distributors that increasingly request biodegradability, narrow-range performance, and chain-of-custody claims. Distribution typically relies on bulk shipments and regional storage and blending, with procurement based on qualification testing, documentation (including environmental and safety dossiers), and, for some buyers, certified supply chains. The competitive landscape spans integrated producers and specialist surfactant companies, including BASF, Shell, Sasol, Huntsman, Clariant, and Indorama Ventures through Oxiteno, while reactor design and process control upgrades are used to improve selectivity and safety in ethoxylation operations.
Competitive Landscape
The alcohol ethoxylates market is fragmented. Integrated petrochemical producers leverage captive ethylene-oxide streams to undercut independent plants on commodity grades, forcing differentiation through RSPO-certification, ultra-narrow distributions, or custom molar ratios that command 15-20% premiums in personal-care and pharma. Strategic plays include Indorama’s USD 3.3 billion surfactant build-out via Huntsman EO (2020) and Oxiteno (2022) acquisitions, BASF’s Zhanjiang vertical integration, and Evonik’s specialty-line commissions in Shanghai and Singapore targeting Asia-Pacific growth corridors. Process innovations such as digital twin modeling and continuous-flow alkoxylation raise asset utilization and safety; SABIC’s 50% batch-size uplift and 19% energy-cut in 2024 exemplify the margin gains available to early adopters. Compliance hurdles, including ISO 14001 and RSPO audits, elevate fixed costs, prompting smaller tollers either to exit commoditized grades or partner with majors to co-develop high-value specialties.
Alcohol Ethoxylates Industry Leaders
BASF
Dow
Clariant
Sasol Ltd
SABIC
- *Disclaimer: Major Players sorted in no particular order
Alcohol Ethoxylates Market Companies Covered in this Report
- BASF
- Clariant
- Croda International plc
- Dow
- Evonik Industries AG
- Huntsman International LLC
- India Glycols Limited
- Indorama Ventures Public Company Limited
- Kao Chemicals Europe, S.L.U.
- Kemipex
- Mitsui Chemicals Inc.
- Nouryon
- Procter & Gamble
- SABIC
- Sasol Ltd
- Shell plc
- Stepan Company
- Syensqo
- Thai Ethoxylate Co., Ltd. (TEX)

Market Opportunities and Future Outlook
Regulatory and buyer-led substitution away from alkylphenol ethoxylates continues to expand the formulation space for linear alcohol ethoxylates in industrial cleaning, textile auxiliaries, and institutional applications that prioritize readily biodegradable nonionics and align with programs such as U.S. EPA Safer Choice and EU Ecolabel criteria used by formulators. At the same time, the cost and burden of compliance testing and ongoing dossier maintenance creates room for suppliers that can offer turnkey, pre-qualified alcohol ethoxylate portfolios and documentation across multiple homologue and ethoxylation ranges, especially for multinational customers consolidating procurement.
Capacity additions and integration projects are also shifting where supply is available and at what cost, supporting opportunities in localized supply, tolling, and specialty differentiation. In India, Rossari Biotech subsidiary Unitop Chemicals completed a 30,000 MTPA ethoxylation expansion at Dahej, with the final 15,000 MTPA phase commissioned on March 31, 2026, bringing total installed capacity at the site to 66,000 MTPA and improving regional availability of ethoxylated surfactant intermediates for home care, industrial, and agrochemical formulators. In China, BASF started production at its new 1 million tonne ethylene complex in Zhanjiang in November 2025, supporting downstream EO and ethoxylate capabilities and reinforcing the shift toward integrated, Asia-centered supply. As certification adoption widens, mass-balance and bio-circular claims, including ISCC PLUS, also provide a commercialization route for renewable-feedstock allocation in existing assets, enabling premium grades without requiring customers to requalify entire formulations.
Recent Industry Developments in Alcohol Ethoxylates Market
- March 2026: BASF Hannong Chemicals Solutions Ltd. (BHCS) inaugurated a new non-ionic surfactant site in Seosan, Korea, after starting trial operations in January 2026. The added footprint strengthens regional supply options for nonionic surfactants used in cleaning and other formulations, supporting shorter lead times and local sourcing in Northeast Asia.
- December 2025: Syensqo announced its Moerdijk site obtained ISCC PLUS mass-balance certification for bio-circular products, enabling supply of certified laundry surfactants such as laureth-7 starting in January 2026. The certification supports customers seeking verified renewable or circular-feedstock attribution while keeping existing production and formulation systems largely unchanged.
- July 2024: Clariant and OMV disclosed a collaboration aimed at reducing the carbon footprint of ethylene and ethylene oxide derivatives, which are key building blocks for ethoxylated surfactants. The initiative highlights how upstream decarbonization partnerships are becoming part of surfactant supply qualification, especially for buyers tying procurement to measurable emissions reduction.


Alcohol Ethoxylates Market Report Scope and Research Methodology
Market Definition and Coverage
This market covers alcohol ethoxylates sold as nonionic surfactant ingredients to formulators and industrial users. We measure the addressable opportunity using the value of material sold, and we apply volume checks where the same trade and production indicators are available.
Scope exclusions: Packaged end products such as finished household cleaners, shampoos, and cosmetics are excluded even if they contain alcohol ethoxylates.
Segments Covered in This Report
- By Origin Type
- Oleochemical-derived
- Petrochemical-derived
- By Carbon Chain Length
- C9-C11 (Linear Alcohol Ethoxylates)
- C12-C14 (Lauryl Alcohol Ethoxylates)
- C15-C18 and Branched (Steryl Alcohol Ethoxylates)
- By Form
- Liquid
- Paste / Solid
- By Application
- Personal Care
- Soaps and Detergents
- Industrial and Institutional Cleaning
- Agricultural Chemicals
- Paints and Coatings
- Textile Processing
- Other Applications (Oil and Gas (EOR, drilling fluids))
- By Geography
- Asia-Pacific
- China
- India
- Japan
- South Korea
- ASEAN Countries
- Rest of Asia-Pacific
- North America
- United States
- Canada
- Mexico
- Europe
- Germany
- United Kingdom
- France
- Italy
- Rest of Europe
- South America
- Brazil
- Argentina
- Rest of South America
- Middle-East and Africa
- Saudi Arabia
- South Africa
- Rest of Middle-East and Africa
- Asia-Pacific
Data Sources, Market Sizing, and Validation
Desk Research
Desk research begins with mapping the supply chain, from fatty alcohol feedstocks through ethoxylation and then into key use areas such as detergents and industrial cleaning. For the numeric anchors, we use public datasets and standards that help frame production and trade flows, including UN Comtrade for surfactant-related trade lines, the US International Trade Commission data portal, Eurostat, and energy and chemicals statistics published by agencies such as the IEA and the US EIA.
We also review peer-reviewed papers and technical references that describe typical alcohol ethoxylate grades and the performance targets needed by formulators, because those details affect feasible pricing and substitution choices. Company filings, investor presentations, and reputable press coverage are used to confirm capacity additions, plant outages, and feedstock constraints that can shift volumes and pricing. Where available, we use paid subscriptions for company financials and intelligence, patent databases, and shipment-level import and export datasets to validate timelines and directionally cross-check market movement. These examples are not exhaustive, and many other public sources were reviewed to collect, validate, and clarify the data points used in the model.
Primary Interviews and Surveys
Primary work focuses on short expert discussions and structured surveys with producers, distributors, and large buyers that procure surfactant ingredients for detergent lines, personal care formulations, and industrial applications. Demand and supply perspectives are collected across APAC, EMEA, and the Americas, so utilization assumptions, spot versus contract pricing dynamics, and regional mix are tested before finalizing the market totals.
Distribution of primary research fieldwork respondents
| Company type | Respondent position | Region |
|---|---|---|
| Top tier: 38% | CXOs: 14% | APAC: 45% |
| Mid tier: 45% | Functional/Unit leaders: 27% | EMEA: 33% |
| Smaller Players: 17% | Managers: 59% | Americas: 22% |
Market-Sizing & Forecasting
The core sizing uses a top-down build where production and trade indicators are reconstructed into an addressable alcohol ethoxylates demand pool, and then aligned to regional consumption for key end-use manufacturing. To keep the output practical, we corroborate it with selective bottom-up checks, such as sampled supplier revenue splits, channel checks with distributors, and a simple volume-times-average-price cross-check for representative grades.
Inputs used in the model include fatty alcohol and ethylene oxide cost movement, ethoxylation capacity changes and utilization direction, detergent and industrial cleaner output trends, regional import-export balances for surfactant-related lines, and the shift toward higher performance and low-foaming formulations. When a data gap appears, we use the closest observable proxy and then revisit the assumption during interviews so it does not remain in the model without confirmation. Forecasts are run using scenario analysis supported by a light regression-style link between demand drivers and derived volumes, and the final trajectory is adjusted only after experts confirm the realism of pricing progression and operating rates.
Data Validation & Update Cycle
Each major output is validated through consistency checks across value, volume, and trade direction so the market story aligns with observable signals. If a region shows an unusual jump, the underlying drivers are rechecked, and the analyst team revisits assumptions such as utilization, net imports, and price realization before sign-off.
The work is reviewed in steps, starting from the first model build, followed by peer review, and then a final pass to check whether the latest public updates change key inputs. Reports are refreshed annually, and interim updates are triggered when major capacity events, regulation shifts, or feedstock shocks materially change supply or pricing.
Mordor Intelligence's Alcohol Ethoxylates Market Size Versus Other Published Estimates
Published market sizes for alcohol ethoxylates can look inconsistent because groups do not always use the same boundary, year basis, and unit of measurement. Differences also come from how pricing is handled in a feedstock-led product, where margins and contract timing can move the value without changing underlying tonnage by the same proportion.
By tracking volume signals alongside price realization and then refreshing the scope boundary checks, Mordor Intelligence keeps the model tied to ingredient sales of alcohol ethoxylates rather than finished cleaning and personal care products that only contain them. The remaining spread usually comes down to whether estimates rely on older base years, use broader surfactant baskets, assume aggressive price pass-through, or apply currency conversion at different timing points.
Benchmark comparison
| Source | Market Size | Gaps in Research Methodology |
|---|---|---|
| Mordor Intelligence | USD 7.45 B (2025) | |
| Global Consultancy A | USD 6.07 B (2024) | Uses a prior base year and a sales-market framing that can understate value when contract prices reset later than feedstock moves, and it may not fully reconcile regional trade balances with consumption. |
| Industry Publisher B | USD 5.75 B (2019) | Relies on an older historical year and then projects forward, so it can miss newer capacity additions and recent pricing cycles, which tends to widen the gap versus current-year modeled values. |
Looking across the table, the main takeaway is that the year chosen and the exact product boundary drive most of the variance, with pricing timing adding another layer. Our approach stays repeatable because it links value back to clear demand and supply signals, and then rechecks those signals when the market moves.


Key Questions Answered in the Report
Which segment is growing fastest in alcohol ethoxylates personal-care applications?
Personal-care formulations are forecast to expand at a 4.42% CAGR through 2031 as clean-beauty brands replace sulfated anionics with milder C12-C14 alcohol ethoxylates.
How large is the alcohol ethoxylates market by 2031?
The market is expected to reach 4.32 million tons by 2031, growing at a 3.66% CAGR.
What share do liquid alcohol ethoxylates hold today?
What share did liquid alcohol ethoxylates hold in 2025?
Which region dominates demand growth?
Asia-Pacific drives more than half of global volume and is projected to grow at a 4.82% CAGR through 2031 on the back of urbanization and rising incomes.
Page last updated on:


 Your data is secure and never sold or shared.


