
Alarm Monitoring Market Size and Share
Market Overview
| Study Period | 2020 - 2031 |
|---|---|
| Market Size (2026) | USD 69.05 Billion |
| Market Size (2031) | USD 92.96 Billion |
| Growth Rate (2026 - 2031) | 6.13% CAGR |
| Fastest Growing Market | Asia Pacific |
| Largest Market | North America |
| Market Concentration | Medium |
Major Players *Disclaimer: Major Players sorted in no particular order Image © Mordor Intelligence. Reuse requires attribution under CC BY 4.0. | |
Alarm Monitoring Market Analysis by Mordor Intelligence
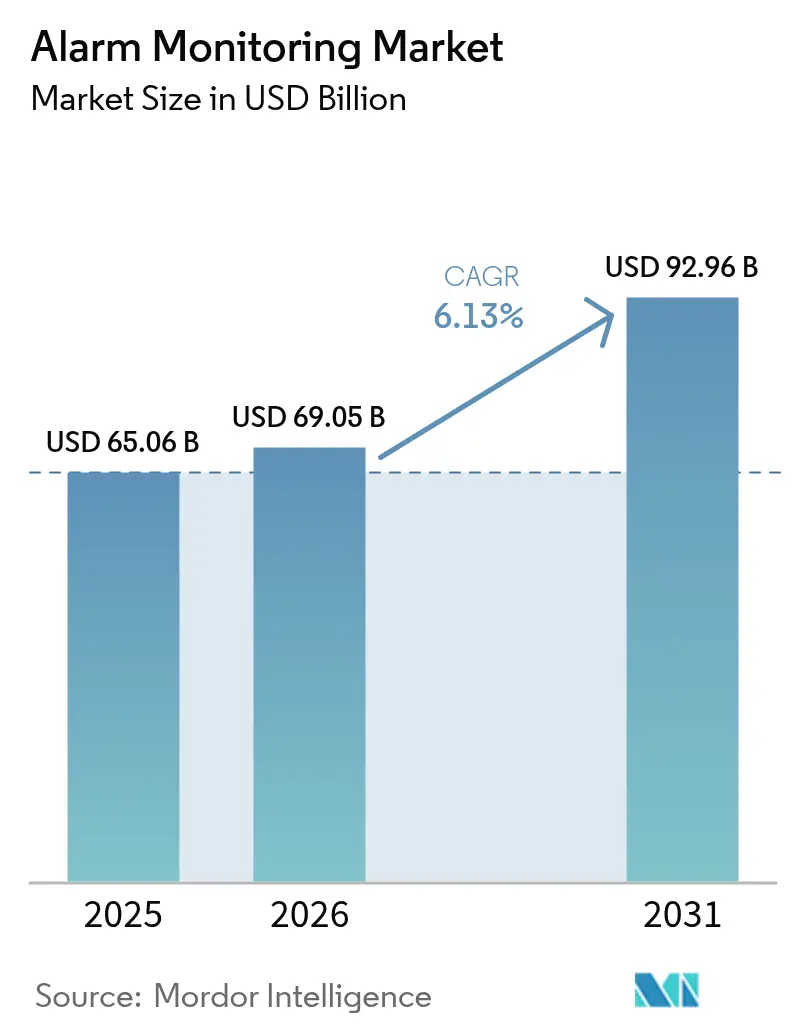
The alarm monitoring market size was valued at USD 65.06 billion in 2025 and estimated to grow from USD 69.05 billion in 2026 to reach USD 92.96 billion by 2031, at a CAGR of 6.13% during the forecast period (2026-2031). Rapid migration from legacy phone-line signaling to cloud-based, AI-enabled platforms expands the addressable customer base while raising average revenue per user. Growing insurance discounts of 5-20% for professionally monitored systems encourage new residential and commercial adopters, and 5G or LTE-M connectivity reduces false alarms and service truck rolls. Competitive intensity increases as manufacturers bundle analytics, video, and cellular modules into single SKUs, compressing hardware margins but accelerating service upgrades. At the same time, stricter lone-worker legislation and sustainability mandates drive enterprise demand for remote asset observability across energy, construction, and public-safety assets. Together, these dynamics sustain mid-single-digit expansion even as price pressure rises in saturated regions of North America and Europe.
Key Report Takeaways
- By offering, services accounted for 49.22% revenue share in 2025 in the alarm monitoring market, while software is poised to expand at a 6.78% CAGR to 2031.
- By communication technology, cellular networks held 44.35% of the alarm monitoring market share in 2025 and IP networks are forecast to register a 6.74% CAGR through 2031.
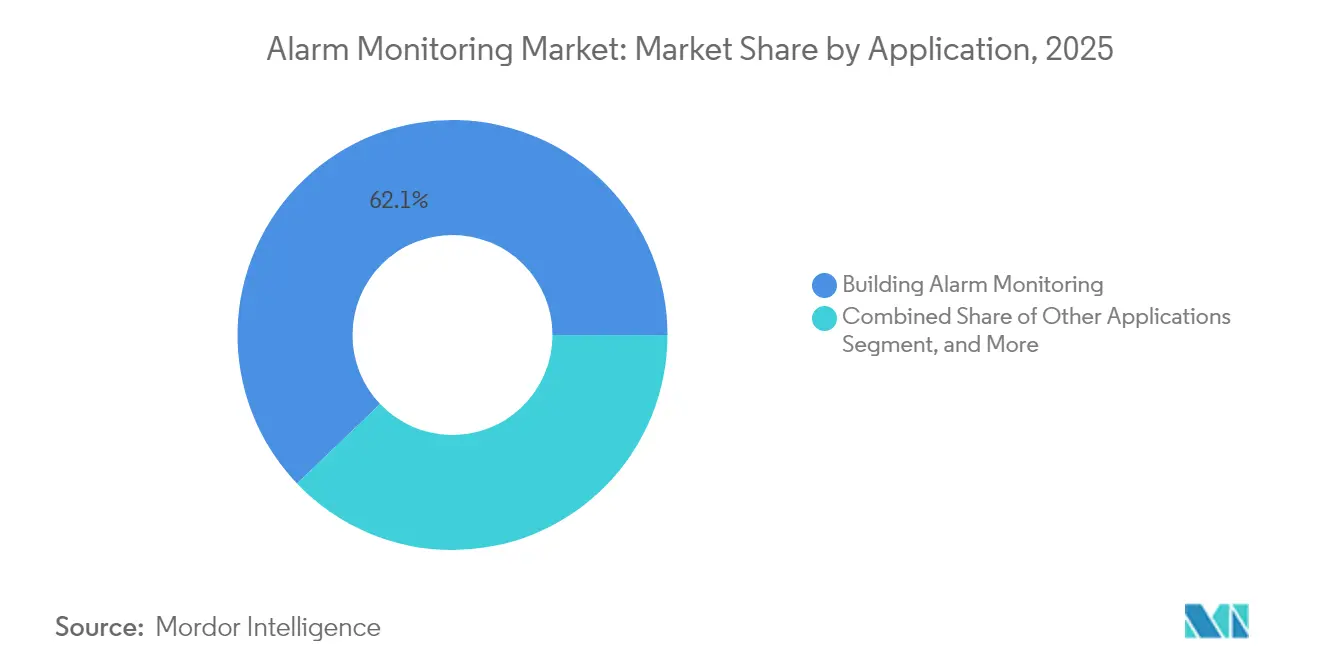
- By application, building monitoring captured 62.13% revenue in 2025 in the alarm monitoring market; smart-city infrastructure is projected to advance at a 7.05% CAGR to 2031.
- By end user, residential customers represented 52.15% revenue in 2025 in the alarm monitoring market, whereas industrial and infrastructure sites are on track for a 6.93% CAGR over the same horizon.
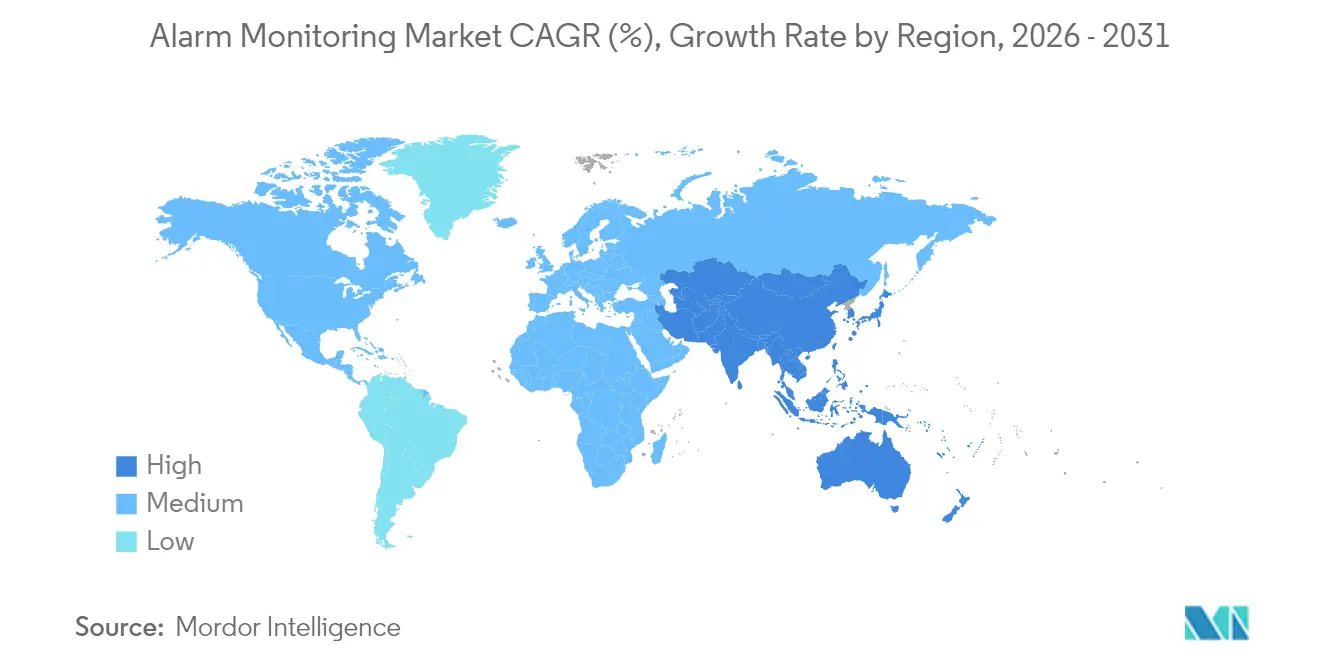
- By geography, North America led with 38.55% revenue in 2025 in the alarm monitoring market, and Asia Pacific is estimated to expand at a 6.69% CAGR through 2031.
Note: Market size and forecast figures in this report are generated using Mordor Intelligence’s proprietary estimation framework, updated with the latest available data and insights as of 2026.
Global Alarm Monitoring Market Trends and Insights
Drivers Impact Analysis*
| Driver | (~) % Impact on CAGR Forecast | Geographic Relevance | Impact Timeline |
|---|---|---|---|
| Rising adoption of cloud-based VSaaS alarm platforms | +1.2% | Global, with North America and Europe leading | Medium term (2-4 years) |
| Integration of AI-powered video analytics for proactive threat detection | +1.5% | North America and APAC core, spill-over to Europe | Medium term (2-4 years) |
| Insurance premium incentives for professionally monitored systems | +0.8% | North America and Europe primarily | Short term (≤ 2 years) |
| Mandatory lone-worker safety regulations in high-risk industries | +0.9% | Global, with stricter enforcement in developed markets | Long term (≥ 4 years) |
| Growing demand for remote asset monitoring in renewable-energy sites | +0.7% | Global, concentrated in renewable energy hubs | Long term (≥ 4 years) |
| Expansion of 5G and LTE-M boosting cellular alarm reliability | +1.1% | APAC core, North America, selective European markets | Medium term (2-4 years) |
| Source: Mordor Intelligence | |||
Rising Adoption of Cloud-Based VSaaS Alarm Platforms
Cloud video surveillance as a service shifts costs from capital outlay to predictable operating fees, letting enterprises scale storage and analytics instantly while off-loading maintenance. Large providers now process hundreds of millions of signals each year, proving that multitenant architectures handle burst traffic better than on-premise servers. Because updates deploy centrally, customers receive new AI features without site visits, reducing truck rolls and carbon emissions. Integration with facility-management software turns the platform into a single pane of glass for security, HVAC, and energy dashboards. Vendors that lack cloud competencies risk margin erosion as subscribers migrate to providers with predictive analytics and automated response options.
Integration of AI-Powered Video Analytics for Proactive Threat Detection
Machine-learning models trained on diverse camera feeds now differentiate humans from pets or foliage motion, reducing false dispatches by up to 40%.[1]UL Solutions, “Security Alarm Service Certification,” ul.com Monitoring centers consequently lower operating expense and improve emergency-responder trust. Identity-based analysis such as facial recognition enables person-specific alerts, enhancing access control revenue. Honeywell and other manufacturers embed algorithms at the edge, preserving bandwidth while meeting data-sovereignty rules. Nonetheless, privacy regulations in Europe and select U.S. states place compliance burdens on integrators, demanding opt-in consent and audit trails. Providers that master privacy-by-design frameworks create durable differentiation in regulated verticals.
Insurance Premium Incentives for Professionally Monitored Systems
Insurers discount premiums between 5% and 20% when properties deploy UL-listed central-station services. For high-value facilities, savings often exceed monthly monitoring fees, reframing security as a cost-optimization lever rather than a discretionary expense. Certifications like UL 827 and TMA Five Diamond act as shorthand for response reliability, guiding broker recommendations and vendor short-listing. New coverage classes, including cyber liability, increasingly reference 24/7 intrusion or environmental monitoring as evidence of due diligence. Consequently, providers with accredited stations close deals faster and justify premium ARPU.
Mandatory Lone-Worker Safety Regulations in High-Risk Industries
In oil, gas, mining, and construction, regulators require real-time location tracking and man-down alerts under OSHA and analogous global statutes. Professional monitoring adds redundancy through dual-path communication and automated escalation protocols. Because fines and production delays outweigh service fees, companies treat safety monitoring as essential infrastructure, extending contracts to multi-year horizons. Training academies run by Johnson Controls help fill technician gaps, ensuring certified installs across remote sites. Regulatory momentum therefore underwrites long-term service pipelines even during macroeconomic slowdowns.
Restraints Impact Analysis*
| Restraint | (~) % Impact on CAGR Forecast | Geographic Relevance | Impact Timeline |
|---|---|---|---|
| High churn rates in residential monitoring subscriptions | -1.8% | Global, particularly acute in North America | Short term (≤ 2 years) |
| Cyber-security vulnerabilities of IoT alarm endpoints | -1.2% | Global, with heightened concern in Europe due to GDPR | Medium term (2-4 years) |
| Shortage of certified installers in emerging markets | -0.9% | APAC, South America, parts of Africa | Long term (≥ 4 years) |
| Sunset of 3G/2G networks increasing equipment obsolescence | -1.1% | Global, with accelerated timeline in developed markets | Short term (≤ 2 years) |
| Source: Mordor Intelligence | |||
High Churn Rates in Residential Monitoring Subscriptions
Annual attrition exceeding 12% erodes margins, forcing providers to spend heavily on re-acquisition.[2]OSHA, “Occupational Safety and Health Standards,” osha.gov Price-sensitive millennials gravitate toward DIY cameras with smartphone alerts, bypassing monthly fees. Regulatory scrutiny curtails long-term contracts and auto-renewal clauses, limiting lock-in strategies that once dampened churn. To improve retention, incumbents add home-automation bundles such as lighting or leak-detection, deepening daily engagement. Early results show modest improvements, but any economic downturn could reignite cancellation waves.
Cyber-Security Vulnerabilities of IoT Alarm Endpoints
Every connected sensor expands the threat surface for credential stuffing, botnet enlistment, or lateral network movement.[3]UL Solutions, “Fire Alarm Service Certification,” ul.com GDPR imposes hefty fines if attackers access personal data through cameras or panels, raising operator liability. End-to-end encryption, zero-trust segmentation, and signed firmware updates mitigate risk but add bill of materials cost. Smaller dealers often lack SOC resources to monitor for breaches, creating opportunities for wholesale monitoring centers offering managed cyber services. Customer education remains critical, as default passwords and open port forwarding still plague residential installs.
*Our forecasts treat driver/restraint impacts as directional, not additive. The impact forecasts reflect baseline growth, mix effects, and variable interactions.
Segment Analysis
By Offering: Services Drive Recurring Revenue Transformation
Services generated 49.22% of revenue in 2025 as customers favored predictable monthly fees for 24/7 monitoring, professional installation, and maintenance. The alarm monitoring market size for services is positioned to climb alongside advanced cloud analytics that raise per-site ARPU. Hardware revenue softens as commoditized sensors face pricing pressure, yet ruggedized industrial gear keeps niche premiums where hazardous locations demand extra certifications. Software subscriptions outpace all categories at a projected 6.78% CAGR, validating the pivot toward analytics-first business models.
Recurring contracts sustain cash flow, letting providers fund acquisitions that consolidate regional dealers into national footprints. UL listing expenses and central-station redundancy create barriers to entry that protect incumbents. Meanwhile, SaaS dashboards enabling DIY configuration allow operators to serve smaller accounts profitably. As a result, the alarm monitoring market increasingly rewards hybrid players that couple hardware margins with long-life service annuities.


By Communication Technology: Cellular Networks Enable IoT Expansion
Cellular accounted for 44.35% of revenue in 2025 and remains the backbone for off-site signal transmission in both urban and rural locales. Battery-efficient LTE-M and NB-IoT modems broaden deployment to remote pipelines and solar arrays, segments fueling the alarm monitoring market. Conversely, IP-based solutions grow fastest at 6.74% CAGR thanks to building-wide Ethernet and PoE upgrades that support bandwidth-heavy video. Clients often select dual-path configurations, melding wired IP with cellular failover, to satisfy insurance underwriting and fire code redundancies.
Legacy POTS lines continue in government and heritage buildings where infrastructure grants offset costs, yet carriers phase them out within five years. Radio networks persist in temporary construction or event sites, underscoring the relevance of multi-technology hubs that switch automatically among available carriers. Suppliers that provide universal gateways capture more share as migration cycles accelerate.
By Application: Smart Cities Drive Innovation Beyond Traditional Security
Building monitoring held 62.13% revenue in 2025, underpinned by code-mandated fire and intrusion coverage in commercial real estate. Nonetheless, municipal deployments in traffic control, environmental sensing, and public-space safety expand the alarm monitoring market at a 7.05% CAGR. These projects demand open APIs and interoperability with SCADA, leading to multi-vendor consortium bids. Vehicle tracking, though smaller, benefits from fleet insurance mandates and cargo theft mitigation, albeit at slower growth amid razor-thin logistics margins.
Convergence between life-safety, energy management, and occupancy analytics redefines value propositions. Vendors that integrate BACnet, KNX, or Matter protocols unlock upsell paths into HVAC optimization and predictive maintenance. Such cross-domain capabilities position monitoring centers as holistic facility-management partners rather than commoditized signal routers.
By End-User Industry: Industrial Demand Outpaces Residential Growth
Residential users still represented 52.15% revenue in 2025, yet industrial and infrastructure clients command premium packages, pushing their CAGR to 6.93%. Regulatory compliance, covering worker safety, environmental emissions, and asset integrity, makes monitored alarms non-negotiable in factories, utilities, and energy fields. As a result, the alarm monitoring market share tilts steadily toward enterprise accounts, even as consumer smart-home brands erode low-tier residential plans.
Commercial facilities such as hospitals and data centers pay extra for AI-assisted validation and guard services, leveraging lower false dispatch to negotiate insurance discounts. Government agencies procure long-duration contracts that embed cybersecurity SLAs, locking in suppliers for five-plus years. Collectively, these dynamics lift blended ARPU and buffer against residential churn.
Geography Analysis
North America collected 38.55% of 2025 revenue, leveraging mature alarm center infrastructure and established dealer networks to bundle AI analytics and home-automation add-ons. The alarm monitoring market sees churn gradually easing as ADT’s latest 12.6% metric shows progress in engagement programs that tie security to lifestyle convenience. Regulatory frameworks such as UL 827 and TMA Five Diamond push smaller entrants toward wholesale partnerships rather than standalone stations, preserving margin for scaled incumbents.
Asia Pacific expands at 6.69% CAGR, with governments funding smart-city platforms that integrate traffic cameras, air-quality sensors, and emergency call boxes into unified command centers. Because greenfield construction dominates, cellular and IP connectivity outpace landlines, enabling rapid rollouts in megacities. Yet fragmentation persists, requiring global vendors to localize language, payment terms, and after-sales support to win tenders. Install-labor shortages further complicate timelines, elevating the appeal of self-install wireless kits for small businesses.
Europe’s steady growth reflects demand for privacy-centric, cyber-hardened solutions. Verisure operates across 13 countries with 5.7 million customers, boasting average response times under 60 seconds, a benchmark that underpins premium pricing. GDPR penalties for data misuse incentivize enterprises to select providers with documented end-to-end encryption and SOC-2 compliance. Meanwhile, green building directives push integrated security-plus-energy packages in retrofit projects, extending alarm relevance beyond intrusion.

Regulatory Landscape
Regulation for alarm monitoring is increasingly tied to central-station accreditation, alarm-transmission reliability, and cybersecurity for IP-connected systems. In the United States, UL 827 remains a core compliance benchmark for central-station alarm services, with the latest revision ANSI-approved in May 2025, reinforcing operational and automation requirements that are verified through recurring audits. Telecom transition policy is also shaping signaling choices: in April 2026, the U.S. FCC adopted technology-transition rules that declined to mandate a legacy G.711 codec handshake requirement for alarm receivers, supporting migration from legacy voice pathways toward IP-based transmission models.
In Europe, monitoring and alarm receiving centers operate under EN 50518 (with amendments such as EN 50518:2019/A1:2023), while secure remote services for fire and security systems are framed by EN 50710:2021. These standards reinforce facility resilience, secure operations, and controlled remote access as monitoring shifts to cloud-managed workflows. Jurisdiction-specific licensing continues to matter, for example Singapore's Fire Safety (Alarm Monitoring Services) Regulations 2020 for entities operating alarm monitoring networks and signal transmission links. Across regions, cybersecurity requirements are moving from guidance into enforceable codes for networked alarm systems, raising baseline expectations for encryption, access control, and auditability in monitored solutions.
Value Chain Analysis
The alarm monitoring value chain starts upstream with component and device suppliers (sensors, control panels, gateways, and cellular/IP communication modules) and continues through OEMs and software providers that supply device firmware, cloud platforms, and analytics. Midstream participants include distributors, system integrators, and installers who design and deploy systems, connect sites over cellular or IP, and configure rules and workflows. Downstream, 24/7 monitoring centers (owned by national providers or wholesale monitoring partners) deliver event triage, verification, dispatch coordination, and customer support, often backed by recurring services that represented 49.22% of revenue in 2025.
Standards and certification requirements influence how value is captured across the chain, especially at the monitoring-center layer where accreditation and redundancy raise barriers to entry. Technical and operational compliance anchors include UL 827 (revised May 2025) for central-station services and performance/security expectations for alarm transmission such as IEC 60839-5-1:2024, alongside European ARC requirements under EN 50518:2019/A1:2023. As deployments move from legacy PSTN signaling to IP and cloud-managed operations, value shifts toward software (APIs, dashboards, analytics, and cybersecurity controls), while installers and integrators differentiate through interoperability and secure remote-access implementations aligned with emerging European guidance and standards.
Competitive Landscape
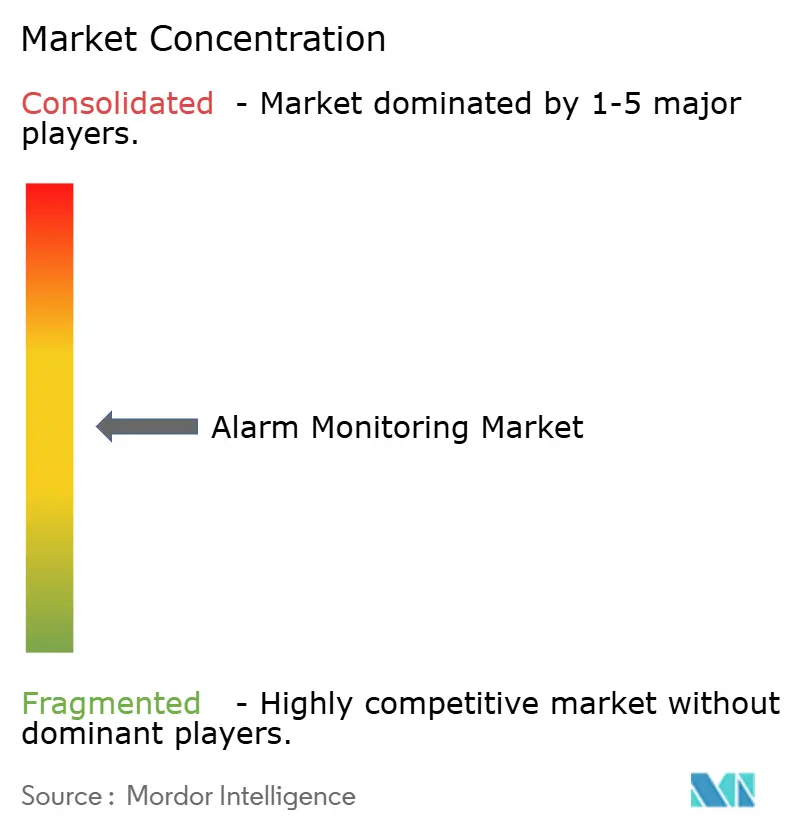
Moderate consolidation defines the sector as scale advantages in central-station redundancy, accreditation, and R&D create barriers for smaller peers. ADT, Johnson Controls, and Securitas leverage national footprints and trusted brands to lock in insurance partnerships that steer policyholders toward certified monitoring plans. The alarm monitoring market also features technology disruptors like Alarm.com, whose cloud platform processes 350 million annual signals, illustrating the efficiency and innovation gaps between legacy on-premise models and SaaS architectures.
Acquisition momentum remains brisk as GardaWorld absorbed Stealth Monitoring in January 2025 to expand remote video analytics, and Guardian Protection bought Monitronics accounts to bolster residential scale. Standards like ANSI/TMA AVS-01, now certified by UL, reward providers that automate alarm scoring, reducing false dispatch and freeing public-safety resources. Niche opportunities arise in renewable-energy sites and lone-worker safety where domain expertise trumps sheer size, letting specialized integrators command attractive margins.
Alarm Monitoring Industry Leaders
ABB Ltd.
Siemens AG
Honeywell International Inc.
Schneider Electric SE
Rockwell Automation, Inc.
- *Disclaimer: Major Players sorted in no particular order

Market Opportunities and Future Outlook
A primary whitespace is modernization of alarm transmission and monitoring workflows as standards and codes lift the floor for secure IP connectivity and cybersecurity. This creates upgrade pull-through across installed bases that still rely on legacy signaling. The 2026 revision of the ANSI-approved SIA DC-09 protocol for secure IP-based alarm transmission (released in March 2026) supports tighter security controls, including updated encryption handling and autocommissioning. That reduces deployment friction for multi-site rollouts and accelerates partner integrations. In parallel, NFPA 72 (2025 edition) introduces mandatory cybersecurity requirements for IP-connected fire alarm systems, and its adoption in major jurisdictions (for example, California effective January 1, 2026) strengthens demand for monitoring services that can document secure configurations, audit trails, and incident response procedures.
Platform-led interoperability is also expanding the addressable opportunity beyond classic intrusion into safety and operational monitoring across industrial and infrastructure sites. Vendor ecosystems that expose APIs and remote configuration capabilities support multi-vendor consolidation into fewer dashboards, reinforcing the shift toward software subscriptions and higher-value services. Honeywell and Siemens both illustrate this direction through cloud-connected building and safety software and remote alarm management tooling, which gives monitoring centers and integrators a pathway to bundle verified alarms, analytics, and secure remote services for regulated facilities and distributed asset operators.
Recent Industry Developments
- June 2026: Honeywell launched enhanced Safety Suite 2.0 industrial software to provide centralized dashboards, historical data views, and real-time alerts for connected gas detection device fleets. The release strengthens software-led monitoring workflows by improving fleet visibility and event response across distributed industrial sites. It also supports the market shift from standalone devices toward platform-based monitoring services with recurring software value.
- July 2025: Honeywell was selected to increase fire alarm automation at Phoenix Sky Harbor International Airport. The project scope highlights how large facilities are upgrading life-safety systems with more automated detection and response workflows that feed into monitoring and dispatch operations. It also signals continued enterprise investment in modernized alarm infrastructure where uptime and compliance requirements elevate the role of professional monitoring.
- September 2024: Honeywell expanded its monitoring and connected-building capabilities with IoT API integrations for its monitoring offerings. The integrations improve interoperability across multi-vendor environments, making it easier for integrators and end users to unify alarms, video, and building systems into a single operational view. This approach reinforces the trend toward open, cloud-enabled platforms that reduce integration friction and increase attach rates for monitoring services.


Research Methodology Framework and Report Scope
Market Definition and Coverage
For this study, the alarm monitoring market covers the value earned from monitoring security and safety events from customer sites, where alarm signals are received, verified, and then escalated to responders using telecom and IP networks.
Scope exclusions: We exclude standalone one-time device sales when they are not tied to monitoring, and we also exclude on-site guarding and physical security staffing services.
Segmentation Overview
- By Offering
- Hardware
- Remote Terminal Units (RTUs)
- Alarm Sensors
- Communication Networks and Gateways
- Other Hardware
- Software
- Services
- Hardware
- By Communication Technology
- Wired Telecommunication Network
- Cellular Wireless Network
- Wireless Radio Network
- IP Network
- By Application
- Vehicle Alarm Monitoring
- Building Alarm Monitoring
- Other Applications
- By End-User Industry
- Residential
- Commercial
- Industrial and Infrastructure
- Government and Public Safety
- By Geography
- North America
- United States
- Canada
- South America
- Brazil
- Mexico
- Rest of South America
- Europe
- Germany
- United Kingdom
- France
- Russia
- Rest of Europe
- Asia Pacific
- China
- Japan
- India
- Rest of Asia Pacific
- Middle East and Africa
- Middle East
- Saudi Arabia
- United Arab Emirates
- Rest of Middle East
- Africa
- South Africa
- Nigeria
- Rest of Africa
- Middle East
- North America
Data Sources, Market Sizing, and Validation
Desk Research
Desk research started with clarifying how alarm monitoring is delivered in practice, from signal transmission to event handling, because the service boundary can blur with adjacent security services. We used public and official sources such as FCC communications policy updates, US Census and Bureau of Labor Statistics series for labor and service price direction, Eurostat business statistics, and UN Comtrade trade flows for security equipment as supporting context.
To anchor the model inputs, we also reviewed illustrative sources such as NFPA fire safety guidance and insurance and risk publications that discuss monitored alarm discounts, plus public filings and investor presentations of listed security service providers. Where company revenue splits or regional footprints were unclear, we used a paid subscription for company financials and intelligence and a patent database to check technology direction and solution mix, then validated the remaining assumptions in interviews. These examples are not exhaustive, and many other public documents and data series were used to collect, cross-check, and clarify the final estimates.
Primary Interviews and Surveys
Primary work focused on cross-checking what is counted as monitoring revenue, how bundled packages are priced, and how mix is changing across residential, commercial, and vehicle-related monitoring. We spoke with respondents across integrators, monitoring center operators, channel partners, and enterprise security buyers in APAC, EMEA, and the Americas, then used follow-ups to resolve gaps identified in the desk findings.
Distribution of primary research fieldwork respondents
| Company type | Respondent position | Region |
|---|---|---|
| Top tier: 34% | CXOs: 14% | APAC: 51% |
| Mid tier: 51% | Functional/Unit leaders: 29% | EMEA: 31% |
| Smaller Players: 15% | Managers: 57% | Americas: 18% |
Market-Sizing & Forecasting
Our sizing uses a top-down build where installed alarm system demand is reconstructed through monitored-site counts and monitoring penetration assumptions, and then translated into value using typical monthly fees and add-on service pricing. To keep the totals realistic, results are corroborated with selective bottom-up checks, such as rolling up sampled provider revenues, checking channel pricing, and validating implied revenue per monitored account.
Key inputs that shaped the model included monitored account volumes by major regions, the split of communication paths (cellular, IP, radio, and legacy wired), average monitoring fee ranges by customer type, churn and contract length patterns, and the share of interactive or video-verified monitoring add-ons that lift ARPU. For forecasting, scenario analysis was used because fee inflation, migration from legacy lines to cellular and IP, and false-alarm reduction programs can shift adoption at different speeds depending on local policy and insurance incentives. Where a bottom-up check had missing coverage, the gap was handled by scaling with regional monitored-site density and adjusting with interview-confirmed pricing bands.
Data Validation & Update Cycle
Outputs are checked through triangulation across multiple independent signals, including implied ARPU versus published price points, monitored-account density versus housing and commercial stock direction, and provider revenue growth versus macro service indicators. Any large variances are reviewed, assumptions are inspected line by line, and re-contacts are triggered when a variable moves outside the expected range or when a new market event changes adoption behavior.
Each report is refreshed annually, and interim updates are made when material shifts occur, such as a major regulatory change in communication pathways or a step-change in pricing. Before delivery, a final analyst review is completed so the numbers reflect the most recent data and the latest validation calls.
Mordor Intelligence's Alarm Monitoring Market Size Versus Other Published Estimates
Published totals for alarm monitoring do not always match because firms count slightly different revenue streams, and they also pick different base years and update points. In this market, the biggest differences usually come from whether standalone hardware is blended into the same number, how bundled smart security subscriptions are treated, and whether the estimate is aligned to a monitored-account demand pool or to broader electronic security spend.
Monitored account density and typical monthly fee checks, supported by interviews on bundled pricing and migration to IP and cellular pathways, are the evidence points that keep Mordor Intelligence's 2026 value tied to recurring monitoring and related contracted services rather than a wider security equipment total. Differences also show up when another publisher anchors on a 2022 or 2025 starting point, applies a single global ASP uplift without regional mix adjustments, or does not re-check implied ARPU against public price lists before finalizing the estimate.
Benchmark comparison
| Source | Market Size | Gaps in Research Methodology |
|---|---|---|
| Mordor Intelligence | USD 69.05 B (2026) | |
| Trade Journal A | USD 46.20 B (2022) | Uses an earlier base year and a broader framing that blends hardware with solutions, which can understate later-year subscription uplift from interactive and video-verified monitoring. |
| Industry Publication B | USD 59.97 B (2025) | Leans on a single base-year value with limited transparency on how monitoring-only revenue is separated from device bundles, and regional price and mix checks are not clearly evidenced in the public summary. |
The table shows that timing and scope choices explain most of the spread, not arithmetic differences. When the counted revenue is tied back to monitored-site demand and realistic fee bands, the resulting number is easier to trace, challenge, and refresh as adoption and pricing shift.


Key Questions Answered in the Report
How large is the alarm monitoring market in 2026?
The alarm monitoring market size reached USD 69.05 billion in 2026 and is forecast to hit USD 92.96 billion by 2031.
What is the expected CAGR for alarm monitoring solutions through 2031?
The market is projected to grow at a 6.13% CAGR over the 2026-2031 period.
Which region shows the fastest growth?
Asia Pacific is expected to register a 6.69% CAGR, outpacing all other regions.
Which application area is growing the quickest?
Smart-city infrastructure monitoring leads with a projected 7.05% CAGR to 2031.
How are insurance incentives influencing adoption?
Premium discounts of 5-20% make professionally monitored alarms cost-effective, accelerating uptake among residential and commercial customers.
Page last updated on:






