
Airport Passenger Boarding Bridges Market Size and Share
Market Overview
| Study Period | 2020 - 2031 |
|---|---|
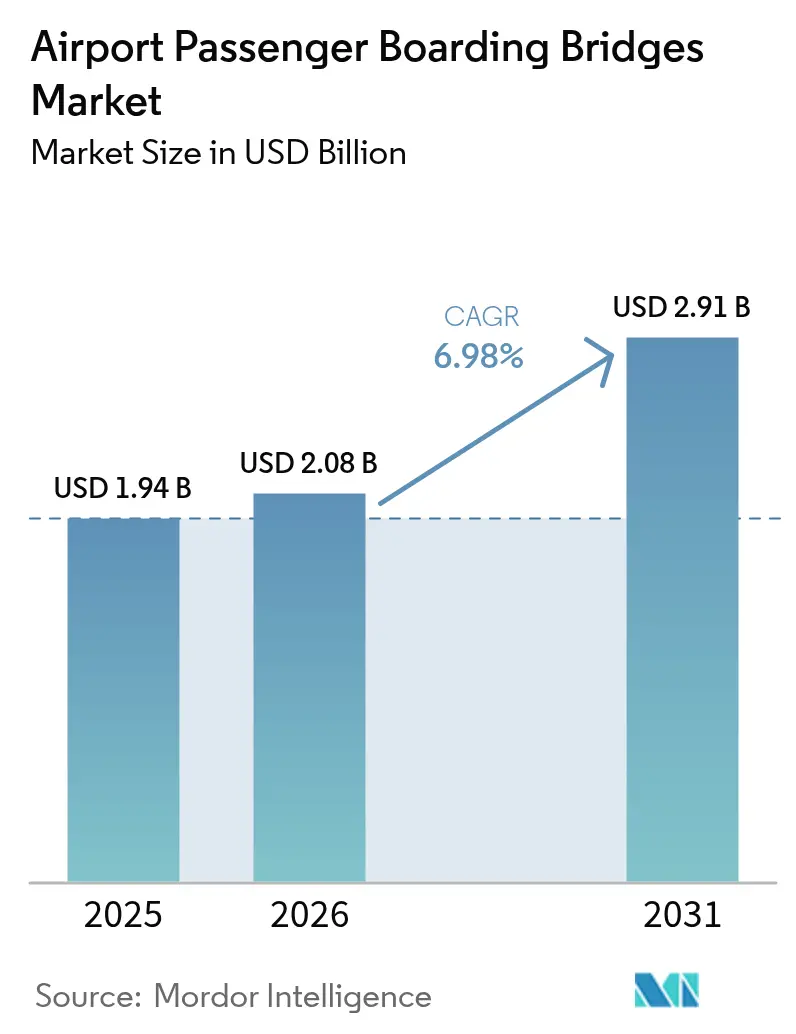
| Market Size (2026) | USD 2.08 Billion |
| Market Size (2031) | USD 2.91 Billion |
| Growth Rate (2026 - 2031) | 6.98 % |
| Fastest Growing Market | Asia Pacific |
| Largest Market | Asia Pacific |
| Market Concentration | Medium |
Major Players *Disclaimer: Major Players sorted in no particular order Image © Mordor Intelligence. Reuse requires attribution under CC BY 4.0. | |
Airport Passenger Boarding Bridges Market Analysis by Mordor Intelligence
The airport passenger boarding bridges market size was valued at USD 1.94 billion in 2025 and estimated to grow from USD 2.08 billion in 2026 to reach USD 2.91 billion by 2031, at a CAGR of 6.98% during the forecast period (2026-2031). Recovery in global air travel, combined with an unprecedented wave of terminal construction and expansion projects, underpins this acceleration. Asia-Pacific alone has more than USD 488 billion of airport development in the pipeline, and many legacy hubs in North America, Europe, and the Middle East are modernizing gates to meet stringent sustainability mandates. Electro-mechanical bridges that cut energy use and lifetime maintenance costs are steadily displacing hydraulic units. At the same time, airport operators increasingly emphasize passenger-experience features such as natural light and biometric readiness. Competitive dynamics favor manufacturers able to demonstrate life-cycle value, quick installation, and seamless systems integration, as airports increasingly assign procurement weight to total cost of ownership rather than first cost.
Key Report Takeaways
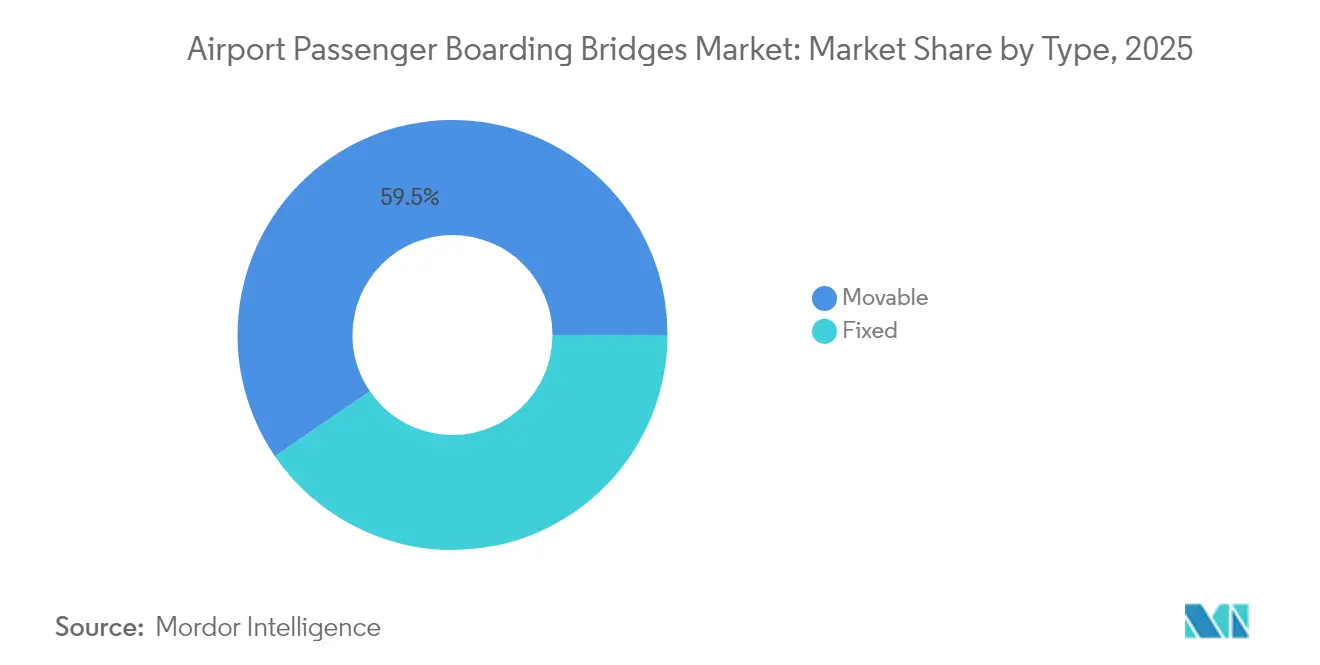
- By type, movable bridges held 59.53% of the airport passenger boarding bridges market share in 2025; the segment is expanding at an 8.29% CAGR through 2031.
- By model, apron-drive units led with 41.25% revenue share in 2025, while over-the-wing systems are set to advance at a 8.88% CAGR to 2031.
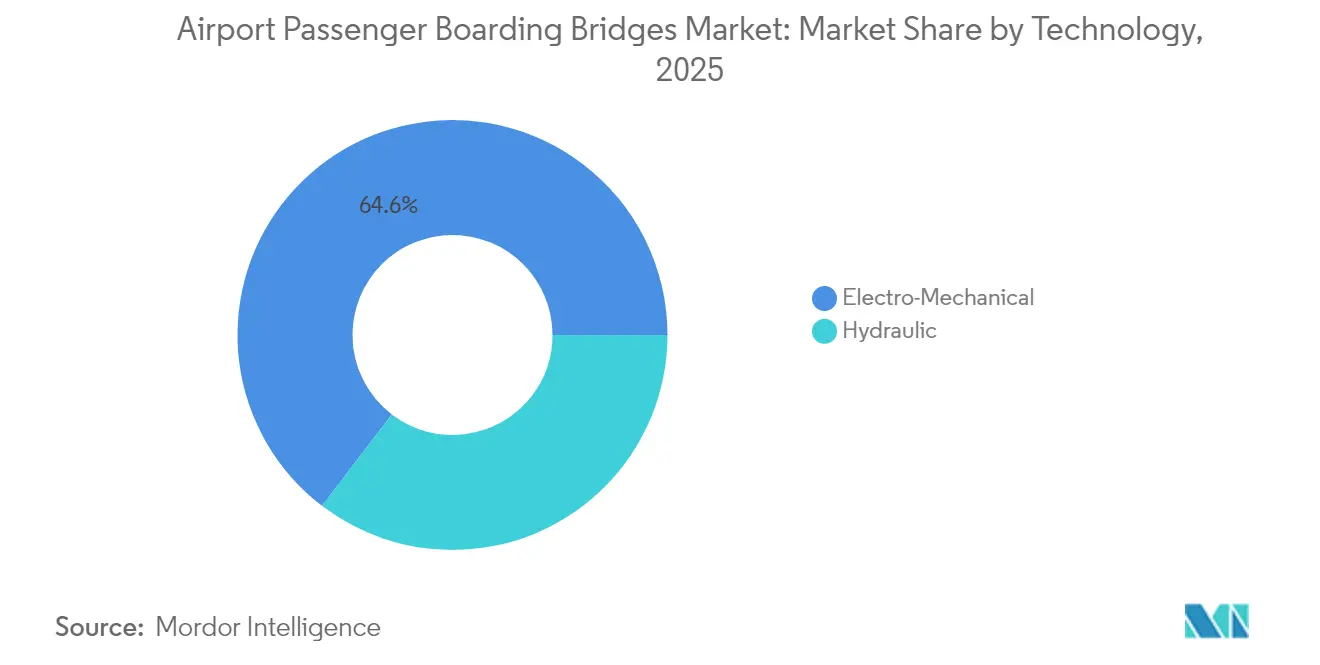
- By technology, electro-mechanical bridges accounted for 64.62% of the airport passenger boarding bridges market size in 2025 and will post an 7.96% CAGR through 2031.
- By structure, steel-walled designs retained 68.10% share in 2025; glass-walled alternatives are progressing at a 7.72% CAGR.
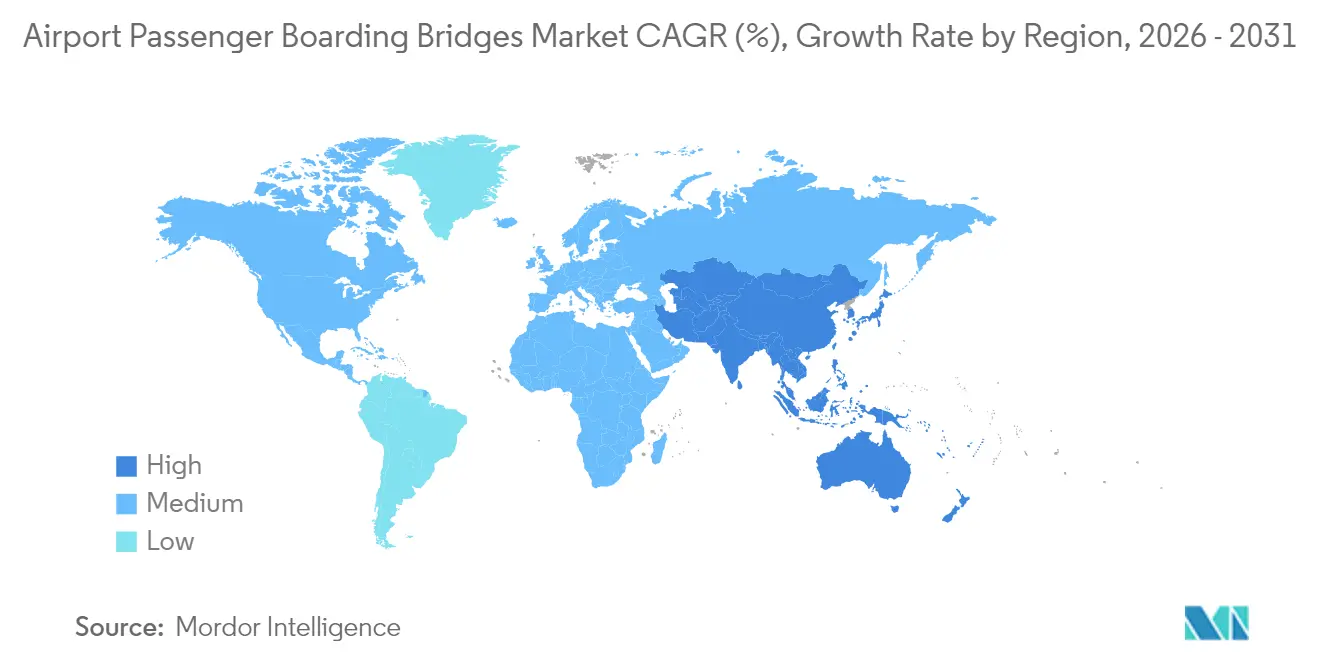
- By geography, Asia-Pacific commanded 31.45% of 2025 revenue and is projected to grow at an 8.66% CAGR to 2031.
Note: Market size and forecast figures in this report are generated using Mordor Intelligence’s proprietary estimation framework, updated with the latest available data and insights as of 2026.
Market Trends and Insights
Drivers Impact Analysis of Airport Passenger Boarding Bridges Market*
| Driver | (~) % Impact on CAGR Forecast | Geographic Relevance | Impact Timeline |
|---|---|---|---|
| Ongoing airport capacity expansion initiatives across global hubs | +2.1% | Global; highest in Asia-Pacific and Middle East | Medium term (2-4 years) |
| Surge in international and domestic air passenger volumes | +1.8% | Global; strongest in Asia-Pacific and Middle East | Short term (≤2 years) |
| Transition toward energy-efficient electro-mechanical boarding bridge systems | +1.4% | North America and EU lead; Asia-Pacific following | Medium term (2-4 years) |
| Growing integration of PBBs with biometric and automated boarding technologies | +0.9% | Global; early adoption in Middle East and developed markets | Long term (≥4 years) |
| Net-zero emission targets prompting replacement of legacy PBB infrastructure | +0.6% | EU and North America first; spreading worldwide | Long term (≥4 years) |
| Rising deployment of wide-body aircraft driving demand for dual-arm bridges | +0.5% | Global hubs | Medium term (2-4 years) |
| Source: Mordor Intelligence | |||
Ongoing Airport Capacity Expansion Programs Across Global Hubs
Global hubs inject multi-billion-dollar sums into terminal upgrades to relieve gate bottlenecks and comply with sustainability codes. Schiphol’s EUR 6 billion (USD 7.07 billion) five-year capital program focuses heavily on Pier C stand additions requiring new bridges. Munich Airport’s EUR 665 million (USD 783.89 million) Terminal 1 pier stretches 360 m and adds multiple new boarding positions. In the United States, FAA-backed megaprojects at John Glenn International, Tampa, and Pittsburgh exceed USD 1 billion and collectively translate into dozens of bridge orders. Asia-Pacific projects such as Long Thanh International in Vietnam and Changi Terminal 5 in Singapore will each deploy several hundred bridges during phased construction. The cadence of these expansions provides sustained, forecastable demand for manufacturers across the airport passenger boarding bridges market.
Surge in International and Domestic Air Passenger Volumes
Passenger throughput rebounded sharply in 2024 and is expected to cross pre-pandemic peaks in 2025 at many hubs, exerting pressure on gate infrastructure. Groupe ADP recorded 363.7 million travellers in 2024, an 8.1% annual jump. Asia-Pacific traffic is projected to hit 2.9 billion by the mid-2030s, nearly tripling today’s levels. Airlines now factor guaranteed bridge access into route economics, and some operators charge premium rates for jet-way use, improving payback for new installations. As passenger peaks intensify, airports accelerate bridge procurement to avoid stand conflicts and to shorten turnaround times—direct catalysts for growth in the airport passenger boarding bridges market.
Transition Toward Energy-Efficient Electro-Mechanical Systems
Electro-mechanical drives lower energy consumption and simplify maintenance relative to hydraulic units, aligning with climate-related operating targets. HÜBNER Group’s Passenger Boarding Bridge Interface 2.0 introduces tilt-correction and touchless flooring to reduce component wear and operator intervention.[1] The White House Council on Supply Chain Resilience has highlighted domestic sourcing of transportation infrastructure as a strategic priority, encouraging US airports to adopt locally built electro-mechanical bridges. Net-zero frameworks across Europe equally mandate deeper reductions in gate power draw, encouraging replacements of legacy stock with high-efficiency alternatives. These policies create a structural tailwind for electro-mechanical penetration and reinforce pricing discipline across the airport passenger boarding bridges market.
Growing Integration of Biometric and Automated Boarding Technologies
Bridges are becoming physical touchpoints for seamless passenger identity confirmation. Zayed International’s Terminal A embeds biometric validation at nine locations along the departing journey, including the bridge-to-aircraft interface. National Safe Skies Alliance guidance positions fingerprint, iris, and facial recognition as integral to next-generation e-gates, driving demand for bridges pre-wired for sensors and data backhaul. Airports aim to cut boarding agents and tighten security simultaneously, placing technology readiness squarely in procurement specifications and opening new differentiation avenues for suppliers within the airport passenger boarding bridges market.
Restraints Impact Analysis of Airport Passenger Boarding Bridges Market*
| Restraint | (~) % Impact on CAGR Forecast | Geographic Relevance | Impact Timeline |
|---|---|---|---|
| Significant initial investment required for boarding bridge installations | -1.2% | Global; more acute in emerging markets | Short term (≤2 years) |
| High maintenance complexity and total lifecycle cost burdens | -0.8% | Global; challenging for aging infrastructure | Medium term (2-4 years) |
| Supply chain risks associated with specialized hydraulic components | -0.5% | Global, with higher impact in remote locations and emerging markets | Medium term (2-4 years) |
| Infrastructure limitations due to outdated apron and gate configurations at older terminals | -0.4% | North America and Europe legacy airports, select APAC hubs | Long term (≥ 4 years) |
| Source: Mordor Intelligence | |||
Significant Initial Investment Required for Boarding Bridge Installations
Single bridges cost USD 750,000–1 million, creating budget friction for smaller airports and public-sector owners reliant on constrained capital plans. Arizona’s State Aviation System Plan lists USD 8.7 billion of facility needs over 20 years, with passenger boarding bridges a sizeable line item. The result is staggered procurement schedules or reduced scope, especially in cost-sensitive emerging markets, slowing near-term penetration in the airport passenger boarding bridges market.
High Maintenance Complexity and Total Life-Cycle Cost Burdens
Hydraulic seals, telescoping tunnels, and alignment drives impose specialized upkeep demands. Brussels Airport’s EUR 40 million (USD 47.15 million) replacement of 28 bridges aged beyond 25 years underscores the expensive tipping point at which maintenance eclipses replacement.[2] Airports juggling multiple bridge brands must stock spare parts and train technicians on disparate control systems. These realities push operators to analyze life-cycle cost in depth and prefer standardized fleets, creating opportunities for service-oriented manufacturers while restraining overall growth.
*Our forecasts treat driver/restraint impacts as directional, not additive. The impact forecasts reflect baseline growth, mix effects, and variable interactions.
Airport Passenger Boarding Bridges Market Segment Analysis
By Type:
Movable Bridges Deliver Operational FlexibilityMovable boarding bridges generated 59.53% of 2025 revenue and are forecast to compound at 8.29% annually. Their ability to align with diverse aircraft—from regional jets to Code F wide-bodies—enables airports to widen gate utilisation without structural overhauls. Fixed bridges, although cheaper, remain suited to gates dedicated to a single aircraft family. Movable variations now integrate automated docking, collision-avoidance radar, and condition-based maintenance tools, further widening the value gap. At Key West International, eight new glass-clad movable bridges costing USD 1 million each opened in April 2025, eliminating ground-level boarding and increasing turnaround predictability.
Bridge manufacturers tailor telescopic ranges up to 36 m and elevation spans exceeding 8 m to cover the majority of global fleets. As a result, the airport passenger boarding bridges market size attributable to movable systems will rise from USD 1.16 billion in 2025 to roughly USD 1.87 billion by 2031, sustaining an outsized contribution to revenue and installed base expansion. Airports in Asia-Pacific and the Middle East, where fleet mix often changes hour-by-hour, assign premium tenders to suppliers that can validate broad aircraft compatibility. With net-zero agendas adding demand for energy-optimised operations, movable units incorporating regenerative drives or on-bridge photovoltaic panels stand to capture an additional share within the airport passenger boarding bridges market.

By Model:
Apron-Drive Dominance and Over-the-Wing MomentumAt the stand level, apron-drive bridges, positioned on rotundas, controlled 41.25% of the 2025 turnover. Their robust steel truss, dual telescoping bodies, and rotunda rotation up to 180 degrees make them the workhorse for large-gate layouts worldwide. Yet Over-the-Wing (OTW) bridges are accelerating at 8.88% CAGR, spurred by regional jet proliferation and stand-constrained projects in Japan and India. OTW units mount behind the wing root, freeing a contiguous stand for baggage and catering vehicles.
Dual-boarding configurations also scale, where A350-1000s, B777-9s, and A380s dominate traffic banks. San Francisco International’s dual-level gates enable simultaneous upper- and lower-deck entry, cutting boarding time by almost 40%. Although niche in volume, such specialized models command high ASPs that lift segment revenue. Overall, the airport passenger boarding bridges market continues to diversify its model mix, mapping bridge geometry to fleet planning and terminal flow objectives.
By Technology:
Electro-Mechanical Systems Capture Efficiency GainsElectro-mechanical drives captured 64.62% share in 2025 and are on course for an 7.96% CAGR. They replace hydraulic pumps with gear motors and screw jacks, eliminating oil spill risks and trimming energy draw by as much as 30%. Lifecycle service contracts benefit from predictive analytics, which can interrogate motor torque and temperature in real time. Seen across hubs pursuing carbon budgets, this transition will push the market size contribution of the airport passenger boarding bridges from electro-mechanical models to about USD 1.98 billion by 2031.
Hydraulic units will persist in areas with extreme ambient temperature swings or limited power supply. Yet, new value propositions such as reversible drive-regeneration or battery-backup docking modes are tilting customer preference. Policy incentives under the EU Green Deal and the US Inflation Reduction Act reinforce purchasing equipment, materially reducing Scope 2 emissions, lifting electromechanical adoption further inside the airport passenger boarding bridges market.
By Structure:
Steel-Walled Reliability Meets Glass-Walled Passenger ExperienceSteel-walled bridges comprised 68.10% of 2025 sales thanks to ruggedness, lower first cost, and compatibility with diverse climates. However, glass-walled units are winning projects at premium terminals where natural light, airfield views, and brand image command weight. Brussels Airport and Schiphol have each pivoted to floor-to-ceiling glazed tunnels that enhance way-finding and reduce perceived waiting time. Changi Terminal 5’s design brief similarly specifies high-transparency boarding corridors.
Thermal performance coatings, laminated safety panes, and smart-tint technology mitigate the glare and heat-load challenges historically associated with glass. As LED lighting and HVAC are embedded into bridge ceilings, utilities can be fine-tuned, cutting operating cost differences with steel. Given these trends, the glass segment’s contribution to the airport passenger boarding bridges market will double between 2026 and 2031, while steel remains foundational for rugged or cost-driven deployments.
Geography Analysis
APAC Airport Passenger Boarding Bridges Market
Asia-Pacific accounts for 31.45% of 2025 revenue and is projected to post the fastest 8.66% CAGR through 2031. China targets more than 270 commercial airports by 2025, and India plans 220 new facilities by 2035, guaranteeing sustained procurement cycles. Vietnam alone expects 30 new airports to serve 653 million passengers by 2030, a scenario that will swell the airport passenger boarding bridges market size on the sub-regional level. Simultaneously, mega-projects like Long Thanh International and Changi Terminal 5 each incorporate bridge counts in the high hundreds, setting scale benchmarks across the market.
North America Airport Passenger Boarding Bridges Market
North America’s outlook pivots on replacement and modernization. The FAA allocated USD 289 million in 2025 Airport Infrastructure Grants to 129 US airports, many earmarked for passenger boarding bridge programs. JFK’s USD 4.2 billion Terminal 6 will field 10 gates sized for wide-body aircraft, while Pittsburgh, Tampa, and Boston airports embed bridge enhancement inside multi-billion redevelopment packages. Sustained spend on life-cycle upgrades keeps the region critical to global vendor order books even as greenfield construction slows.
Europe Airport Passenger Boarding Bridges Market
Europe maintains steady demand via renewal and sustainability retrofits. Schiphol’s Pier upgrades, Munich’s new T1 satellite, and Heathrow’s GBP 2.3 billion (USD 3.13 billion) two-year acceleration plan include bridge modernizations to align with net-zero ops. EU regulations on energy performance further channel purchases toward electro-mechanical platforms, deepening unit values within the airport passenger boarding bridges market.
MEA Airport Passenger Boarding Bridges Market
The Middle East is witnessing outsized bridge requirements at giga-projects. Dubai’s USD 35 billion Al Maktoum expansion foresees 400 stands equipped with more than 800 bridges, while Saudi Arabia’s King Salman International plots a multistage rollout to 120 million passengers by 2030. Zayed International’s biometric-ready bridges highlight the region’s swift move toward tech-integrated infrastructure. Across Africa, growth is led by Addis Ababa and Nairobi expansions, though volumes remain smaller.
Regulatory Landscape
Passenger boarding bridges (PBBs) are shaped by overlapping airside safety, equipment design, and airport engineering requirements that flow into procurement specifications and acceptance testing. In the United States, FAA Advisory Circular AC 150/5220-21C is a key reference for aircraft boarding equipment performance, maintenance, and operational expectations, while airports also embed owner standards in engineering guidelines covering bridge geometry, clearances, utilities, and integration with gate systems.
In Europe, EN 12312-4:2024 updates technical and safety requirements for PBBs across commissioning, operation, and maintenance. That affects how OEMs document intended use, safety functions, and automation-related hazard controls for new installations. At the interface level, ISO 7718-1:2025 updates international requirements for passenger door connections between civil transport aircraft and boarding bridges (or transfer vehicles), pushing buyers and suppliers toward interoperability with newer aircraft fleets, tighter configuration control, and more formal operating procedures, including competency and permit systems referenced in regional ACI guidance.
Value Chain Analysis
The value chain begins with raw materials (steel, aluminum, glazing systems) and moves into fabrication of tunnels, rotundas, and truss structures, plus specialized subsystems such as electro-mechanical drives, sensors, electronic control units, and docking and alignment aids. OEMs (such as TK Airport Solutions, CIMC Tianda, ShinMaywa, and ADELTE) typically lead design engineering and system integration, then coordinate on-site installation with airport contractors to connect power, controls, VDGS interfaces, and terminal IT and communications for biometric or automated-boarding readiness.
Downstream, commissioning, training, and lifecycle service drive total-cost performance because bridges operate under tight turnaround and uptime constraints. Procurement is increasingly oriented around long-term operations and maintenance arrangements and multi-party consortia. Riyadh Airports Company’s five-year contract award to Saudi Ground Services in consortium with Jusoor for operation and maintenance of PBBs at King Khalid International Airport (announced April 2026) illustrates this structure. Large greenfield procurements also pull in multiple supplier and service tiers, as seen in the Port Polska program in Poland where the tender process advanced with multiple bidders for 92 PBBs (application phase concluded February 2026), reinforcing the role of competitive qualification, local execution capability, and through-life support in vendor selection.
Competitive Landscape
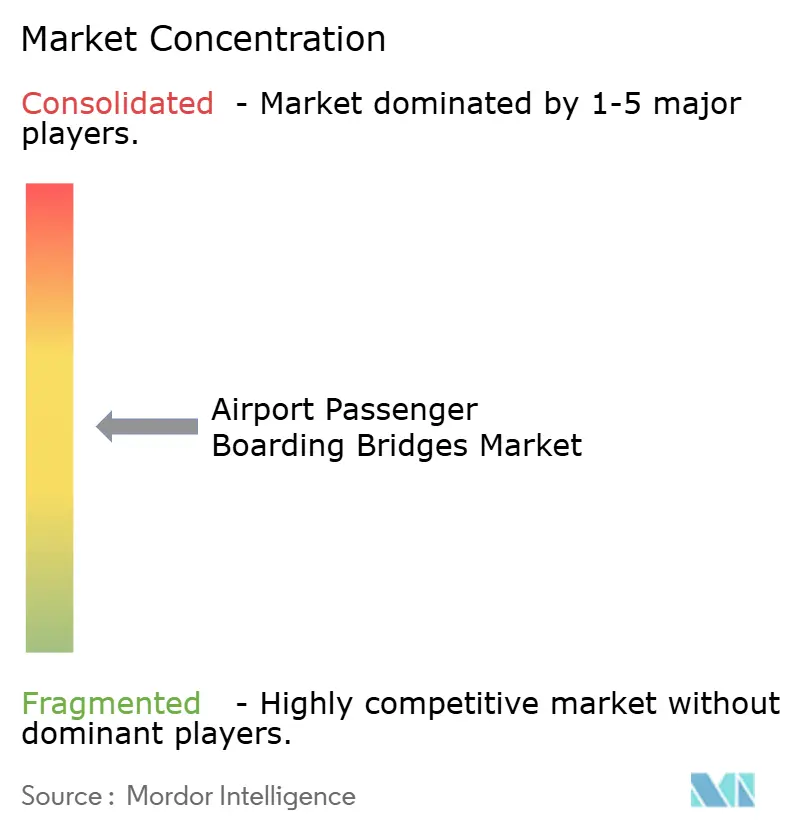
The market shows moderate concentration anchored by global leaders such as ADELTE GROUP SL., CIMC Tianda Holdings Co., Ltd., TK Airport Solutions S.A., Oshkosh Corporation, and ShinMaywa Industries, Ltd. Players differentiate through electromechanical expertise, remote diagnostics, and biometric-integration frameworks rather than pure price. HÜBNER’s Interface 2.0 platform adds tilt-correction and touchless slide floors, concurrently addressing uneven ramp surfaces and hygiene concerns.
Regional specialists secure share via logistics agility: ShinMaywa installs automated bridges across Southeast Asia with a 60% local share, leveraging proximity and tailored after-sales models. CIMC-Tianda exploits vertical integration in fabrication and controls to compete aggressively in China’s vast public-tender market. Service contracts are turning decisive; airports stipulate guaranteed uptime levels, with penalties for outages, pushing manufacturers toward long-term maintenance partnerships that cement customer stickiness in the airport passenger boarding bridges market.
Strategic activity since 2024 includes partnerships between bridge makers and biometric firms, aiming to bundle identity hardware inside bridge ceilings. Component suppliers focus on low-emission motor drives and quick-splice power rails that shorten installation by up to 20%. More than installed-base legacy, technological convergence, and life-cycle value delivery now govern competitive advantage.
Airport Passenger Boarding Bridges Industry Leaders
-
CIMC Tianda Holdings Co., Ltd.
-
ShinMaywa Industries, Ltd.
-
Oshkosh Corporation
-
TK Airport Solutions S.A.
-
ADELTE GROUP S.L.
- *Disclaimer: Major Players sorted in no particular order
Airport Passenger Boarding Bridges Market Companies Covered in this Report
- ADELTE GROUP S.L.
- CIMC Tianda Holdings Co., Ltd.
- Oshkosh Corporation
- ShinMaywa Industries, Ltd.
- HÜBNER GmbH & Co. KG
- UBS Airport Systems
- Vataple Group
- PT Bukaka Teknik Utama Tbk
- Aviramp Ltd.
- Dabico Airport Solutions
- TK Airport Solutions S.A.
- ACCESSAIR Systems Inc.
- AviaSafe GmbH
- Jiangsu Tianyi Aviation Industry Co., Ltd.
- J&D McLennan Ltd.
- Mitsubishi Heavy Industries Ltd.
Read Analysis of Airport Passenger Boarding Bridges Companies
Market Opportunities and Future Outlook
A key opportunity is bundling bridges with the modernization packages airports are already executing at scale, including terminal openings, new concourses, and gate expansions that increasingly specify bridge features beyond basic boarding. These packages add electro-mechanical drives, glass-walled passenger experience elements, and pre-wiring for automated docking and digital systems. In-scope evidence includes the opening of a new terminal at Montreal Metropolitan Airport (YHU) in June 2026 with nine passenger boarding bridges, and the progression of major US gate programs such as Tampa International Airport, where Airside D advanced with an approved final design and a USD 902 million supplemental contract (February 2026) that includes glass boarding bridges.
Another white-space area is automation and remote-assist docking, as airports look to reduce manual interventions, tighten safety controls, and shorten turnarounds while managing operator availability. Technical work on autonomous docking architectures, including aircraft door detection and kinematics-based guidance, supports differentiation for OEMs in auto-docking, collision avoidance, and sensor-ready bridge interfaces. This aligns with ongoing large tenders such as Poland’s Port Polska procurement for 92 bridges that includes maintainability and long-term support expectations, keeping demand anchored in bridges delivered as integrated gate systems with serviceability, digital readiness, and lifecycle performance guarantees rather than stand-alone equipment purchases.
Recent Industry Developments in Airport Passenger Boarding Bridges Market
- March 2026: Centralny Port Komunikacyjny advanced the Port Polska airport procurement for 92 passenger boarding bridges by concluding the initial application phase for a tender covering design, supply, and maintenance. The scale and inclusion of maintenance requirements raises qualification thresholds and favors suppliers with proven installation capacity and long-term support networks.
- April 2025: CIMC Tianda completed delivery of 102 passenger boarding bridges for Terminal T5 of Xi’an Xianyang International Airport. The program highlights how large single-terminal packages can translate into high-volume orders and accelerate adoption of standardized bridge fleets at major hubs.
- August 2024: ShinMaywa Industries launched a new barrier-free passenger boarding bridge model aimed at reducing ramp and step heights for improved accessibility. The product release supports airports updating gate infrastructure to accommodate wider mobility needs and influences specification shifts toward inclusive bridge design features.
Airport Passenger Boarding Bridges Market Report Scope and Research Methodology
Market Definition and Coverage
For this study, the market covers airport passenger boarding bridges that physically connect terminal gates to aircraft doors, and it is measured as the value of systems supplied for new installations and replacements across commercial airports.
Scope exclusions: We do not count unrelated passenger-handling hardware like terminal buses, boarding ramps, or baggage and security systems.
Segments Covered in This Report
- By Type
- Movable
- Fixed
- By Model
- Apron-Drive Bridge
- Commuter Bridge
- Nose-Loader Bridge
- Over-the-Wing Bridge
- T-Bridge
- By Technology
- Electro-Mechanical
- Hydraulic
- By Structure
- Steel-Walled
- Glass-Walled
- By Region
- North America
- United States
- Canada
- Mexico
- Europe
- United Kingdom
- France
- Germany
- Rest of Europe
- Asia-Pacific
- China
- India
- Japan
- Australia
- Rest of Asia-Pacific
- South America
- Brazil
- Rest of South America
- Middle East and Africa
- Middle East
- Saudi Arabia
- United Arab Emirates
- Qatar
- Rest of Middle East
- Africa
- South Africa
- Rest of Africa
- Middle East
- North America
Data Sources, Market Sizing, and Validation
Desk Research
We start by mapping how many gates and aircraft stands are being added or upgraded, and then we connect that pipeline to typical bridge fitment rates. Public sources used for this step include airport capital plans and statistics from bodies such as Airports Council International, FAA airport data and planning documents, ICAO air transport indicators, and IATA traffic outlook material, along with customs and trade codes where available for equipment movement.
To keep assumptions realistic, we also review company annual reports and investor presentations, airport operator procurement notices, and reputable aviation press on terminal modernization and gate expansion programs. A limited set of paid subscriptions is used for company financials and news tracking, patent lookups for bridge features, and tender monitoring that signals timing and scale of deployments. The sources listed here are illustrative only, and many other references were used to collect, validate, and clarify data points during the study.
Primary Interviews and Surveys
Next, we validate the demand pipeline and price logic through expert calls and structured surveys with airport engineering and operations teams, ground-handling and terminal contractors, and bridge suppliers and integrators. Since this is a global market, inputs are checked across major buildout regions so that replacement cycles, electrification choices, and lead times are captured before final assumptions are locked.
Distribution of primary research fieldwork respondents
| Company type | Respondent position | Region |
|---|---|---|
| Top tier: 34% | CXOs: 13% | APAC: 40% |
| Mid tier: 52% | Functional/Unit leaders: 38% | EMEA: 34% |
| Smaller Players: 14% | Managers: 49% | Americas: 26% |
Market-Sizing & Forecasting
Sizing begins with a top-down build where airport expansion and modernization programs are translated into addressable gate additions and retrofits, and then converted into bridge demand using fitment rates by airport size and aircraft mix. Only after the demand pool is formed do we apply value assumptions, which are informed by bridge type and configuration patterns seen in projects.
Key inputs in the model include airport passenger traffic growth, terminal and gate capacity additions, the share of contact gates versus remote stands, replacement timing tied to bridge age and reliability, and the mix shift toward electrified and energy-efficient bridge systems. Pricing is handled through a practical average selling price range, adjusted for model complexity (such as dual systems or apron-drive setups), local installation effort, and typical contract packaging.
For forecasting, scenario analysis is used so the outlook can flex with changes in airport capex cycles, delivery delays, and traffic recovery paths, and then it is pressure-tested with expert expectations on procurement timing. Bottom-up checks are run selectively by sampling visible projects and multiplying expected bridge counts by typical contract values, and gaps are handled by using conservative assumptions when project details are unclear and then revisiting them during validation calls.
Data Validation & Update Cycle
Outputs are checked against independent signals such as announced gate counts, airport capex budgets, and observed ordering patterns, and then variances are investigated before numbers are finalized. If a region shows an unexpected jump, we re-check project pipelines, currency timing, and price assumptions, and we may re-contact sources when the explanation is not clean.
A second analyst review is completed to confirm that definitions, units, and math are consistent across regions and years. Reports are refreshed annually, and interim updates are made when material events occur, such as major terminal program changes or procurement slowdowns. Before delivery, a fresh pass is done so clients receive the most recent view supported by the same repeatable steps.
Mordor Intelligence's Airport Passenger Boarding Bridge Market Size Measured Against Other Published Estimates
Published market sizes for passenger boarding bridges can look far apart because the included spend is not always the same, and the year used as the starting point also changes. Differences typically come from whether refurbishment services are bundled, how multi-gate terminal programs are timed, and how pricing is converted across currencies.
Some estimates also roll adjacent airport systems into the same total or treat long-term framework contracts as if all value lands in one year. For Mordor Intelligence, the market is counted only when it is tied to passenger boarding bridge equipment and associated installation value at airports, and then it is spread based on project timing signals and replacement cycles rather than booked contract headlines.
Benchmark comparison
| Source | Market Size | Gaps in Research Methodology |
|---|---|---|
| Mordor Intelligence | USD 2.08 B (2026) | |
| Global Consultancy A | USD 2.12 B (2024) | Uses a 2024 base year and a broader spend capture that can include a wider set of gate-interface items in some segment cuts, which can lift totals versus equipment-only counting in certain airports. |
| Industry Research Group B | USD 2.06 B (2024) | Anchors the value to a 2024 base and can rely more heavily on stated CAGR projection from the base without clearly tying annual values to gate-addition timing and replacement cadence, which shifts the year-by-year market size. |
Across the three figures, most of the spread is explained by base-year choice and how strictly the spending is limited to boarding bridge equipment plus installation versus wider airport-gate packages. When the demand pool is rebuilt from gate additions, contact-gate share, and replacement timing, the resulting totals stay easier to track and replicate during an update.
Key Questions Answered in the Report
What is the current value of the airport passenger boarding bridges market?
The market is worth USD 2.08 billion in 2026 and is projected to grow to USD 2.91 billion by 2031, reflecting a 6.98% CAGR. .
Which bridge type is most widely installed?
Movable bridges dominate, holding 59.53% of 2025 revenue and growing faster than the overall market at an 8.29% CAGR.
Why are electro-mechanical bridges gaining share?
They lower energy consumption and maintenance costs, aligning with airport sustainability targets and pushing their share to 64.62% in 2025.
Which region will see the fastest bridge demand growth?
Asia-Pacific leads with an 8.66% CAGR through 2031, propelled by massive greenfield construction in China, India, and Southeast Asia.
How are airports integrating biometrics with boarding bridges?
New bridges are being delivered pre-wired for facial or iris-recognition sensors, letting airports merge identity verification with gate boarding to speed passenger flow.
What are the main barriers to wider adoption of boarding bridges?
High upfront capital expense and complex lifetime maintenance remain key challenges, especially for smaller or emerging-market airports.