
Aircraft Auxiliary Power Unit Market Size and Share
Market Overview
| Study Period | 2020 - 2031 |
|---|---|
| Market Size (2026) | USD 3.19 Billion |
| Market Size (2031) | USD 3.81 Billion |
| Growth Rate (2026 - 2031) | 3.59 % |
| Fastest Growing Market | Asia Pacific |
| Largest Market | North America |
| Market Concentration | Medium |
Major Players *Disclaimer: Major Players sorted in no particular order Image © Mordor Intelligence. Reuse requires attribution under CC BY 4.0. | |
Aircraft Auxiliary Power Unit Market Analysis by Mordor Intelligence
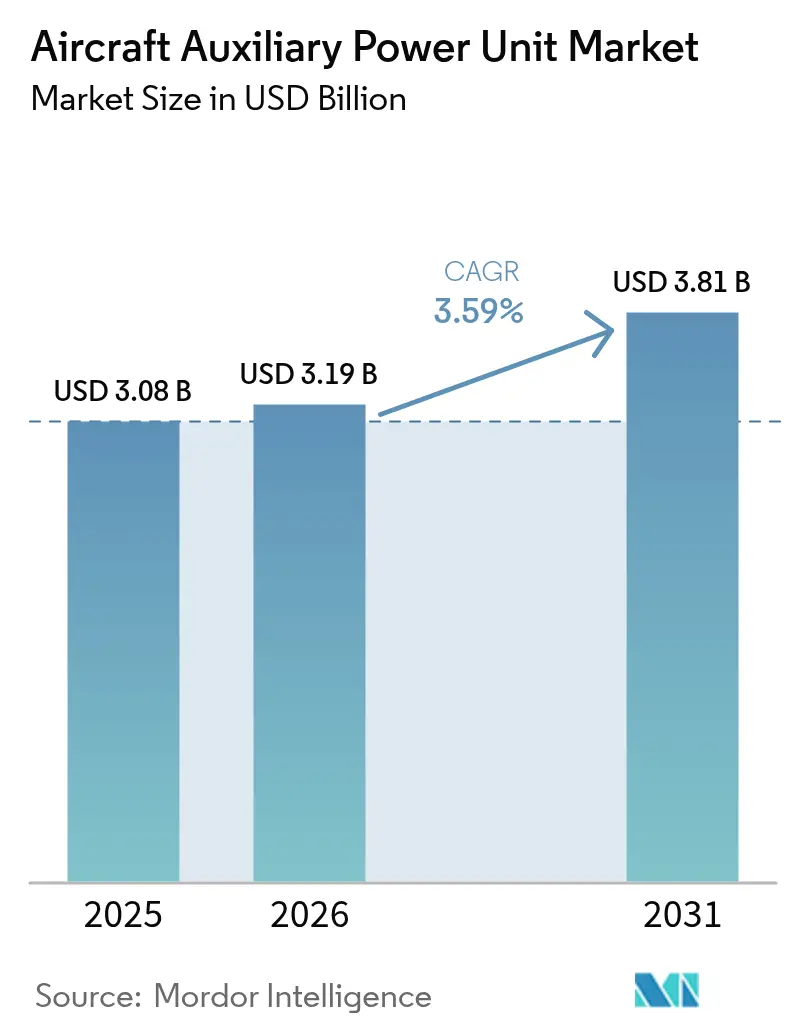
The aircraft auxiliary power unit (APU) market size is expected to grow from USD 3.08 billion in 2025 to USD 3.19 billion in 2026 and is forecast to reach USD 3.81 billion by 2031 at 3.59% CAGR over 2026-2031. Moderate expansion stems from airlines shifting toward electrified and hydrogen-ready systems while regulators tighten ground-emissions rules that favor gate-supplied electricity over onboard APUs. Airports enforcing APU-off policies cut ramp emissions up to 50% whenever fixed electrical ground power is available. Commercial airlines command volume through single-aisle deliveries, militaries accelerate technology needs in rotary-wing upgrades, and rising UAV procurement widens demand for micro-rated units. Fuel-cell prototypes gain momentum as Airbus validates hydrogen APUs and Honeywell races to certify 100% sustainable aviation fuel across its conventional line. Meanwhile, supply chain exposure to rare-earth restrictions forces Western OEMs to redesign generators and diversify sourcing.
Key Report Takeaways
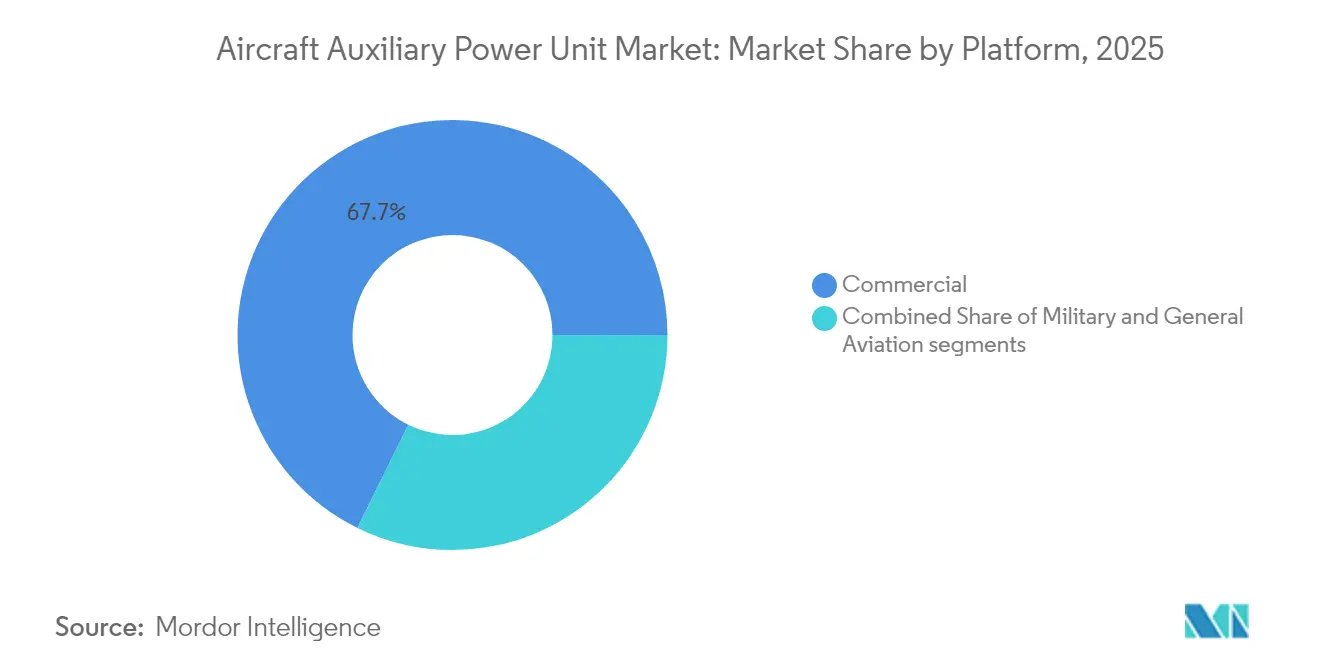
- By platform, commercial aviation led with 67.72% revenue share in 2025, while the military segment is projected to expand at 4.55% CAGR through 2031.
- By aircraft type, fixed-wing platforms accounted for 80.12% of the aircraft auxiliary power unit market share in 2025, and rotary-wing fleets are set to grow at 3.78% CAGR to 2031.
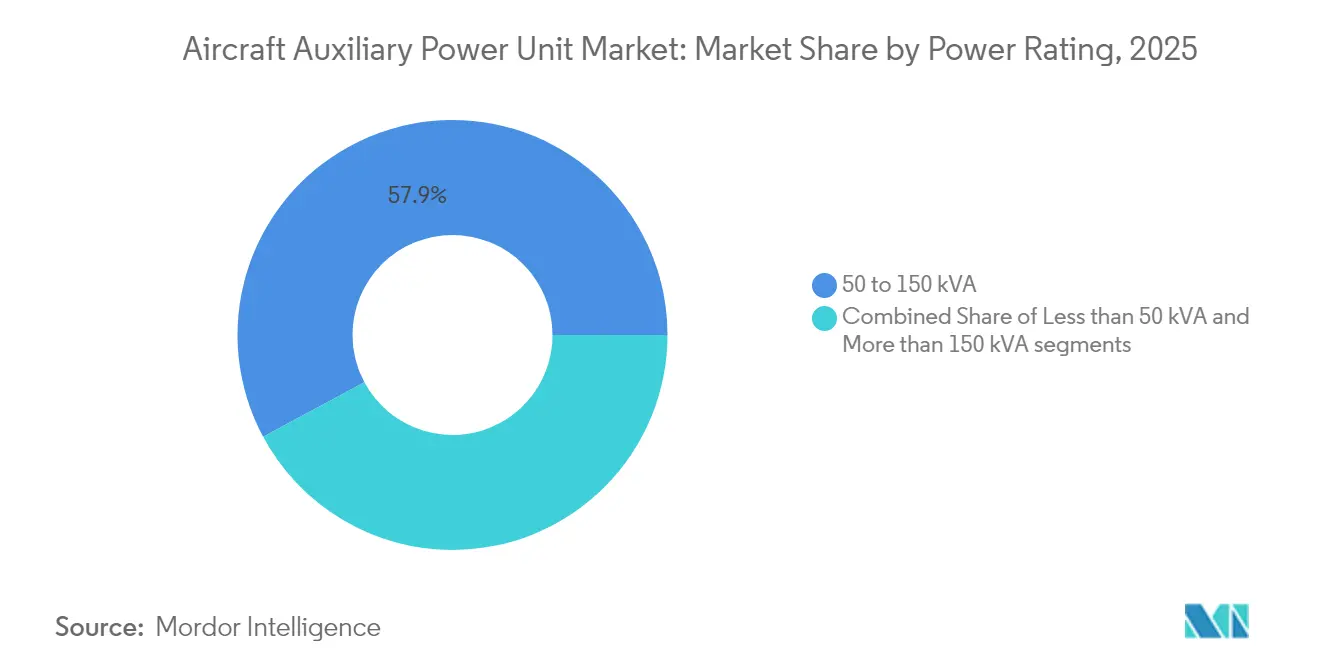
- By power rating, the 50 to 150 kVA class commanded a 57.85% share of the aircraft auxiliary power unit market in 2025, whereas less than 50 kVA units are forecasted to rise at a 5.23% CAGR.
- By technology, conventional turboshaft systems remained dominant, with a 89.62% share in 2025, but fuel-cell solutions are pacing the field at a 6.03% CAGR.
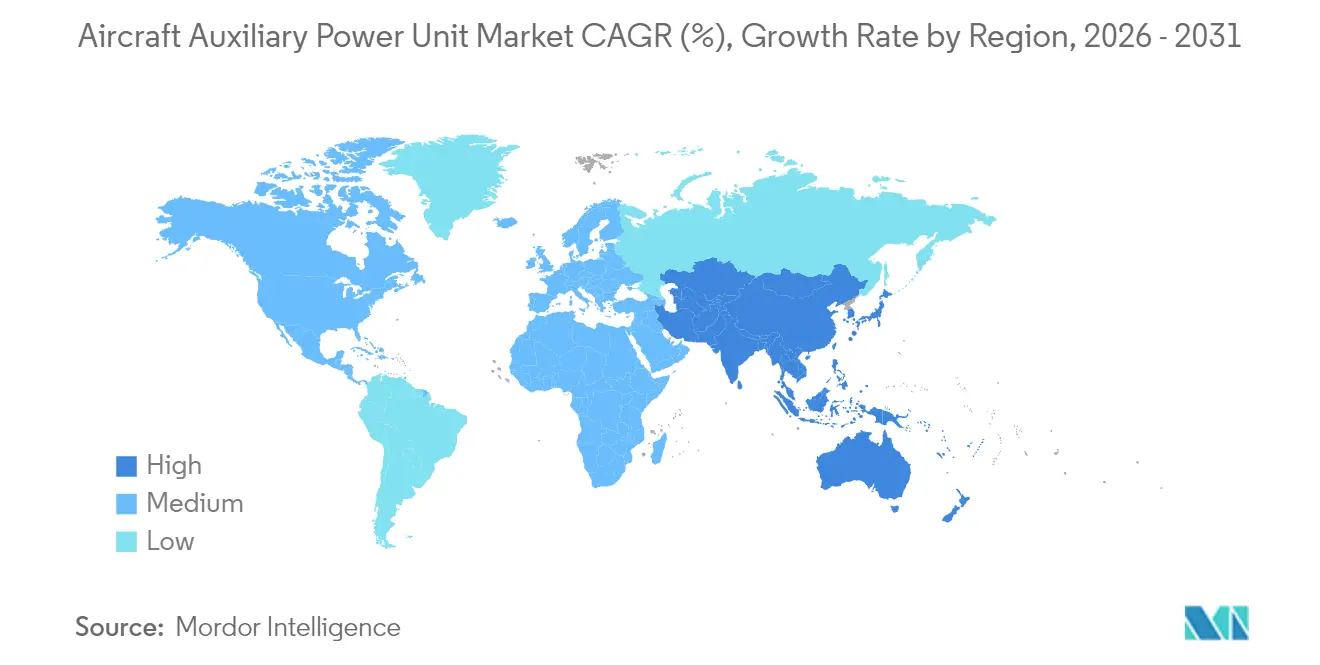
- By region, North America captured 32.35% revenue in 2025 and Asia-Pacific is advancing fastest at 5.22% CAGR on the back of the C919 and Indian fleet expansion programs.
Note: Market size and forecast figures in this report are generated using Mordor Intelligence’s proprietary estimation framework, updated with the latest available data and insights as of 2026.
Market Trends and Insights
Drivers Impact Analysis of Aircraft Auxiliary Power Unit Market*
| Driver | (~) % Impact on CAGR Forecast | Geographic Relevance | Impact Timeline |
|---|---|---|---|
| Increased deliveries of next-gen fuel-efficient narrowbody aircraft | +0.8% | North America, Asia-Pacific | Medium term (2–4 years) |
| Rising retrofit activity due to regulatory mandates on APU-off operations | +0.6% | Europe, North America | Short term (≤ 2 years) |
| Expansion of military UAV fleets in high-threat environments | +0.4% | North America, Europe, Middle East | Long term (≥ 4 years) |
| Electrification of ground operations driving adoption of e-APUs | +0.5% | Europe, North America | Medium term (2–4 years) |
| Emergence of commercial spaceplanes creating demand for micro-APUs | +0.2% | North America, Europe | Long term (≥ 4 years) |
| Integration of APUs into hybrid-electric propulsion architectures | +0.3% | Europe, North America | Long term (≥ 4 years) |
| Source: Mordor Intelligence | |||
Increased Deliveries of Next-Gen Fuel-Efficient Narrowbody Aircraft
China’s commercial fleet is expected to double to 9,740 aircraft by 2043, underscoring the sustained demand for APUs optimized for single-aisle operations. Airlines such as Air Arabia selected 131 Honeywell 131-9A units for A320neo aircraft to secure 1-2% fuel savings in High Efficiency Mode.[1] Compact architectures emphasizing rapid starts and minimal thermal loads suit higher-cycle narrowbody schedules. Synergies with LEAP engines enhance dispatch reliability as carriers replace legacy CFM56 fleets. This delivery wave underpins line-fit revenue and a growing spares pipeline for the aircraft auxiliary power unit market.
Rising Retrofit Activity Due to Regulatory APU-Off Mandates
European hubs now enforce electrical ground power use during turnarounds, forcing carriers to upgrade legacy jets with compatible interface kits rather than procure new APUs. Qatar Airways secured the region’s first HGT1700 overhaul capacity to cut compliance costs while extending asset life. Assaia’s ramp-monitoring analytics enable airports to validate APU-off adherence, converting voluntary eco-measures into compulsory upgrades. As a result, aftermarket margins rise even as original-equipment volumes plateau, offering attractive service income for established suppliers.
Expansion of Military UAV Fleets in High-Threat Environments
Allied defense agencies fund micro-APU programs that operate under low thermal and acoustic signatures to support stealth UAV missions. Rheinmetall’s memorandum with Honeywell for tactical vehicle APUs illustrates cross-domain integration of auxiliary power technologies. Safran’s role in the US Army’s Future Long Range Assault Aircraft electrical system demonstrates how demanding battlefield conditions spur innovation, feeding dual-use benefits into commercial designs.
Electrification of Ground Operations Driving Adoption of e-APUs
Collins Aerospace budgeted USD 3 billion for electrification, positioning its battery-based e-APUs as airports lock in zero-emission targets. Battery packs remove ramp emissions and slash noise, though adoption hinges on density improvements and on-stand charging installations. Honeywell’s partnership with Vertical Aerospace proves that lessons from eVTOL propulsion cascade into traditional short-haul aircraft. Although premium pricing remains a hurdle, early adopters signal a viable market niche for high-cycle short-range fleets.
Restraints Impact Analysis of Aircraft Auxiliary Power Unit Market*
| Restratin | (~) % Impact on CAGR Forecast | Geographic Relevance | Impact Timeline |
|---|---|---|---|
| Price instability of rare-earth materials used in generator components | -0.7% | North America, Europe | Short term (≤ 2 years) |
| Preference for airport ground power units reducing APU operating hours | -0.9% | Europe, North America | Medium term (2–4 years) |
| Lengthy and rigid certification processes for new-energy APU technologies | -0.5% | Global, with stricter requirements in North America and Europe | Long term (≥ 4 years) |
| Thermal management challenges in compact aircraft APU designs | -0.4% | Global, with particular impact on narrowbody and UAV segments | Medium term (2-4 years) |
| Source: Mordor Intelligence | |||
Price Instability of Rare-Earth Materials Used in Generator Components
China’s export curbs on neodymium and dysprosium inflate magnet costs, creating pricing uncertainty for APU permanent-magnet generators. US Air Force analyses list rare-earth dependence among top aerospace supply vulnerabilities, prompting OEMs to explore recycling and ferrite-based designs that may compromise power density. Contract pricing is now indexed to commodity exposure, affecting long-term maintenance agreements and eroding margins across the aircraft auxiliary power unit market.
Preference for Airport Ground Power Units Reducing APU Operating Hours
Gate-supplied 400 Hz electricity delivers up to sixfold energy efficiency compared with onboard APUs. Zurich Airport estimates per-hour savings exceeding CHF 600 when airlines rely on fixed electrical ground power.[2] This operating shift trims APU cycles, extends overhaul intervals, and depresses replacement volume. Manufacturers respond with higher-efficiency turboshafts to justify onboard generation in remote gates lacking fixed power, but infrastructure expansion continues to erode long-term demand growth.
*Our forecasts treat driver/restraint impacts as directional, not additive. The impact forecasts reflect baseline growth, mix effects, and variable interactions.
Aircraft Auxiliary Power Unit Market Segment Analysis
By Platform:
Commercial Dominance Mirrors Global Fleet GrowthThe commercial segment generated 67.72% of 2025 revenue and retains the backbone of the aircraft auxiliary power unit market. Line-fit demand matches Airbus and Boeing production ramps, while airlines pursue APU refurbishments instead of replacements to meet emission rules. Military platforms contribute a smaller base today but accelerate at 4.55% CAGR through 2031 as programs such as US rotary-wing modernization specify higher-output electric systems. This defense tailwind supports technology spillovers into civil variants, sustaining value creation across the aircraft auxiliary power unit industry.
Sustained narrowbody deliveries in Asia and North America anchor volume, whereas widebody jets require higher-rated APUs to power galleys and environmental control packs. On the military side, UAVs and transport aircraft adopt micro-and macro-rated solutions, broadening the application matrix. Business jets form a premium niche valuing rapid spool-up and cabin comfort, generating above-average aftermarket yields.

By Aircraft Type:
Fixed-Wing Leads but Rotary-Wing Adoption ClimbsFixed-wing deliveries kept an 80.12% hold on 2025 shipments, reflecting single-aisle production cycles and freighter conversions. Rotary-wing upgrades add 3.78% CAGR, propelled by programs that embed digital avionics and electronic warfare packages requiring a cleaner electrical supply. Helicopter APUs must fit constrained bays and tolerate vibration, driving miniaturized heat exchangers and variable-speed architectures.
Emerging eVTOL prototypes rely on auxiliary generation for backup power and system redundancy, injecting new design criteria. Fixed-wing fuel-cell trials on Airbus A330 demonstrate how long-range platforms may pivot toward alternative energy once certification hurdles are cleared, setting future demand patterns for the aircraft auxiliary power unit market.
By Power Rating:
Mid-Range 50–150 kVA Remains the Sweet SpotThe 50 to 150 kVA bracket captured 57.85% of 2025 revenue because it aligns with A320neo, 737 MAX, and C919 power envelopes. These mid-range systems balance output with weight, reinforcing their dominance in the aircraft auxiliary power unit market. Sub-50 kVA solutions are rising at 5.23% CAGR, buoyed by UAV fleets and regional jet growth.
The more than 150 kVA models address widebody and military ISR platforms needing robust power for galleys, radar, and directed-energy payloads. Clean Aviation’s Integrated Cooling for Power Electronics (ICOPE) advances higher power density, potentially realigning cut-points in future product roadmaps. Segment interplay underscores how fleet composition shifts dictate production and overhaul workloads across the aircraft auxiliary power unit industry.
By Technology:
Conventional Turboshaft Prevails as Alternatives Take ShapeConventional designs commanded a 89.62% share in 2025 due to mature support networks and drop-in SAF compatibility. Fuel-cell units show the fastest climb at 6.03% CAGR, spurred by Airbus ground tests validating hydrogen’s operational feasibility. Battery-electric APUs stay niche in weight-sensitive missions but offer zero-emission taxi benefits on short-haul routes.
Honeywell targets 100% SAF certification this decade, prolonging conventional relevance, while Collins and Safran channel investment into electrical architectures positioned for blended-wing demonstrators. Technology roadmaps straddle parallel tracks, reflecting the transitional nature of the aircraft auxiliary power unit market.
Geography Analysis
North America Aircraft Auxiliary Power Unit Market
North America retained a 32.35% share in 2025, anchored by Boeing deliveries and sustained Pentagon spending that underwrite R&D for next-generation solutions. Government stimulus for domestic critical minerals processing also intends to reduce rare-earth exposure. The aircraft auxiliary power unit market size is forecasted to grow steadily as GTF and LEAP fleets mature and enter heavy maintenance cycles.
APAC Aircraft Auxiliary Power Unit Market
Asia-Pacific is the fastest riser at 5.22% CAGR through 2031, driven by China’s C919 rollout and India’s forecast for 19,500 new aircraft by 2043. Joint ventures such as Safran–HAL localize parts production, trimming lead times, and aligning with regional offset mandates. Aftermarket revenues will multiply as the regional fleet reaches 129 USD billion service value by 2043, deepening the aircraft auxiliary power unit market footprint.
Europe Aircraft Auxiliary Power Unit Market
Europe leverages policy leadership to push low-emission power units under the Clean Aviation umbrella. Hydrogen infrastructure pilots and stringent APU-off enforcement foster innovation in low-NOx combustion and fuel cells. While ground power prevalence tempers unit sales, it pressures suppliers to deliver ultra-efficient products that satisfy airlines facing tight turnaround and environmental compliance.
Regulatory Landscape
Certification and continued airworthiness for aircraft APUs are primarily governed by airworthiness authorities and their published specifications. In the United States, the FAA sets minimum performance standards for gas turbine APUs via TSO-C77b, and it manages APU-related design approvals through its engine and propeller approval framework. In Europe, EASA issues Certification Specifications for APUs under CS-APU (including CS-APU Amendment 1) within the Part 21 certification structure, creating a parallel compliance track that OEMs and suppliers must satisfy for global programs.
Airport operating rules are also shifting APU duty cycles through local mandates and airport enforcement of APU-off operations when fixed electrical ground power is available. In California, the Air Resources Board (CARB) has been developing concepts (as of February to March 2026) focused on APU emissions minimization at airports, with implementation strategies centered on increased use of ground power, preconditioned air (PCA), and zero-emission APU technologies. The state also includes grid-neutral requirements in Title 17 rules for approved GHG control strategies after 2020. Trade policy adds another compliance layer: in February 2026, new US tariffs took effect under Section 122 with an explicit exemption for aircraft and engine parts (HTSUS provision 9903.03.05). In July 2026, a Section 232 proclamation initiated negotiations on imports of commercial aircraft, jet engines, and parts while ordering no immediate tariffs, reinforcing the need for active classification management across APU supply chains.
Value Chain Analysis
The APU value chain begins with specialized raw materials and precision components, including nickel-based superalloys for hot-section parts, high-temperature turbine blades, combustion chambers, precision gearboxes, and electronic controls (including digital engine control elements and associated power electronics). These inputs then go to APU OEMs for core design, module manufacturing, and final assembly and test. From there, units flow into aircraft OEM line-fit channels for new deliveries and into the aftermarket for spares, exchange units, and repairs that support installed fleets across commercial, military, and general aviation platforms.
Downstream value capture depends on maintenance ecosystems and parts availability. OEM-authorized MRO networks and independent repair stations handle overhauls, repairs, and accessory work, while distributors and licensed partners stock and move rotables and piece parts to reduce aircraft-on-ground risk. Recent industrial actions highlight how capacity and integration sit inside the chain: Honeywell expanded production capability for the 131-9 APU series at its Phoenix assembly line in June 2026 to support Airbus and Boeing build rates, and TRMotor started integration activity in February 2026 on TRM-APU60 and APU-40 for Turkish aircraft programs. Together, these examples show how platform integration, local industrial participation, and certification planning can drive lead times and supplier selection.
Competitive Landscape
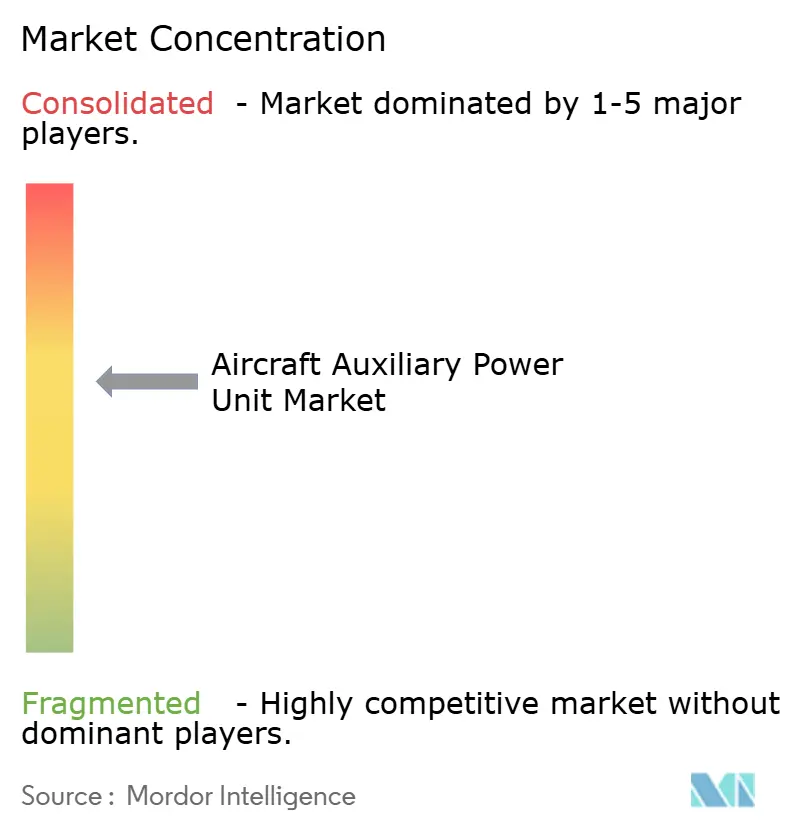
The marketplace is moderately consolidated, with Honeywell International Inc., Safran SA, Collins Aerospace, and Pratt & Whitney holding long-term supply positions. Honeywell’s proposed spin-off introduces strategic ambiguity around R&D funding, although its existing portfolio spans commercial and defense niches. Safran invests EUR 1 billion (USD 1.17 billion) in global MRO stations to lock in lifecycle revenue, signaling a shift toward service-led profit pools.
Collins Aerospace allocates USD 3 billion to electrification, seeking early leadership in fuel-cell and battery-hybrid architectures. RTX aligns with JetZero on blended-wing demonstrators, ensuring auxiliary system readiness for radically new airframes.[4] Supplier competition now pivots on emissions metrics, lifecycle cost, and digital health monitoring instead of raw power output.
Supply chain resilience emerges as a differentiator. Western OEMs qualify alternate magnet suppliers and invest in recycling to hedge geopolitical risk. Smaller entrants exploit micro-APU niches for UAVs and spaceplanes, fostering targeted innovation but facing certification and capital barriers. Therefore, the aircraft auxiliary power unit market balances incumbents’ scale with specialized challengers’ agility.
Aircraft Auxiliary Power Unit Industry Leaders
-
Honeywell International Inc.
-
RTX Corporation
-
PBS Group a.s.
-
JSC SPE Aerosila
-
Safran SA
- *Disclaimer: Major Players sorted in no particular order
Aircraft Auxiliary Power Unit Market Companies Covered in this Report
- Honeywell International Inc.
- RTX Corporation
- Safran SA
- JSC SPE Aerosila
- Technodinamika (Rostec)
- PBS Group a.s.
- Rolls-Royce plc
- Motor Sich JSC
- Aegis Power Systems, Inc.
- Eaton Corporation plc
- Liebherr Aerospace (Liebherr Group)
- Jakadofsky GmbH
Market Opportunities and Future Outlook
Aftermarket availability and lifecycle support are opening up opportunities for distribution and licensed repair capacity tied to large installed bases. In March 2026, VSE Aviation signed a globally exclusive, life-of-program distribution agreement with Pratt & Whitney Canada covering APS1000, APS2000, and APS2100 APU aftermarket components. In July 2026, TAT Technologies expanded its relationship with Honeywell Aerospace to become the sole global authorized distributor of 331-200/250 APU spare parts, while extending MRO licenses through 2036. These moves point to sustained operator demand for structured parts access, repair licensing, and pooling models that reduce turnaround time and provide more predictable maintenance pathways.
Product and technology opportunities are also tied to electrification and newer aircraft architectures that require auxiliary power approaches beyond conventional turboshaft APUs. In July 2026, Safran Helicopter Engines announced a development and life-of-program production agreement for the TG600 turbogenerator to power Electra EL9 hybrid-electric aircraft, and it completed first bench tests in July, marking a defined step from R&D into production for hybrid-electric auxiliary generation. At the same time, Honeywell increasing capacity at its Phoenix APU assembly line in June 2026 illustrates how line-fit demand for high-volume single-aisle programs is influencing industrial priorities, which in turn drives follow-on needs for spares provisioning, component repair, and health-monitoring upgrades under higher utilization and tighter ground-emissions operating constraints.
Recent Industry Developments in Aircraft Auxiliary Power Unit Market
- July 2026: Safran Helicopter Engines signed a development and life-of-program production agreement for the TG600 turbogenerator to power Electra’s EL9 hybrid-electric aircraft, and the program completed first bench tests in July. The agreement links auxiliary power capability directly to an emerging hybrid-electric platform and formalizes a production pathway rather than a purely exploratory demonstrator effort.
- October 2025: Safran Electrical & Power and Lufthansa Technik expanded their long-term partnership for maintenance and overhaul of APU generators on the Airbus A320 family. The expanded scope strengthens generator MRO capacity for one of the largest narrowbody fleets, tightening service coverage where APU-off operations and high cycle counts elevate reliability requirements.
- November 2024: Columbia Helicopters selected Honeywell’s 36-150 APU and 35 kVA generator system for its Chinook Model 234 and CH-47D helicopters. The selection reinforces demand for high-output auxiliary electrical power in rotary-wing missions where onboard systems and upgrades increase electrical loading and operational readiness needs.
Aircraft Auxiliary Power Unit Market Report Scope and Research Methodology
Market Definition and Coverage
For this study, the aircraft auxiliary power unit (APU) market covers the value of onboard APU systems used to generate electrical power and compressed air for aircraft when the main engines are not running, across new installations and replacement demand.
Scope exclusions: We exclude portable ground power carts, ground power infrastructure, and APUs used on land vehicles.
Segments Covered in This Report
- By Platform
- Commercial
- Narrowbody Aircraft
- Widebody Aircraft
- Regional Jets
- Military
- Combat
- Special Mission
- Transport
- Trainer
- Unmanned Aerial Vehicles (UAVs)
- General Aviation
- Light Aircraft
- Business Jets
- Helicopters
- Commercial
- By Aircraft Type
- Fixed-Wing
- Rotary-Wing
- By Power Rating
- less than 50 kVA
- 50 to 150 kVA
- more than 150 kVA
- By Technology
- Conventional Turboshaft
- Battery-Electric
- Fuel-Cell
- By Geography
- North America
- United States
- Canada
- Mexico
- Europe
- United Kingdom
- Germany
- France
- Italy
- Rest of Europe
- Asia-Pacific
- China
- India
- Japan
- South Korea
- Rest of Asia-Pacific
- South America
- Brazil
- Rest of South America
- Middle East and Africa
- Middle East
- United Arab Emirates
- Saudi Arabia
- Qatar
- Rest of Middle East
- Africa
- South Africa
- Egypt
- Rest of Africa
- Middle East
- North America
Data Sources, Market Sizing, and Validation
Desk Research
We started by mapping how APU demand is created in practice, which mainly comes from aircraft deliveries, fleet size, and the replacement cycle linked to flight hours and maintenance events. To anchor these items, we used public aviation statistics and outlooks such as ICAO air transport indicators, FAA fleet and safety publications, EASA airworthiness and regulatory material, and IATA traffic and capacity trends as directional demand signals.
Next, we checked pricing and shipment logic using sources like company annual reports and investor presentations, aircraft program documents released by OEMs, and association or standards references covering auxiliary power systems. Where needed, we also referenced an aerospace and aviation subscription database for aircraft-level program tracking and a patent database to understand how quickly newer architectures, including more electric APUs, are moving into service. The desk sources listed here are illustrative, and we relied on additional public references to collect, validate, and clarify the final model inputs.
Primary Interviews and Surveys
To keep the sizing practical, we spoke with a mix of APU supply chain and airline maintenance-side experts, including OEM-aligned contacts, independent MRO viewpoints, and aviation procurement roles. The interviews covered APUs used across commercial, business aviation, military fleets, and helicopters. We also made sure inputs were checked across APAC, EMEA, and the Americas so regional fleet differences did not distort totals.
Distribution of primary research fieldwork respondents
| Company type | Respondent position | Region |
|---|---|---|
| Top tier: 25% | CXOs: 16% | APAC: 39% |
| Mid tier: 56% | Functional/Unit leaders: 30% | EMEA: 34% |
| Smaller Players: 19% | Managers: 54% | Americas: 27% |
Market-Sizing & Forecasting
The core model uses a top-down build that reconstructs APU demand from the active fleet and new aircraft deliveries, then applies platform-level APU fit rates plus replacement timing assumptions tied to utilization and maintenance cycles. To keep the output realistic, we corroborated totals with selective bottom-up checks, such as sampled APU ASP ranges by aircraft class and a reasonableness roll-up of implied unit shipments versus aircraft production patterns.
Key inputs used in the model include aircraft delivery outlooks by major platform families, installed fleet by region, average aircraft utilization (flight hours and cycles), APU shop-visit intervals and first-replacement timing, and observed ASP progression for new production versus spares. When interview feedback showed gaps, we adjusted assumptions in a traceable way, for example when business jet utilization patterns or military retrofit timing differed from broad fleet averages.
For forecasting, we used scenario analysis supported by exponential smoothing on the core demand drivers, mainly deliveries and fleet utilization. We then stress-tested the results with alternative cases for traffic recovery pace, replacement deferrals, and the mix shift toward newer aircraft that may change APU requirements. Outputs are reported in nominal USD for the stated years. Regional totals are built first and then summed to the global number, so country-level fleet changes are carried into the final view.
Data Validation & Update Cycle
Model outputs were checked against independent signals such as fleet growth, aircraft delivery schedules, and maintenance activity markers, and then flagged variances were reviewed before the numbers were finalized. If a region or aircraft class produced an unusual jump, we re-checked the input drivers, revisited the assumptions with additional calls when needed, and confirmed that currency timing and pricing steps were consistent.
Each report is refreshed on an annual cycle, and interim updates are triggered when material events occur, such as a major aircraft program rate change, a notable supply constraint, or a shift in maintenance behavior. Before delivery, we do a final review pass so the published view reflects the latest available public indicators and validated field inputs.
Mordor Intelligence's Aircraft Auxiliary Power Unit Market Size Compared Against Other Published Estimates
Published market sizes for aircraft APUs do not always line up because firms often pick different boundaries for what counts as APU revenue, and they may not treat OEM-fit and aftermarket replacement in the same way. Differences also show up when one model leans heavily on aircraft production alone, and another model is more tied to in-service fleet usage and maintenance-driven replacements.
Aircraft delivery schedules, active fleet counts, and APU replacement cycle checks from maintenance-side interviews are the evidence points that keep Mordor Intelligence's estimate aligned to a defined OEM plus first replacement demand pool, instead of blending in broader factory-gate services or adjacent ground power equipment. Some published figures also use faster ASP escalation and longer forecast horizons, which can inflate current-year values when converted into a single point estimate.
Benchmark comparison
| Source | Market Size | Gaps in Research Methodology |
|---|---|---|
| Mordor Intelligence | USD 3.19 B (2026) | |
| Industry Publisher A | USD 3.50 B (2025) | Uses a factory-gate framing that can include manufacturer-sold related services, and the base year is earlier, so later-year fleet and delivery shifts are not fully reflected. |
| Global Consultancy B | USD 6.11 B (2025) | Appears to apply broader inclusion and faster price growth across platforms, which can overstate near-term totals when aftermarket intensity and fitment rates are not constrained by fleet and maintenance-cycle signals. |
The spread in the table mainly comes from what gets counted as APU revenue and how tightly the model is tied to fleet-driven replacement timing. By keeping assumptions connected to observable fleet, delivery, and maintenance indicators, the final number stays easier to explain and re-check when new aircraft rates or utilization patterns change.
Key Questions Answered in the Report
What is the current size of the aircraft auxiliary power unit market?
The market is valued at USD 3.19 billion in 2026 and is projected to reach USD 3.81 billion by 2031, advancing at a CAGR of 3.59%.
Which segment holds the largest aircraft auxiliary power unit market share?
Commercial aviation led with 67.72% revenue share in 2025, driven by narrowbody aircraft deliveries.
Why are fuel-cell APUs gaining traction?
Hydrogen trials on Airbus A330 aircraft demonstrate zero-emission feasibility and support a 6.03% CAGR forecast for fuel-cell units through 2031.
How are regulatory APU-off mandates affecting the market?
Airports enforcing ground-power usage push airlines to retrofit legacy fleets instead of buying new APUs, boosting high-margin aftermarket services.
Which region is growing fastest?
Asia-Pacific is expanding at 5.22% CAGR due to China’s C919 program and India’s long-term fleet growth outlook.
What are the key risks for APU manufacturers?
Dependence on rare-earth materials and rising ground-power adoption reduce run-time hours, pressuring both supply chains and unit replacement demand.