
Air Taxi Market Size and Share
Market Overview
| Study Period | 2020 - 2031 |
|---|---|
| Market Size (2026) | USD 4.47 Billion |
| Market Size (2031) | USD 10.56 Billion |
| Growth Rate (2026 - 2031) | 18.79% CAGR |
| Fastest Growing Market | Europe |
| Largest Market | North America |
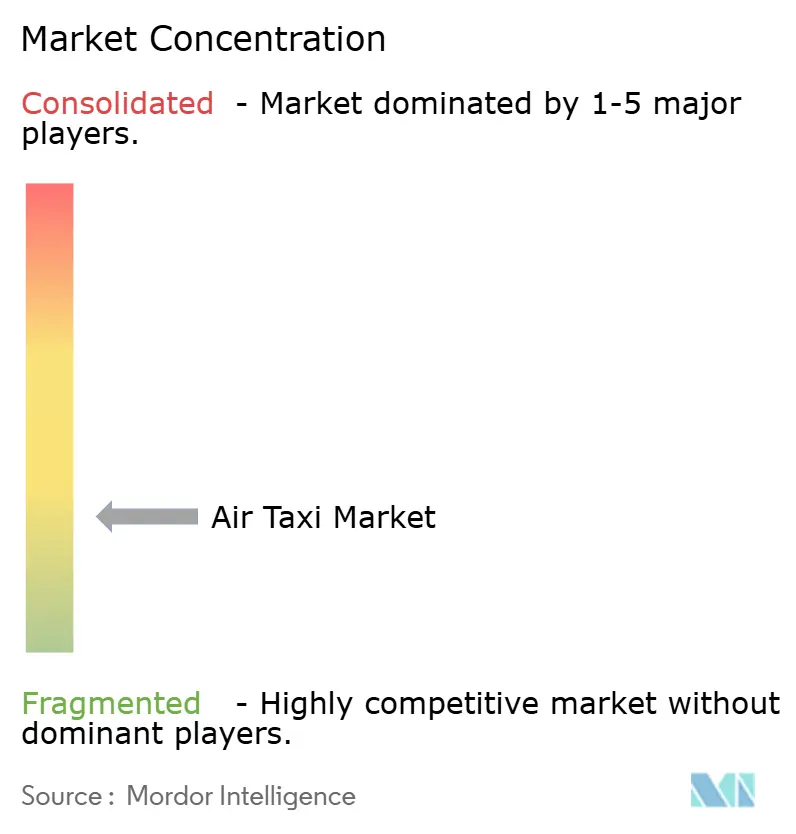
| Market Concentration | Low |
Major Players *Disclaimer: Major Players sorted in no particular order Image © Mordor Intelligence. Reuse requires attribution under CC BY 4.0. | |
Air Taxi Market Analysis by Mordor Intelligence
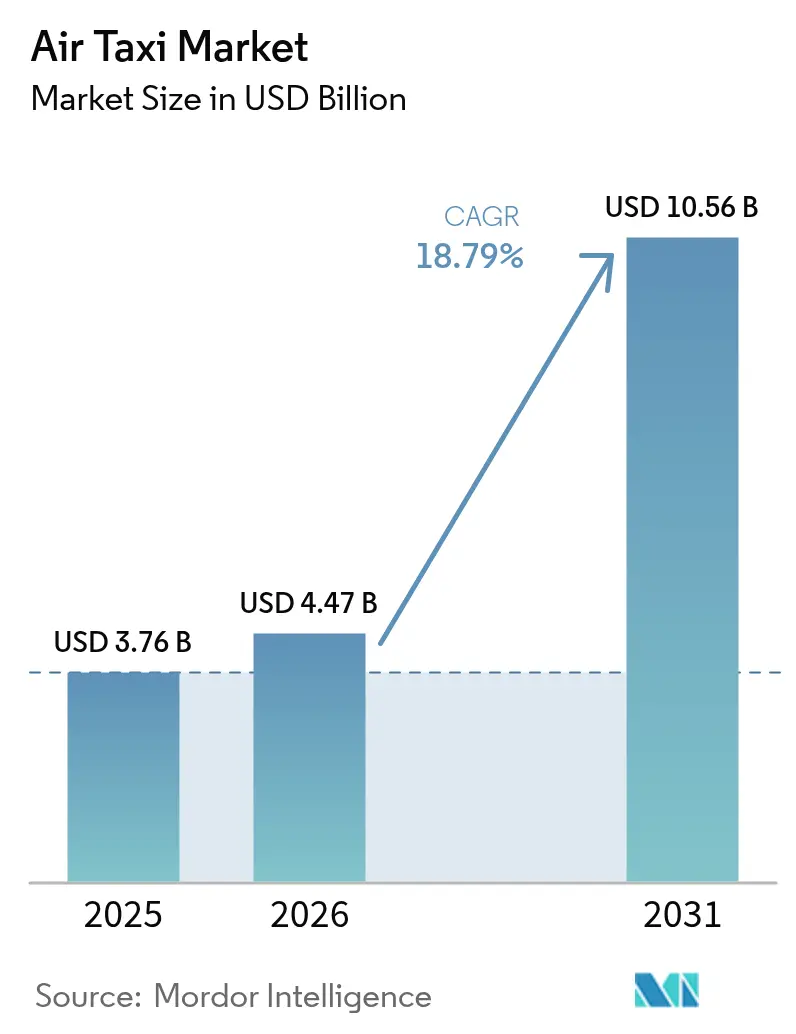
The air taxi market size is expected to grow from USD 3.76 billion in 2025 to USD 4.47 billion in 2026 and is forecast to reach USD 10.56 billion by 2031 at 18.79% CAGR over 2026-2031.
Intensifying prototype-to-production momentum, widening public-private vertiport investment, and early airline route commitments lift near-term demand together. Battery-electric aircraft still anchor most commercial plans, yet hydrogen fuel-cell demonstrations have broadened investor confidence in longer‐range models. North America will keep the revenue lead in 2025, thanks to clear FAA-powered-lift rules and United–Archer route launches. Asia-Pacific shows the sharpest growth curve as China’s low-altitude-economy initiative and Japan’s Osaka Expo trials fast-track certification. Competition is chiefly execution-driven rather than technology-driven now that most OEMs converge on distributed-electric architectures. Venture capital continues to flow despite isolated test setbacks, signaling sustained faith in the maturing air taxi market.
Key Report Takeaways
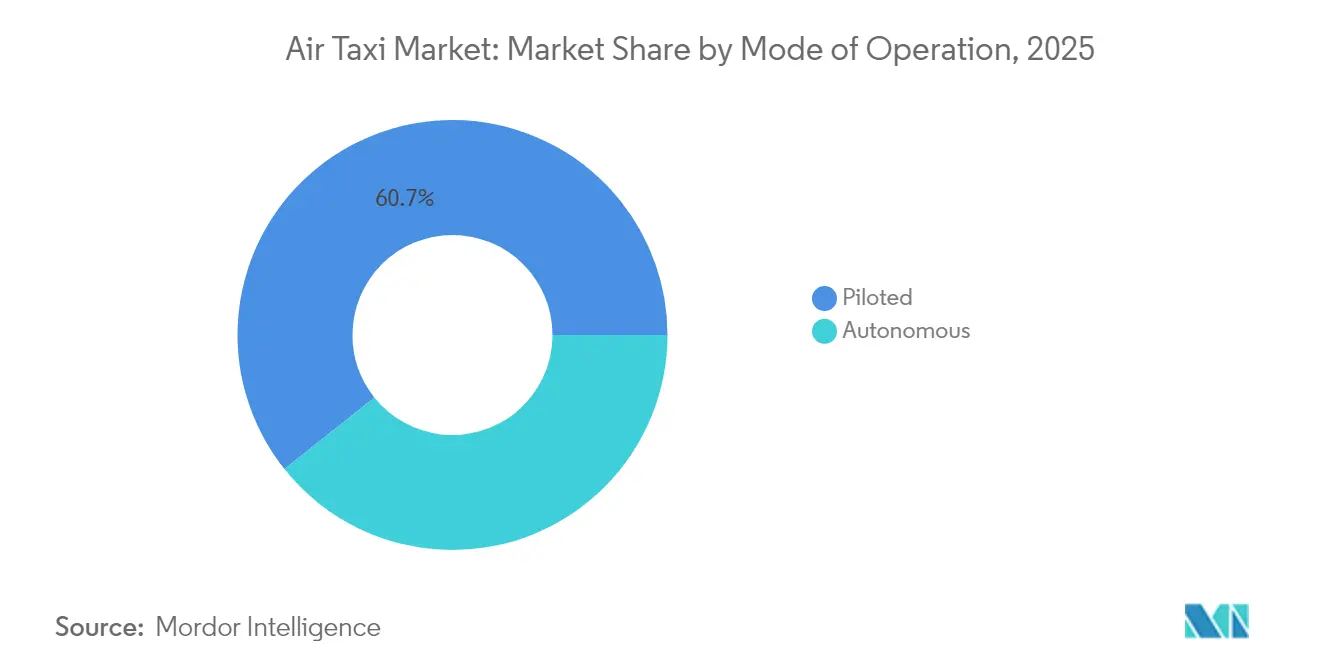
- By mode of operation, piloted aircraft held 60.72% of the air taxi market share in 2025, but autonomous platforms are on course for the quickest 24.10% CAGR through 2031.
- By propulsion type, battery-electric systems captured 54.88% of the air taxi market size in 2025; hydrogen fuel-cell models are forecasted to expand at a 20.85% CAGR.
- By passenger capacity, the 3 to 4-seat layouts commanded 42.30% of 2025 revenue, while the 5 to 6-seat designs led growth with a 19.05% CAGR outlook.
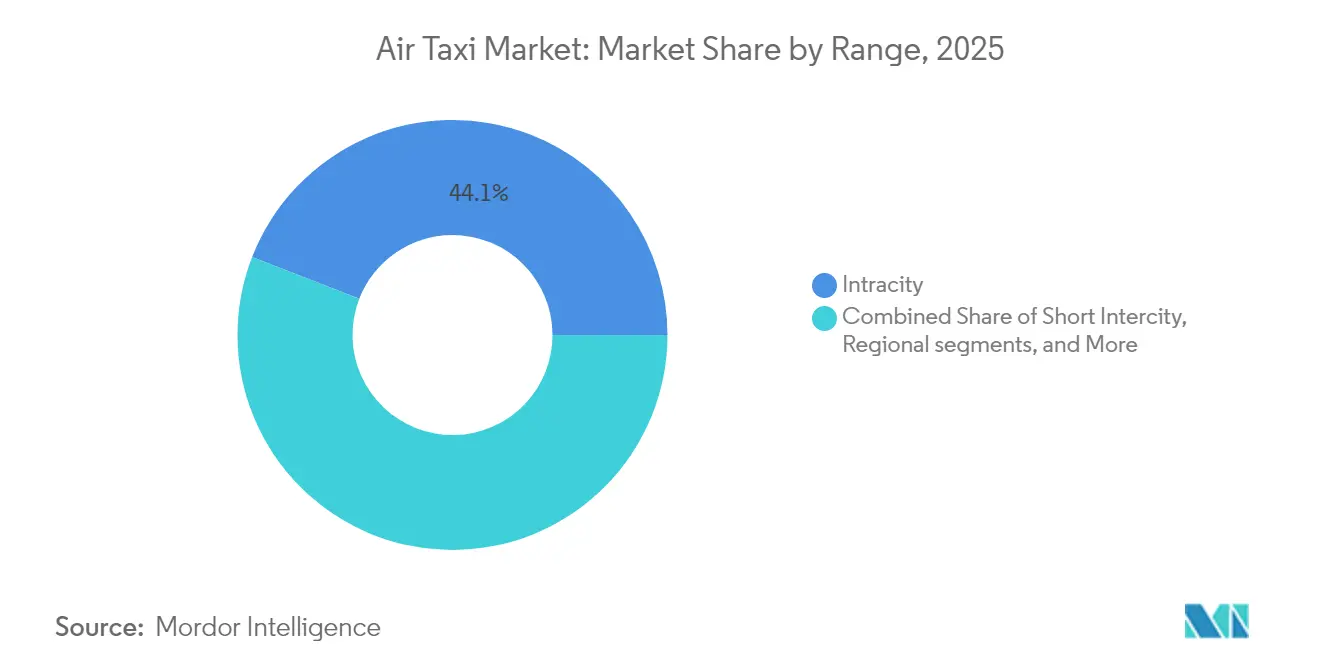
- By range, sub-50 km intracity legs accounted for 44.10% of 2025 spending as the regional 150 to 300 km band accelerates at 19.95% CAGR.
- By end-use, airport shuttles led with 44.70% revenue share in 2025; corporate shuttles are projected to widen fastest at a 21.15% CAGR.
- By lift technology, multicopters delivered 45.20% of 2025 sales, whereas lift-plus-cruise airframes are advancing at a 22.40% CAGR.
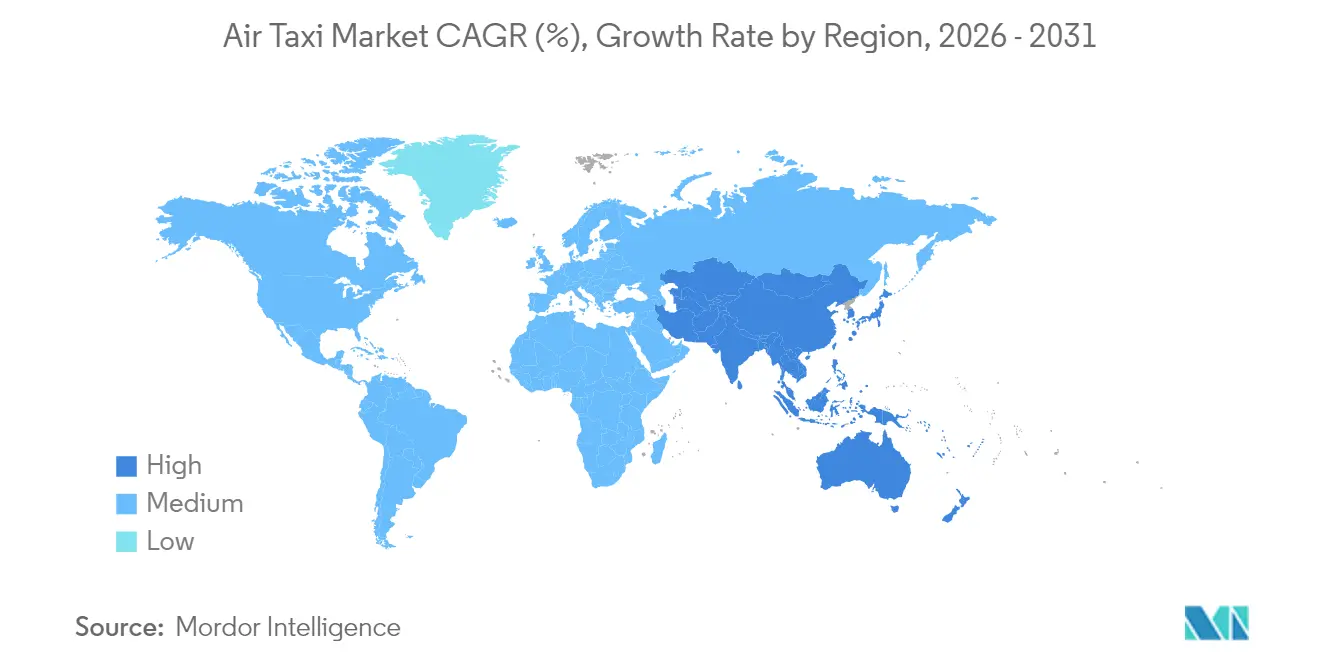
- By geography, North America accounted for 45.10% of 2025 revenue, driven by the FAA's finalization of powered-lift frameworks, while Asia-Pacific is accelerating at a 25.20% CAGR, driven by China's low-altitude economy blueprint, which enables scaling commercial fleets beyond pilot programs.
Note: Market size and forecast figures in this report are generated using Mordor Intelligence’s proprietary estimation framework, updated with the latest available data and insights as of 2026.
Global Air Taxi Market Trends and Insights
Drivers Impact Analysis*
| Driver | (~) % Impact on CAGR Forecast | Geographic Relevance | Impact Timeline |
|---|---|---|---|
| Battery-density breakthroughs extend practical range | +4.2% | North America and Europe, wider global spill-over | Medium term (2-4 years) |
| Vertiport public-private partnerships accelerate infrastructure rollout | +3.8% | North America and EU, early adopters in Asia-Pacific | Medium term (2-4 years) |
| Airline and airport integration for premium first-mile/last-mile service | +3.5% | Global metro hubs | Short term (≤2 years) |
| Noise-abatement eVTOL designs gain fast-track certification | +2.9% | Global under FAA and EASA leadership | Medium term (2-4 years) |
| Post-COVID decentralized work patterns spur regional mobility demand | +2.7% | North America and Europe | Short term (≤2 years) |
| Corporate ESG mandates prioritize zero-emission mobility solutions | +2.1% | Worldwide | Long term (≥4 years) |
| Source: Mordor Intelligence | |||
Battery-density breakthroughs extend practical range
Present lithium-ion packs deliver 250–300 Wh/kg, capping many urban trips at roughly 30 km. CATL’s 500 Wh/kg Qilin cell and emerging lithium-sulfur chemistries promise to double usable range by 2027, trimming energy cost per seat-kilometer and opening regional city pairs. Structural battery modules in Joby’s S4 airframe remove 15-20% structural weight, while solid-state prototypes meet FAA thermal-runaway criteria and unlock accelerated certification.
Vertiport public-private partnerships accelerate infrastructure rollout
More than 1,500 vertiports sit in global pipelines, but Manhattan’s EB 105A pilot site proves that co-funded models can cut build times to three to five years.[1]Skyports, “Infrastructure Report 2024,” skyports.net Similar frameworks in Dubai and Osaka hint at replicability, ensuring the air taxi market is not supply-constrained by pads and chargers. As infrastructure expands, it will unlock new routes and reduce travel times. Collaboration between the private and public sectors is essential to foster innovation and streamline regulatory processes.
Airline and airport integration for premium first-/last-mile service
United Airlines and Archer plan 10-minute hops from Newark to lower Manhattan at USD 200–300 per seat, embedding eVTOL tickets directly into airline booking flows.[2]United Airlines, “United Announces Plans to Bring eVTOL Flights to Chicago,” united.com Integrated offers slash customer-acquisition costs by roughly two-thirds and monetize dwell time at under-utilized heliports, supplying a quick-win path for incumbent carriers to up-sell loyalty tiers. Airport authorities favor such links because each eVTOL passenger yields USD 15–25 in incremental fee income.
Noise-abatement eVTOL designs gain fast-track certification
NASA ground-treatment trials record 26–36 dB noise reductions relative to legacy helicopters, helping manufacturers meet the FAA’s 62 dB residential overflight ceiling.[3]NASA, “Advanced Air Mobility Noise Studies,” nasa.gov Rotor-blade tip shaping and variable-rpm profiles further cut acoustic signatures, lifting community acceptance scores in German pilot surveys from 2.6 to 3.8 on a five-point scale. Regulators offer abbreviated flight-test plans if prototypes beat helicopter noise footprints by 10 dB or more, bringing forward service-entry dates in core urban corridors.
Restraints Impact Analysis*
| Restraint | (~) % Impact on CAGR Forecast | Geographic Relevance | Impact Timeline |
|---|---|---|---|
| Certification bottlenecks for novel flight-control software | -2.6% | Global | Medium term (2-4 years) |
| Limited high-power grid capacity at candidate vertiport sites | -2.3% | Dense urban settings worldwide | Long term (≥ 4 years) |
| Scarcity of aviation-grade lithium and rare-earth materials | -1.7% | Global supply chain | Medium term (2-4 years) |
| Public safety perception after any high-profile incident | -1.5% | Global, risk tolerance varies | Short term (≤ 2 years) |
| Source: Mordor Intelligence | |||
Certification bottlenecks for novel flight-control software
Each eVTOL hosts over 10,000 lines of safety-critical code that must comply with DO-178C Level A processes. Scarcity of qualified software assessors forces FAA and EASA to rely on external consultants, sometimes extending approval cycles by two to three years.[4]Government Accountability Office, “Advanced Air Mobility: Federal Agencies Should Take Additional Steps,” gao.gov Predictive cost overruns can consume USD 200–300 million of pre-revenue cash, elevating bankruptcy risk for under-capitalized entrants.
Limited high-power grid capacity at vertiport sites
A single downtown vertiport can draw 1–20 MW during peak charging windows, on par with a mid-size data center. Utilities need 18–36 months to install high-voltage feeders, and upgrades run USD 2–5 million per location. Without on-site storage or micro-grids, launch timelines may slip, dampening the near-term penetration of the air taxi market in power-constrained cities.
*Our forecasts treat driver/restraint impacts as directional, not additive. The impact forecasts reflect baseline growth, mix effects, and variable interactions.
Segment Analysis
By Mode of Operation: Autonomous flight poised for the long game
Piloted flights generated 60.72% of segment revenue in 2025, leveraging well-known rotorcraft training pipelines. Autonomous systems, however, are tracking a 24.10% CAGR because they strip USD 150,000-plus in annual pilot wages from the cost stack and support round-the-clock operations without crew-rest bottlenecks. The US corridor trials and China's EHang deployments validate remote oversight concepts, gradually building the safety data regulators require. Rising confidence in autonomy widens the air taxi market size for late-decade deployments aimed at logistics, emergency response, and commuter pools.
Scalability improves as software candidates prove robust across mixed traffic. When autonomy matures, operators could redeploy human pilots into fleet-services roles, boosting aircraft utilization and reducing cancellation risks tied to crew availability. Training and insurance costs should compress in lock-step, though early adopters will maintain a safety pilot on board until regulators sign off on full hands-free operations.


By Propulsion Type: Electric leads, hydrogen breaks range barriers
Battery-electric platforms captured 54.88% of 2025 shipments, buoyed by falling cell costs and simple drivetrain maintenance. Yet hydrogen fuel-cell aircraft, spurred by Joby’s 523-mile demo flight, are advancing at 20.85% CAGR, attracting interest from regional carriers that need multi-hundred-kilometer legs. Battery swaps and 350-kW fast-charge specs keep electric models competitive on urban missions, while hybrid architectures provide a bridge for operators hedging range anxiety.
Infrastructure dictates pace: Battery chargers piggyback on EV build-outs, whereas hydrogen demands new storage and dispensing. Oil majors like BP and Shell see synergies with heavy-truck networks, giving hydrogen a realistic path to a 15–20% air taxi market share post-2030.
By Passenger Capacity: Mid-size cabins optimize yield
Three—to four-seat layouts account for 42.30% of 2025 revenue because they balance airframe weight, vertiport pad size, and high load factors. Corporate shuttle pilots highlight tangible productivity gains when four colleagues can share a private cabin. However, larger 5—to 6-seat cabins lead growth at 19.05% CAGR by unlocking per-seat prices below USD 300, a threshold at which travel managers approve regular use for regional meetings.
Beyond six seats, weight penalties and stricter certification steps converge, eroding margins unless battery densities hit the 500 Wh/kg mark. Cabin flexibility becomes an emerging differentiator, with modular seating that toggles between passenger and light-cargo missions, offering operators new revenue buffers.
By Range: Regional missions gather momentum
Sub-50 km hops still account for 44.10% of flights: city-center connections where congestion premiums justify fares of USD 5–8 per seat-kilometer. As solid-state batteries scale up, the 150–300 km band will expand at 19.95% CAGR, catalyzing services between secondary cities and satellite manufacturing hubs. The evolving range mix increases aircraft utilization, a primary driver of positive cash flow in the air taxi market.
Charging-time economics intersect with route choices. Intracity operators depend on 10–15-minute pit stops, favoring battery-swap concepts. Regional players accept 30-minute turnaround slots as part of passenger boarding sequences, aligning naturally with high-power plug-in architectures.
By End Use: Corporate shuttles in the spotlight
Airport transfers controlled 44.70% of 2025 sales by tapping existing security and baggage channels at major hubs. Yet, a distributed work culture propels corporate shuttles to a 21.15% CAGR, especially on the US West Coast corridors, where technology firms seek low-carbon mobility perks to attract talent. A 5-seat eVTOL that cuts a 90-minute road slog to 20 minutes can reclaim two billable hours per employee, yielding a compelling ROI against premium seat pricing.
Tourism and aerial sightseeing remain reliable shoulder-season fillers, while emergency medical services gain traction as helicopters age out and hospitals adopt ESG targets. This diversity smooths revenue cyclicality, mitigating risk for debt investors underwriting vertiport projects.
By Lift Technology: Multicopters today, lift-plus-cruise tomorrow
Multicopters supplied 45.20% of 2025 deliveries because they echo drone simplicity and require fewer moving parts. Their downside is cruise inefficiency: a level-flight energy burn roughly double that of lift-plus-cruise rivals. Therefore, operators seeking 200–300 km stage lengths gravitate to lift-plus-cruise airframes that promise 40–60% energy savings and lower per-mile wear. The latter segment is pacing at 22.40% CAGR and may overtake multicopters late in the decade if certification stays on course.
Tilt-rotors inherit proven military pedigrees and deliver runway-like speeds, though their mechanical complexity and higher parts count deter first-time owners. Ducted-fan concepts fill niche roles where noise suppression supersedes raw range, notably in European heritage districts with strict acoustic ordinances.
Geography Analysis
North America generated 45.10% of 2025 revenue after the FAA finalized powered-lift frameworks and metropolitan vertiport pilots moved past environmental-review hurdles. The US airlines act as anchor customers, creating predictable demand curves that investors leverage for project-finance structures. Canada and Mexico contribute incremental growth through cross-border tourism routes and supportive test corridors.
Asia-Pacific is accelerating at a 25.20% CAGR. China’s low-altitude economy blueprint green-lights EHang and AutoFlight to scale commercial fleets beyond pilot programs, while Japan’s Osaka Expo is set to showcase daily passenger services in 2025. India’s tier-2 city network opens new miles under mild air traffic density, offering startup-friendly test beds before shifting into crowded skies.
Europe ranks third but wields regulatory influence via EASA’s SC-VTOL code, shaping safety baselines worldwide. Germany hosts flagship players Volocopter and Lilium, although the latter’s insolvency underscores capital-intensity challenges. The EU’s Connecting Europe Facility earmarks USD 1.29 billion for vertiport grants, raising baseline infrastructure readiness across the bloc.

Regulatory Landscape
Regulation is converging on how to adapt existing aircraft and operations rules for powered-lift and VTOL-capable aircraft. In the United States, the FAA finalized the powered-lift rule in October 2024, setting a baseline for pilot certification and operational requirements and providing the regulatory foundation used alongside aircraft airworthiness and operator approvals for commercial air taxi services. In Europe, EASA advanced its Innovative Air Mobility framework through formal guidance and operational rules integration, issuing AMC/GM via ED Decisions 2025/010/R and 2025/012/R to align VTOL-capable operations with Parts ARO/ORO/SPA and to introduce the Part-IAM construct for operations. ICAO continues to coordinate a global AAM vision through its Advanced Air Mobility Study Group, supporting cross-border interoperability as national rule sets mature.
Value Chain Analysis
The value chain begins with concept design and certification planning, then moves through prototyping, flight-test and compliance activities, and into industrialization for serial production. Upstream supply centers on batteries (cells, packs, thermal management), electric propulsion (motors, inverters, power electronics), flight controls and avionics (including fly-by-wire and integrated flight decks), lightweight structures and composites, and safety-critical software built to aviation standards such as DO-178C processes. Tiered aerospace suppliers and automotive-scale manufacturing partners increasingly influence lead times, cost, and quality as OEMs shift from hand-built prototypes toward repeatable manufacturing.
Midstream activities include final assembly, qualification testing, and MRO planning, followed by downstream operator enablement that combines aircraft financing, pilot training and simulation, vertiport and charging build-out, and integration into airline and airport booking and ground-mobility ecosystems. 2026 announcements point to scaling and interoperability priorities, with Joby and Toyota forming a manufacturing joint venture to prepare S4 production, and Archer, BETA Technologies, and Macquarie Capital launching the ACES consortium to standardize interoperable charging across up to 250 US aviation sites. Bottlenecks persist in specialized parts availability, qualified labor, and meeting stringent aerospace-grade quality requirements, so long-term supplier agreements and production partnerships remain a key execution lever.
Competitive Landscape
Competitive Landscape
The five most prominent players control less than 20% of global revenue, leaving the air taxi market fragmented. Airline alliances provide validation: United backs Archer, Delta funds Joby, and Embraer’s Eve enjoys regional-carrier support. Technology differentiation is narrowing, shifting competition toward production scalability and supply-chain resilience. Cash burn remains the principal threat—Lilium’s insolvency illustrates the USD 75–100 million annual outlay typical of the flight-test phase. Consolidation looms as aerospace primes, automakers, and energy majors scout bolt-on acquisitions to secure electric-propulsion footholds.
White space remains in regional routes under 300 km, a gap that helicopters seldom fill, and ground travel cannot match in time. Software firms such as Wisk and autonomy specialists from automotive spheres bet on pilot-free operations for an operating-cost edge. Component leaders like Honeywell and Garmin pivot into turnkey flight decks, ensuring supply-chain leverage even if airframe economics stay volatile.
Air Taxi Industry Leaders
Guangzhou EHang Intelligent Technology Co. Ltd.
Volocopter GmbH (Diamond Aircraft Industries GmbH)
Airbus SE
Archer Aviation Inc.
Joby Aviation, Inc.
- *Disclaimer: Major Players sorted in no particular order

Market Opportunities and Future Outlook
Near-term opportunity concentrates where regulators and infrastructure owners are converting advanced air mobility concepts into operational demonstrations and repeatable approvals. In the United States, the FAA and US DOT selected eight projects in March 2026 under the eVTOL Integration Pilot Program (eIPP) to test operational concepts, giving operators, airports, and OEMs a practical way to validate procedures beyond aircraft testing. This fits the report's emphasis on airline and airport integration for premium first-mile and last-mile routes, where operators can leverage established passenger flows and existing heliport assets.
Outside the US, regulatory sandboxes and harmonized guidance create whitespace for early deployments tied to city-level low-altitude economy programs and missions such as tourism or airport shuttles. EHang entering Hong Kong's low-altitude economy regulatory sandbox, with partners including Kwoon Chung Smart Mobility and Hong Kong Cyberport, shows how local frameworks can accelerate controlled commercial trials while national airworthiness pathways evolve. On the supply side, manufacturing and infrastructure standardization efforts support opportunities for component suppliers and energy providers, as reflected in the Joby-Toyota manufacturing JV and the ACES interoperable charging initiative. Together, they indicate that scale-up is shifting from isolated OEM initiatives toward ecosystem-level capacity building, leaving room for turnkey avionics, certified software toolchains, charging equipment, and vertiport power solutions in dense urban locations where grid upgrades are a known constraint.
Recent Industry Developments
- June 2026: EHang was selected for Hong Kong's Low-Altitude Economy Regulatory Sandbox X initiative with partners including Kwoon Chung Smart Mobility and Hong Kong Cyberport. The selection formalizes a controlled pathway to prove operations, compliance, and integration concepts in a high-visibility urban environment, supporting broader commercialization beyond mainland China.
- September 2025: ANA Holdings and Joby Aviation announced a strategic alliance to pursue airport-linked eVTOL services in Japan, outlining regulatory engagement, air-traffic integration, and joint pilots at selected airports. The collaboration highlights a shift toward coordinated market-building activities rather than standalone demonstrations, and aligns Japan with its role as a priority market for urban air mobility.
- March 2024: Airbus announced the debut of its CityAirbus NextGen prototype. The milestone advanced the competitive benchmark for European eVTOL development and reinforces Airbus's role in shaping operational concepts alongside certification and infrastructure partners.


Research Methodology Framework and Report Scope
Market Definition and Coverage
We define the air taxi market as the revenue generated from on-demand, short-range passenger air mobility services using small aircraft, including emerging eVTOL concepts, where trips are typically intra-city or short intercity and are sold as a service.
Scope exclusions: Ground infrastructure-only revenue (such as vertiport construction) and pure R&D funding without a commercial transport service outcome are excluded.
Segmentation Overview
- By Mode of Operation
- Piloted
- Autonomous
- By Propulsion Type
- Electric
- Hybrid
- Turboshaft
- Hydrogen Fuel Cell
- By Passenger Capacity
- 1 to 2 Seats
- 3 to 4 Seats
- 5 to 6 Seats
- More than 6 Seats
- By Range
- Intracity (Less than 50 km)
- Short Intercity (50 to 150 km)
- Regional (150 to 300 km)
- Extended (More than 300 km)
- By End-Use
- Airport Shuttle
- On-Demand Air Taxi
- Corporate Shuttle
- Emergency Medical Services
- Tourism and Sightseeing
- By Lift Technology
- Multicopter
- Tilt-Rotor
- Lift + Cruise
- Ducted Fan Jet
- By Geography
- North America
- United States
- Canada
- Mexico
- Europe
- United Kingdom
- France
- Germany
- Russia
- Rest of Europe
- Asia-Pacific
- China
- India
- Japan
- South Korea
- Rest of Asia-Pacific
- South America
- Brazil
- Rest of South America
- Middle East and Africa
- Middle East
- Saudi Arabia
- United Arab Emirates
- Rest of Middle East
- Africa
- South Africa
- Rest of Africa
- Middle East
- North America
Data Sources, Market Sizing, and Validation
Desk Research
Desk work starts by anchoring the market to visible aviation activity and policy direction, and then we bring in data series that help explain how quickly services can scale. Public and official sources were used where possible, such as the FAA and EASA for certification and operating constraints, ICAO for aviation definitions and global air transport context, and IATA for demand-side passenger travel signals. For airport and route environment, we also referred to publications from civil aviation authorities and airport operators, along with government transportation statistics where available.
Next, we reviewed company filings, investor presentations, and reputable press coverage to track announced timelines, fleet plans, and partnership activity that can influence near-term service readiness. When deeper cross-checking was required, paid subscriptions for company financials and intelligence, aerospace and aviation databases with aircraft-level details, patent databases, and global contracts and tenders were used selectively to verify commercialization claims and map value-chain participation. These desk research sources are illustrative, and many other public documents and datasets were also used for data collection, validation, and clarification during the study.
Primary Interviews and Surveys
Primary work was used to pressure-test what desk research cannot settle cleanly, such as realistic utilization, pricing ranges by mission type, and the likely ramp pace by regulatory readiness. We spoke with a mix of operators, airframe and subsystem participants, aviation services firms, and ecosystem stakeholders who track certification, infrastructure readiness, and route economics across key regions. Their inputs were then used to confirm assumptions, fill gaps, and align the final totals to what can plausibly be executed in the forecast window.
Distribution of primary research fieldwork respondents
| Company type | Respondent position | Region |
|---|---|---|
| Top tier: 38% | CXOs: 13% | APAC: 46% |
| Mid tier: 46% | Functional/Unit leaders: 41% | EMEA: 29% |
| Smaller Players: 16% | Managers: 46% | Americas: 25% |
Market-Sizing & Forecasting
For sizing, we start with a top-down demand pool build based on air mobility use cases where time savings are meaningful, and then we translate that pool into trips and revenue using realistic operational constraints. To keep the math traceable, the model uses a small set of clear drivers such as addressable route distance bands (intracity and short intercity), expected fleet availability, average seats utilized per trip, flight hours per aircraft per day, and an average revenue per trip that reflects pricing and load assumptions shared by interviewees.
Once the demand pool is built, selective bottom-up approximations are used to sanity-check totals, including sampled checks on planned fleet introductions, early operator capacity announcements, and simple price times volume constructs for a few high-visibility city pairs. Where there are gaps in bottom-up visibility, we do not force full supplier roll-ups, and instead apply conservative penetration steps that are validated through interviews and recent aviation adoption analogs.
Forecasts were produced using scenario analysis, since regulatory timing and aircraft certification gates can shift adoption curves in this market. Assumptions on utilization ramps, price normalization, and fleet scaling were adjusted by region based on what respondents described as the most likely operational rollout sequence.
Data Validation & Update Cycle
Outputs are checked in multiple steps so that one optimistic input does not dominate the final number. We compare modeled revenues against independent signals like implied aircraft utilization levels, plausible fleet counts, and the pace of certification and commercial readiness milestones, and then outliers are reviewed before sign-off. When a variance shows up, the team re-checks units, currency conversions, and adoption steps, and then we re-contact sources if the gap cannot be explained with available evidence.
The report is refreshed annually, and interim updates are made when material events occur, such as major regulatory decisions, large fleet commitments, or visible delays in commercialization. Before delivery, an analyst runs a fresh pass on key inputs so clients receive the latest updated view.
Mordor Intelligence's Air Taxi Market Estimate Compared With Other Published Estimates
Published market sizes for air taxis often vary because firms do not count the same revenue streams, and they also disagree on how fast commercialization can scale in the first years. Differences also come from how pricing is treated, which missions are included (intracity versus short intercity), and whether early-stage activity is counted as market revenue or treated as pre-commercial.
The main gap comes from whether aircraft sales, training, or infrastructure-linked revenue is blended into the number, where Mordor Intelligence keeps the value focused on passenger service revenue and adjusts early-year totals using fleet availability, realistic utilization, and route activation timing checks.
Benchmark comparison
| Source | Market Size | Gaps in Research Methodology |
|---|---|---|
| Mordor Intelligence | USD 3.76 B (2025) | |
| Industry Data Publisher A | USD 1.53 B (2025) | Uses a narrower service-revenue lens and tends to delay utilization ramp assumptions, which can suppress the near-term value even when planned deployments are publicly discussed. |
| Aviation Commentary Outlet B | USD 4.10 B (2025) | Applies faster adoption and higher early pricing with limited adjustment for certification and fleet delivery pacing, which can push the first years above what operations can support. |
The spread is mainly driven by scope choices and by how aggressively early operations are modeled before steady schedules are in place. By tying totals back to observable ramp constraints like fleet readiness, expected utilization, and trip economics, we can keep the estimate easier to reconcile when assumptions are revisited.


Key Questions Answered in the Report
How big is the air taxi market in 2026?
The air taxi market size is valued at USD 4.47 billion in 2026.
What growth rate is projected through 2031?
Revenue is expected to rise at a 18.79% CAGR, reaching USD 10.56 billion by 2031.
Which region will see the fastest expansion?
Asia-Pacific is forecasted to grow at a 25.20% CAGR, driven by supportive Chinese and Japanese policies.
What propulsion technology will dominate longer routes?
Hydrogen fuel-cell aircraft are advancing at a 20.85% CAGR, offering 150 km-plus range advantages over battery-only models.
What is the main regulatory hurdle?
Certification of advanced flight-control software remains the biggest bottleneck, capable of adding two–three years to approval timelines.
How concentrated is competition among eVTOL makers?
The field is highly fragmented; no single player holds more than 15% share, resulting in a concentration score of 3/10.
Page last updated on:






