
Air Quality Monitoring Software Market Size and Share
Market Overview
| Study Period | 2020 - 2031 |
|---|---|
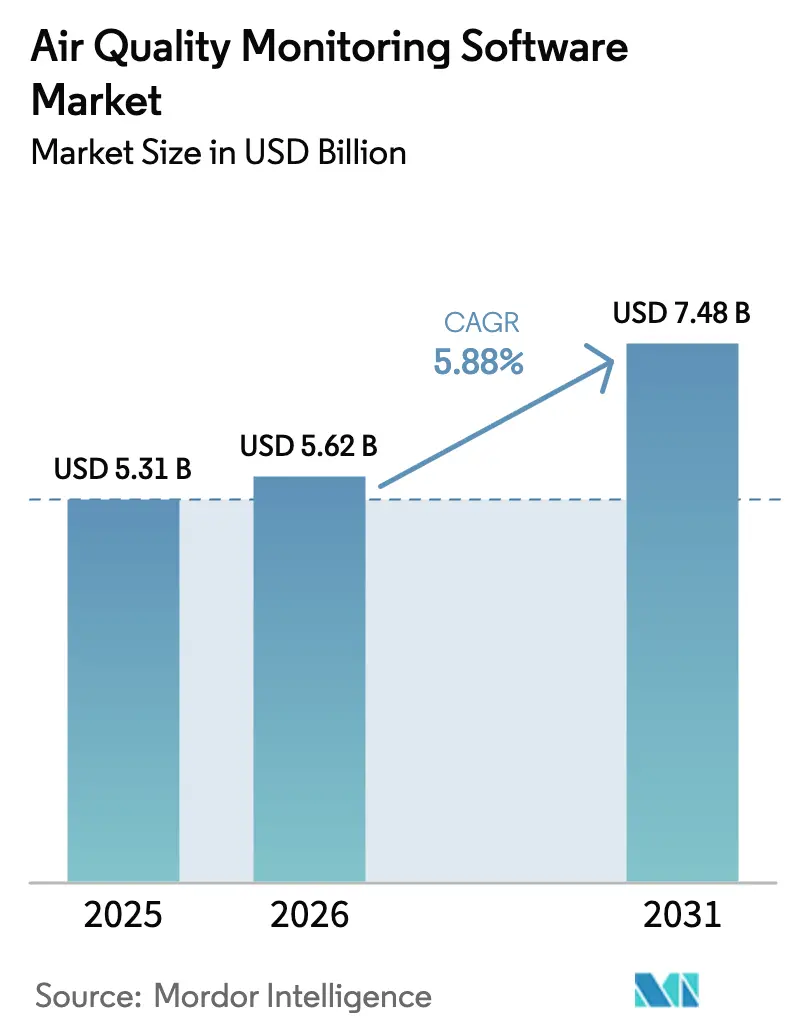
| Market Size (2026) | USD 5.62 Billion |
| Market Size (2031) | USD 7.48 Billion |
| Growth Rate (2026 - 2031) | 5.88 % |
| Fastest Growing Market | Asia-Pacific |
| Largest Market | Asia Pacific |
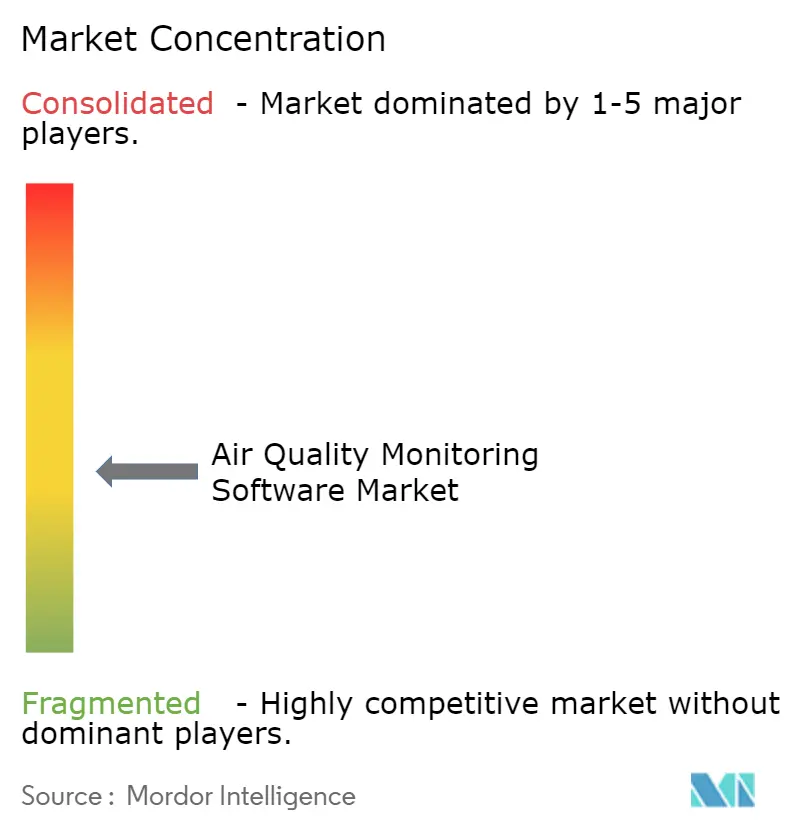
| Market Concentration | Medium |
Major Players *Disclaimer: Major Players sorted in no particular order Image © Mordor Intelligence. Reuse requires attribution under CC BY 4.0. | |
Air Quality Monitoring Software Market Analysis by Mordor Intelligence
The air quality monitoring software market size is expected to grow from USD 5.31 billion in 2025 to USD 5.62 billion in 2026 and is forecast to reach USD 7.48 billion by 2031 at 5.88% CAGR over 2026-2031. Rising disclosure mandates, smart-city investments, and post-pandemic indoor air quality (IAQ) standards are together enlarging the spending pool for enterprise-grade monitoring platforms. Demand accelerates as publicly listed companies prepare for Scope 3 reporting and as municipal agencies deploy dense sensor networks that require centralised data orchestration. Sensor miniaturisation lowers entry costs, enabling software-as-a-service (SaaS) models that appeal to small and medium enterprises. At the same time, predictive analytics powered by AI allow real-time forecasting and exposure mitigation for mobility and building-automation use cases. Interoperability gaps and GDPR-driven data-localisation requirements temper adoption but also open opportunities for regional vendors with compliant architectures.
Key Report Takeaways
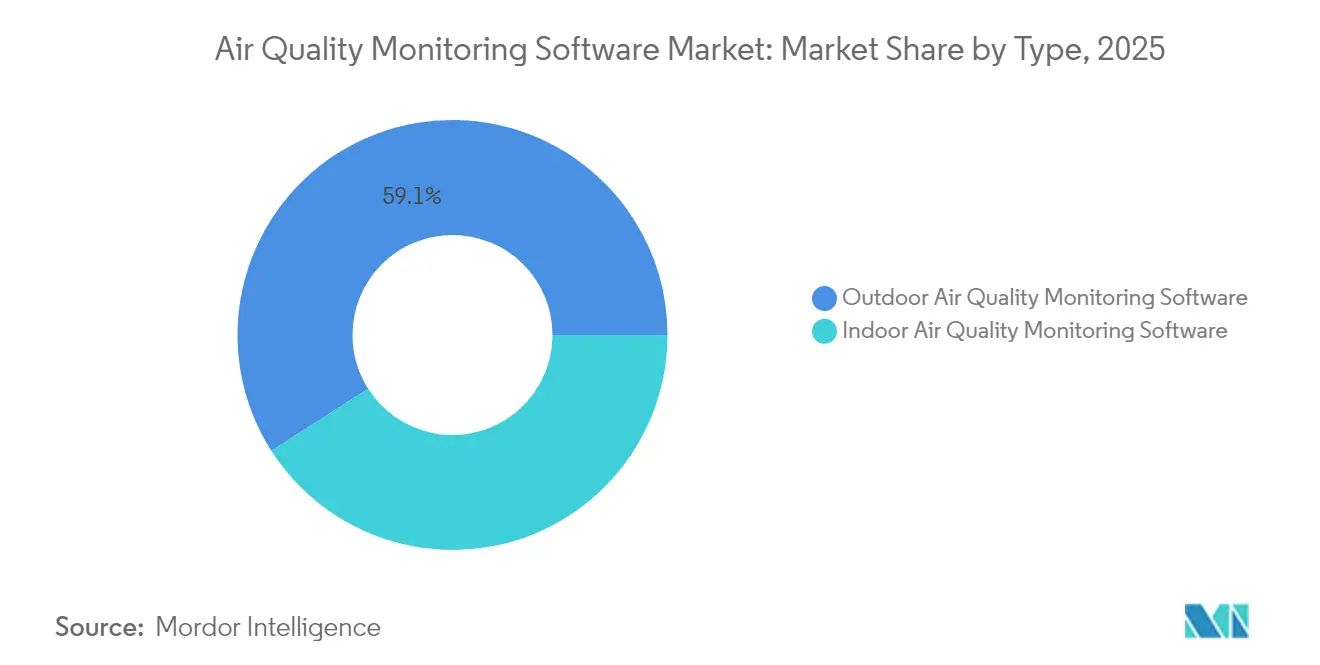
- By product type, outdoor solutions led with 59.05% of air quality monitoring software market share in 2025; indoor platforms are expected to grow at a 9.25% CAGR to 2031.
- By deployment mode, on-premise/hybrid retained 54.05% share of the air quality monitoring software market in 2025, while cloud-based offerings are expanding at an 10.85% CAGR through 2031.
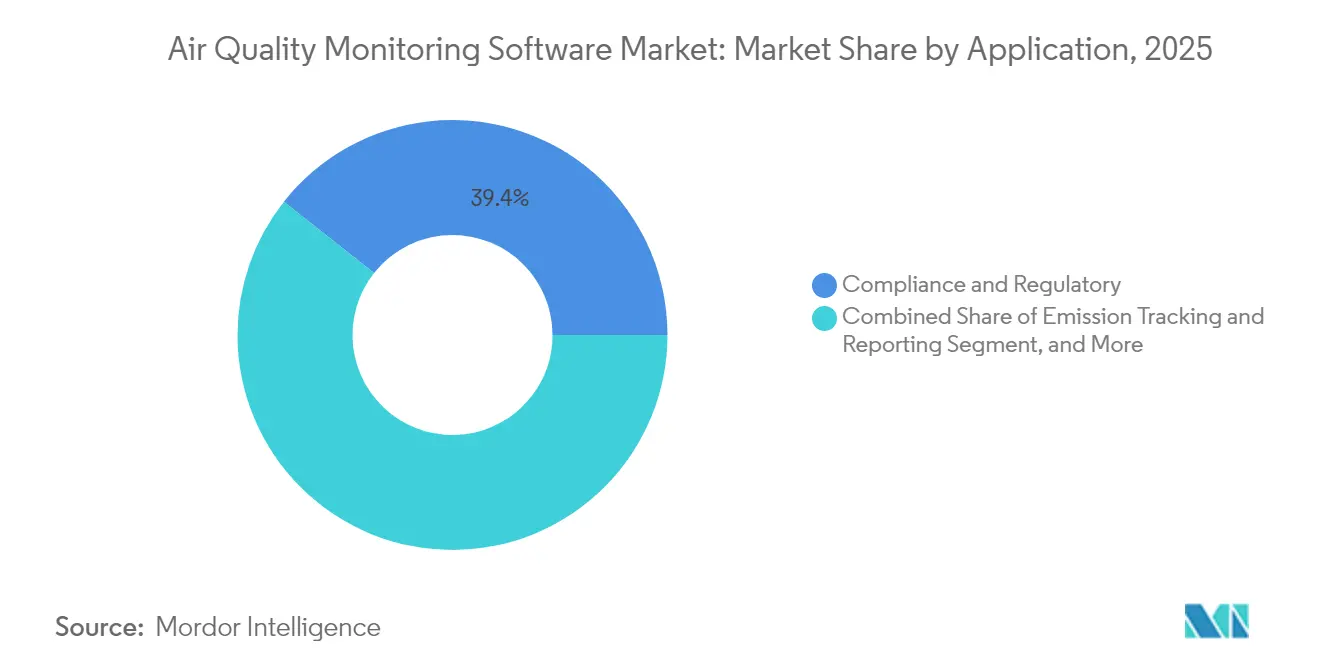
- By application, compliance and regulatory reporting captured 39.35% share of the air quality monitoring software market size in 2025; forecasting and modelling is projected to rise at an 7.85% CAGR by 2031.
- By end-user, government and municipal agencies held 34.15% revenue share in 2025; residential and commercial buildings segment is advancing at a 10.1% CAGR.
- By geography, Asia-Pacific commanded 27.75% revenue share in 2025 and is growing at an 8.05% CAGR on the back of smart-city grants and urbanisation pressures
Note: Market size and forecast figures in this report are generated using Mordor Intelligence’s proprietary estimation framework, updated with the latest available data and insights as of 2026.
Global Air Quality Monitoring Software Market Trends and Insights
Drivers Impact Analysis*
| Driver | (~) % Impact on CAGR Forecast | Geographic Relevance | Impact Timeline |
|---|---|---|---|
| Mandated ESG and Scope-3 disclosure rules | +1.8% | North America & Europe | Medium term (2-4 years) |
| Smart-city funding surge for hyper-local networks | +1.2% | Asia-Pacific, spill-over to MEA | Short term (≤ 2 years) |
| Post-COVID occupational IAQ standards | +0.9% | Global | Medium term (2-4 years) |
| Falling cost of IoT sensors | +0.7% | Global | Long term (≥ 4 years) |
| Carbon-credit platforms needing verifiable baselines | +0.5% | North America & Europe, expanding to APAC | Medium term (2-4 years) |
| AI-driven predictive dispersion modelling | +0.4% | Global urban centres | Long term (≥ 4 years) |
| Source: Mordor Intelligence | |||
Mandated ESG and Scope-3 disclosure rules
Climate-related reporting deadlines in California and forthcoming SEC regulations compel corporations to install continuous monitoring that can satisfy audit-grade traceability.[1] Scope 3 requirements extend visibility into supplier emissions, expanding the addressable customer base for the air quality monitoring software market. European GDPR rules drive demand for platforms with built-in data-localisation and anonymisation, benefiting regional providers able to guarantee compliance.
Smart-city funding surge for hyper-local networks
Asian governments finance dense networks of low-cost particulate-matter sensors to tackle urban pollution hotspots, creating large volumes of real-time data needing scalable analytics. Platforms that integrate multilingual dashboards and citizen-science inputs gain a competitive edge, positioning the air quality monitoring software market for rapid expansion in municipal procurement cycles.
Post-COVID occupational IAQ standards
ASHRAE 241 turned IAQ from a wellness feature into a compliance requirement for commercial buildings, pushing facility managers to embed continuous monitoring within HVAC controls.[2] Demand is strongest for software that maps pollutant levels against occupancy analytics, informing ventilation strategies that balance energy use and employee health
Falling cost of IoT sensors
Sensor prices have dropped while machine-learning calibration has lifted accuracy, enabling SaaS models priced for small enterprises. Distributors increasingly bundle hardware, connectivity, and dashboards, widening adoption and fuelling the long-run growth of the air quality monitoring software market.[3]
Restraints Impact Analysis*
| Restraint | (~) % Impact on CAGR Forecast | Geographic Relevance | Impact Timeline |
|---|---|---|---|
| Legacy hardware protocol fragmentation | −0.8% | Global, acute in industrial sectors | Medium term (2-4 years) |
| GDPR-linked data-privacy concerns | −0.6% | EU core, expanding globally | Long term (≥ 4 years) |
| Limited broadband in emerging regions | −0.4% | Africa, rural APAC, Latin America | Long term (≥ 4 years) |
| Municipal budget constraints vs open-source tools | −0.3% | Global, concentrated in developing markets | Short term (≤ 2 years) |
| Source: Mordor Intelligence | |||
Legacy hardware protocol fragmentation
Industrial sites run a mix of decades-old analysers and new IoT sensors that speak incompatible protocols, inflating integration costs and slowing roll-outs.[4] Vendors that support multi-protocol gateways or edge-computing adapters are better placed to capture demand within the air quality monitoring software market.
GDPR-linked data-privacy concerns
European rules classify location-specific sensor feeds as potentially personal data, obliging platforms to store or process information in-region and build consent workflows. The resulting architectural complexity raises operating costs and lengthens deployment timelines, particularly for cloud-native providers.
*Our forecasts treat driver/restraint impacts as directional, not additive. The impact forecasts reflect baseline growth, mix effects, and variable interactions.
Segment Analysis
By Type: Outdoor dominance continues while indoor accelerates
Outdoor solutions generated the majority of spending, accounting for 59.05% of air quality monitoring software market share in 2025, driven by regulatory mandates for ambient pollutant tracking around industrial zones and urban corridors. Municipal operators require platforms that visualise data from hundreds of roadside and rooftop stations, pushing suppliers toward high-availability architectures and map-based analytics.
Indoor platforms are advancing at a 9.25% CAGR through 2031. Corporate real-estate portfolios embed sensors into building-management systems to meet ASHRAE 241 and green building certifications, creating a high-growth niche for vendors offering HVAC optimisation algorithms. Growing emphasis on employee well-being and energy performance keeps momentum strong, making indoor monitoring an expanding pillar of the air quality monitoring software market.

By Deployment Mode: Cloud migration gathers pace
On-premise and hybrid installations kept 54.05% of revenue in 2025 as heavy industry and government agencies sought tight control over environmental data. These buyers connect supervisory control and data acquisition (SCADA) systems to local servers before passing selected streams to the cloud, blending low-latency alarms with advanced analytics.
Cloud-native offerings are growing 10.85% a year. Multi-tenant SaaS platforms ingest billions of sensor readings daily and apply machine-learning models that improve with aggregated datasets. Subscription pricing lowers capex and accelerates pilots, pulling new users-especially SMEs-into the air quality monitoring software market
By Application: Compliance dominates, forecasting rises
Compliance and regulatory reporting contributed 39.35% of 2025 spend as organisations sought audit-ready data logs for emissions permitting, ESG filings, and community-right-to-know portals. Software modules that automate chain-of-custody and version control of datasets remain core purchasing criteria.
Forecasting and modelling is climbing at an 7.85% CAGR. Deep-learning ensembles now predict urban PM2.5 and ozone levels with high fidelity, enabling route-planning, health-advisory, and demand-response services. As predictive accuracy improves, this segment widens the functional scope of the air quality monitoring software market.
By End-User: Public sector leadership enables private innovation
Government and municipal agencies held 34.15% share in 2025 after receiving USD 83 million in federal grants for network expansion, including allocations for disadvantaged communities. Public deployments set data standards that shape private-sector tender specifications.
Residential and commercial buildings represent the fastest-growing customer class at a 10.1% CAGR. Prop-tech managers integrate IAQ dashboards into space-utilisation analytics, while insurers start to incorporate indoor air metrics into policy pricing. This momentum diversifies revenue streams across the air quality monitoring software industry.
Geography Analysis
Asia-Pacific accounted for 27.75% of 2025 revenue and is expanding at an 8.05% CAGR as megacity authorities deploy hyper-local networks funded by national smart-city programmes. University-backed initiatives that fill PM2.5 data gaps further catalyse platform adoption across densely populated corridors.
North America leverages strong regulatory drivers, including California’s Scope 3 rules, and sizeable federal grants to modernise state-wide monitoring grids. Enterprise customers take advantage of mature cloud infrastructure, fuelling demand for AI-enabled forecasting modules within the air quality monitoring software market.
Europe records steady uptake as GDPR-compliant platforms carve out a premium niche. Vendors differentiate through in-region hosting and edge-processing capabilities that minimise personal-data exposure. Middle East & Africa adopt explainable-AI models for SO₂ prediction around industrial hubs, though patchy broadband coverage sustains demand for hybrid architectures.

Regulatory Landscape
Regulation remains a core demand lever for audit-grade air quality monitoring and reporting software. Requirements increasingly spell out methodology, data governance, and representativeness, not just pollutant limits. In the European Union, Directive (EU) 2024/2881 requires national transposition by December 11, 2026 and applies from December 12, 2026, raising the bar for how member states monitor, model, and publish air quality information. This tightening flows through to tender specifications for software workflows, QA/QC, and reporting.
Implementation detail is also moving through secondary acts that shape software functionality. Implementing Decision (EU) 2026/1208 (June 2026) sets methodological requirements for public atmospheric modeling systems and spatial representativeness of sampling stations, which reinforces demand for platforms that can document model configuration, inputs, uncertainty handling, and station metadata. Outside Europe, the United States continues to anchor ambient requirements through US EPA National Ambient Air Quality Standards in 40 CFR Part 50, with periodic reviews that support steady procurement of regulatory-grade monitoring and data management. Japan also adds an equipment-and-connectivity layer, with METI-linked JIS B 9920-2:2026 updates cited for IIoT air monitoring certification in cleanroom-driven sectors, effective August 1, 2026, which can pull software toward certified data acquisition, calibration traceability, and standardized protocols in high-cleanliness industrial environments.
Value Chain Analysis
The value chain extends from sensing and instrumentation hardware through data transport and software to domain services that convert measurements into compliance artifacts and operational actions. Upstream inputs include optical PM components, electrochemical cells, laser diodes, and precision gas sensor modules, creating long lead times for higher-spec components. Midstream work covers device design and manufacturing, PCB and enclosure production, calibration and certification workflows, firmware, and installation and commissioning services that connect stations, industrial sites, or buildings to central platforms.
Downstream, air quality monitoring software vendors and OEMs monetize via platform licensing or subscriptions. Revenue streams typically include data orchestration (ingestion, cleansing, QA/QC, and metadata management), analytics and modeling modules, and reporting packages aligned to regulators and ESG audit needs. The ecosystem increasingly involves cloud and edge infrastructure providers, integrators that connect monitoring to SCADA and building management systems, and service partners offering calibration-as-a-service and predictive maintenance. The move from one-time hardware sales toward recurring software and services is reinforced by tighter methodological requirements (for example, EU modeling-related specifications) and by large municipal sensor-network deployments that require ongoing data operations rather than periodic reporting alone.
Competitive Landscape
The market remains moderately fragmented. Instrumentation leaders such as Thermo Fisher Scientific retain long-standing regulatory relationships and have secured more than USD 12.9 million in US federal contracts for environmental monitoring equipment. Hardware suppliers are merging analytics capabilities, as seen in the July 2025 SICK–Endress+Hauser joint venture that pools 730 staff to advance emissions monitoring technology.
Start-ups focus on low-cost sensor networks and AI-ready data lakes, while platforms like OpenAQ encourage open-source data sharing, pressuring proprietary vendors on baseline functionality. Cloud hyperscalers demonstrate disruptive potential; Microsoft’s Aurora system performs globe-scale forecasting in less than a minute, setting new performance benchmarks.
Strategic moves underscore rising consolidation. Hitachi Construction Machinery took a stake in Envirosuite to extend monitoring into mining operations. Honeywell launched an emissions suite for offshore platforms, expanding its footprint in the air quality monitoring software market automation.
Air Quality Monitoring Software Industry Leaders
-
Thermo Fisher Scientific Inc.
-
Siemens AG
-
Robert Bosch GmbH.
-
Honeywell HBT
-
Aeroqual Ltd.
- *Disclaimer: Major Players sorted in no particular order
Market Opportunities and Future Outlook
A near-term whitespace is emerging from compliance-driven modernization cycles, where regulation specifies how monitoring data must be generated, modeled, and published. That creates upgrade needs beyond basic dashboarding. In the EU, the transposition and application timeline around Directive (EU) 2024/2881 (transposition by December 11, 2026, application from December 12, 2026), together with the June 2026 Implementing Decision (EU) 2026/1208 on modeling and station representativeness, favors vendors that can package end-to-end regulatory workflows. These include model governance, station metadata management, traceable QA/QC, and public-facing dissemination. It also increases demand for integration services that connect legacy networks and heterogeneous sensors into consistent, regulator-ready data pipelines.
In Asia, standards and sector-specific requirements create room for offerings that combine certified acquisition with modern interoperability. Japan has cited JIS B 9920-2:2026 requirements for IIoT air monitoring certification in cleanroom-heavy industries from August 1, 2026, which supports opportunities for software that automates calibration traceability, supports modern messaging and connectivity, and provides audit-ready logs for semiconductor and pharmaceutical facilities. Separately, smart-city programs and dense municipal networks support edge-enabled data validation and anomaly detection at scale. At the same time, the market shift toward cloud subscriptions (alongside on-premise/hybrid needs in government and heavy industry) leaves space for compliant hybrid architectures that meet data-localization and privacy constraints without giving up advanced analytics.
Recent Industry Developments
- July 2026: Thermo Fisher Scientific Inc. emphasized that its particulate monitoring solutions continue to be utilized for continuous ambient air monitoring and alignment with U.S. EPA and state-level regulatory programs. The initiative reinforces demand for the iQ series and supports Thermo Fisher's position in regulatory-grade ambient monitoring, which can translate into additional contract opportunities.
- June 2026: Thermo Fisher Scientific Inc. experts discussed the application of 5014iQ and 5030iQ monitoring solutions for complex industrial and urban environmental air quality management. The approach extends enterprise-grade monitoring for complex environments and may broaden cross-sell opportunities to municipal clients.
- April 2026: Thermo Fisher expanded its fugitive emissions monitoring capabilities by partnering with Opgal to distribute the EyeCGas Multi Optical Gas Imaging Camera alongside the Thermo Scientific TVA2020 Toxic Vapor Analyzer. The expansion strengthens portfolio integration and distribution channels and accelerates market penetration in oil and gas and refining.
Research Methodology Framework and Report Scope
Market Definition and Coverage
For this methodology, the market covers software platforms used to collect, manage, analyze, and report air quality data from indoor and outdoor monitoring setups, including dashboards, alerts, analytics, and compliance reporting delivered through cloud or on-premise deployments.
Scope exclusions: We exclude pure hardware instrument and sensor sales, installation-only services, and general-purpose building management software unless air-quality monitoring is the core paid function.
Segmentation Overview
- By Type
- Indoor AQ Monitoring Software
- Outdoor AQ Monitoring Software
- By Deployment Mode
- Cloud-based
- On-premise/Hybrid
- By Application
- Emission Tracking and Reporting
- Compliance and Regulatory
- Forecasting and Modeling
- Data Visualization and Analytics
- By End-User
- Residential and Commercial Buildings
- Industrial Facilities (Oil and Gas, Manufacturing, Power Plants)
- Government and Municipal Agencies
- Research Institutes and Universities
- By Geography
- North America
- United States
- Canada
- Mexico
- Europe
- Germany
- United Kingdom
- France
- Nordics
- Rest of Europe
- South America
- Brazil
- Rest of South America
- Asia-Pacific
- China
- Japan
- India
- South-East Asia
- Rest of Asia-Pacific
- Middle East and Africa
- Middle East
- Gulf Cooperation Council Countries
- Turkey
- Rest of Middle East
- Africa
- South Africa
- Rest of Africa
- Middle East
- North America
Data Sources, Market Sizing, and Validation
Desk Research
Desk work starts with building the demand and policy context, then translating it into software spending logic. We rely on non-paywalled public sources such as the US EPA (AQI and air-monitoring programs), the European Environment Agency (air-quality datasets), the World Health Organization (health guideline thresholds), and UN Environment data and publications to understand pollutant priorities and reporting behaviors.
We then use materials such as public company filings, investor presentations, government procurement portals, and trusted association and standards bodies (for example, ASHRAE and ISO air-related standards) to map typical software features, deployment patterns, and buyer groups. For cross-checks, we may use paid subscriptions for company financials and intelligence, news and financials, and patent databases to keep product and pricing assumptions consistent over time. The sources listed here are illustrative only, and many other references were used for data collection, validation, and clarification.
Primary Interviews and Surveys
Primary work was used to validate which parts of air quality monitoring are actually monetized through software, and how pricing behaves by deployment type and end user. We spoke with a mix of software providers, system integrators, channel partners, and user-side stakeholders across smart buildings, industrial EHS, and public agencies, covering major regions so adoption rates, renewal behavior, and typical contract sizes could be checked.
The most practical inputs were things like average sites per customer, typical module attach rates (alerts, analytics, reporting), and how often pricing gets reset during renewals. These inputs improved our assumptions and reduced the risk of over-counting.
Distribution of primary research fieldwork respondents
| Company type | Respondent position | Region |
|---|---|---|
| Top tier: 35% | CXOs: 12% | APAC: 46% |
| Mid tier: 46% | Functional/Unit leaders: 38% | EMEA: 36% |
| Smaller Players: 19% | Managers: 50% | Americas: 18% |
Market-Sizing & Forecasting
Sizing begins with a top-down reconstruction of addressable software spend by linking air-quality monitoring deployments to likely software attachment and recurring subscription behavior, then filtering it by the share of use cases that require continuous analytics and reporting. To keep the total realistic, we corroborate this with selective bottom-up approximations, such as sampled price-per-site ranges, contract-duration patterns, and roll-ups from a limited set of suppliers and channels, and then adjust where the two views diverge.
Inputs used in the model include, as illustrative examples, the installed base growth of indoor and outdoor monitoring points, cloud versus on-premise adoption in regulated environments, typical renewal cycles for SaaS subscriptions, average number of monitored locations per customer, and the add-on rate for advanced functions like forecasting and compliance reporting. Where pricing was unclear, we used bounded ranges from interviews, then applied conservative mid-points until additional checks were available.
Forecasting is run using scenario analysis supported by multivariate regression. Demand drivers such as policy tightening, smart building digitization, and municipal monitoring expansion are translated into adoption and pricing trajectories. Assumptions are kept transparent so each step can be repeated and challenged during analyst reviews.
Data Validation & Update Cycle
Model outputs are checked against independent signals, such as procurement activity, disclosed software revenue mixes in public filings, and shifts in air-quality reporting requirements that change monitoring intensity. When abnormal jumps appear, we revisit the driver assumptions, re-check the math, and re-contact selected interviewees to confirm whether the change is real or caused by scope overlap.
Before sign-off, results go through multi-step internal reviews focused on consistency across regions, year-to-year pricing logic, and currency conversion timing. Reports are refreshed annually, and interim updates are made when material events occur that can move adoption or budgets. Right before delivery, an analyst performs a fresh pass so clients receive the latest updated view.
Mordor Intelligence's Air Quality Monitoring Software Market Sizing Compared With Other Published Estimates
Published market numbers for air-quality monitoring software often move apart because the refresh timing, currency conversion windows, and subscription price progression assumptions are not aligned across studies. Some estimates also bundle adjacent items such as hardware platforms or broad environmental data tools, which changes what gets counted as software revenue.
A refresh-led gap shows up when pricing is carried forward mechanically, even though renewals, discounting, and module add-ons shift average selling prices over the year, and when older exchange rates are applied to multi-region totals. In our process, currency timing, renewal-linked ASP updates, and a late-stage validation pass tied to public procurement signals are used to keep the estimate current, which is the step applied by Mordor Intelligence.
Benchmark comparison
| Source | Market Size | Gaps in Research Methodology |
|---|---|---|
| Mordor Intelligence | USD 5.31 B (2025) | |
| Trade Publication A | USD 2.76 B (2024) | Often reflects a narrower revenue capture tied to software-only license or platform revenue, and it may use earlier-year FX rates and older price points without a renewal-based ASP reset. |
| Industry Portal B | USD 4.20 B (2025) | Commonly uses broad category mapping that can mix indoor air management and monitoring software, and it may apply faster price escalation assumptions without cross-checking against contract renewal patterns. |
The spread across figures is mainly explained by what gets included as software, how pricing is stepped forward, and how recently the inputs were refreshed. By keeping the scope tight to air-quality monitoring software revenue and by updating currency and ASP assumptions in line with interview and public-signal checks, the final number stays traceable to clear variables and repeatable steps.
Key Questions Answered in the Report
What is the current size of the air quality monitoring software market?
The market generated USD 5.62 billion in 2026 and is projected to reach USD 7.48 billion by 2031 at a 5.88% CAGR.
Which region leads spending on air quality monitoring platforms?
Asia-Pacific held 27.75% of global revenue in 2025 and shows the fastest growth, supported by smart-city initiatives and rapid urbanisation.
Why are indoor monitoring solutions growing faster than outdoor platforms?
Post-COVID health standards (e.g., ASHRAE 241) and green-building certifications have turned continuous IAQ tracking into a core operational requirement for commercial real estate.
How are disclosure regulations influencing demand?
Scope 3 rules in California and upcoming SEC climate disclosures oblige companies to deploy continuous monitoring that generates audit-grade data, directly boosting enterprise adoption.
What role does AI play in modern air quality software?
AI enables high-resolution forecasting, sensor calibration, and anomaly detection; Microsoft’s Aurora model forecasts global pollution in sub-minute times, illustrating the step-change in capability.
Are cloud-based deployments overtaking on-premise systems?
Yes. Although on-premise/hybrid still owns 54.05% share, cloud platforms are expanding at an 10.85% CAGR thanks to scalability and lower up-front costs.