
Air Quality Monitoring Market Size and Share
Market Overview
| Study Period | 2021 - 2031 |
|---|---|
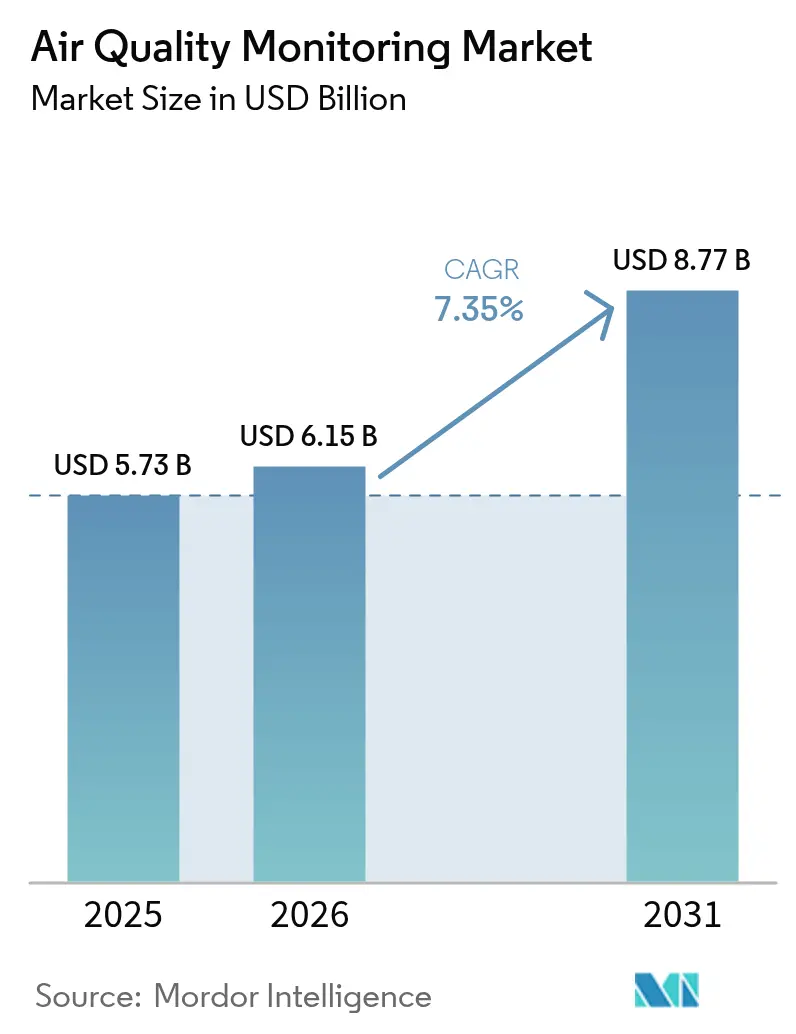
| Market Size (2026) | USD 6.15 Billion |
| Market Size (2031) | USD 8.77 Billion |
| Growth Rate (2026 - 2031) | 7.35 % |
| Fastest Growing Market | Asia Pacific |
| Largest Market | Asia Pacific |
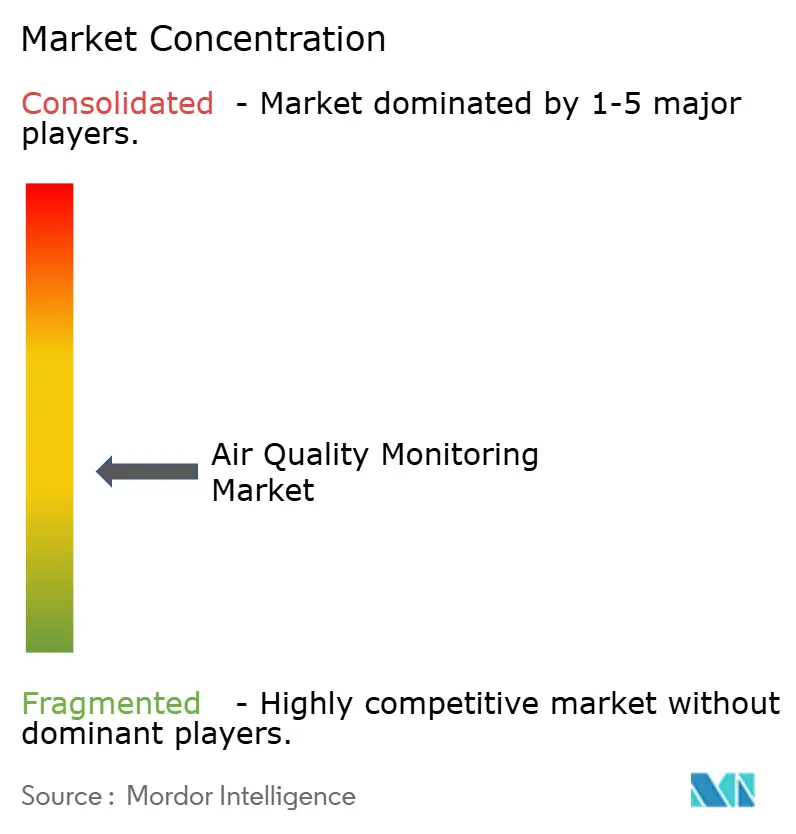
| Market Concentration | Medium |
Major Players *Disclaimer: Major Players sorted in no particular order Image © Mordor Intelligence. Reuse requires attribution under CC BY 4.0. | |
Air Quality Monitoring Market Analysis by Mordor Intelligence
The Air Quality Monitoring Market size was valued at USD 5.73 billion in 2025 and estimated to grow from USD 6.15 billion in 2026 to reach USD 8.77 billion by 2031, at a CAGR of 7.35% during the forecast period (2026-2031).
Tightened regulatory standards, rising corporate sustainability disclosures, and continuous technological innovation in sensors, IoT, and analytics are converging to lift demand for end-to-end ambient and indoor monitoring solutions. Implementation momentum is strongest where regulations now mandate daily or real-time reporting—such as the United States’ strengthened PM2.5 rule and the EU’s Corporate Sustainability Reporting Directive—while smart-city grants across Asia-Pacific add further scale. Hardware still anchors most procurements, yet software platforms that transform raw measurements into regulatory-ready analytics are scaling fast. Competition remains moderate as long-established reference-grade instrument suppliers defend their share against low-cost sensor specialists and cloud-native entrants.
Key Report Takeaways
- By product type, outdoor monitors held 62.40% of the air quality monitoring market share in 2025, whereas indoor monitors are poised for a 9.10% CAGR through 2031.
- By sampling method, continuous accounted for 55.30% of the market share in 2025 and is projected to grow by 8.25% CAGR through 2031.
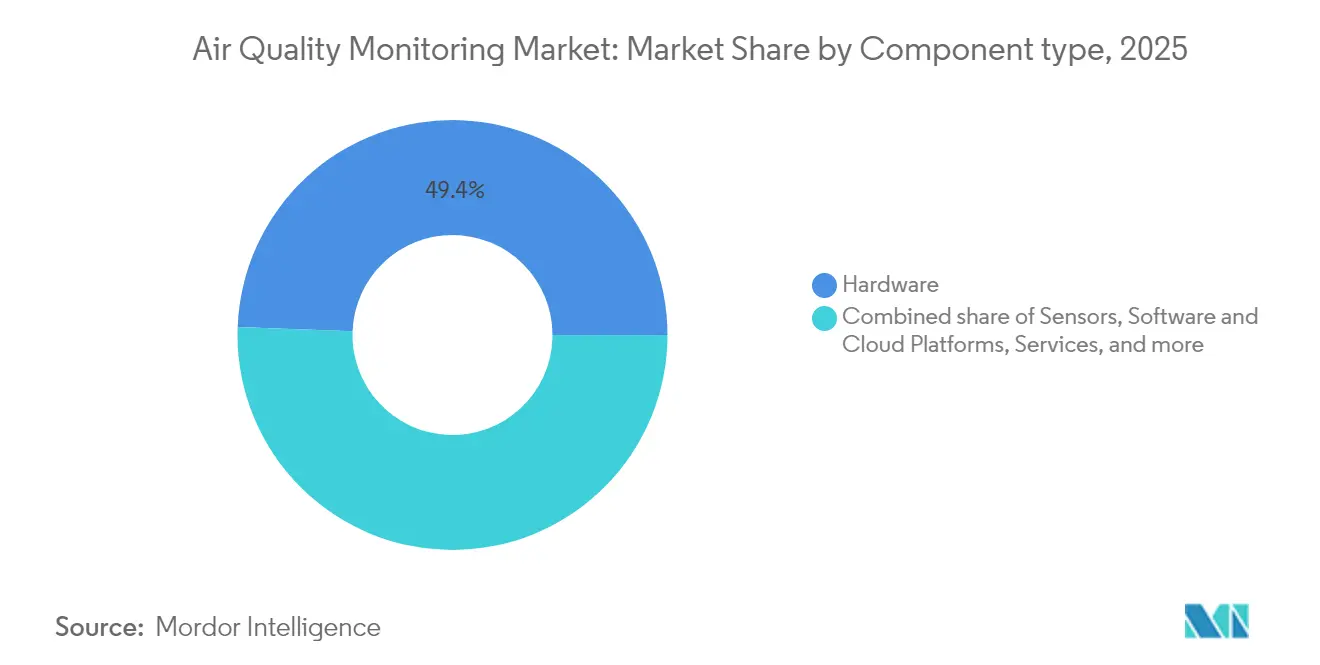
- By component, hardware captured 49.40% revenue share in 2025, while software and cloud platforms are set to expand at a 9.55% CAGR by 2031.
- By pollutant parameter, particulate pollutants held 56.20% of the air quality monitoring market share in 2025, whereas biological pollutants are poised for a 8.95% CAGR through 2031.
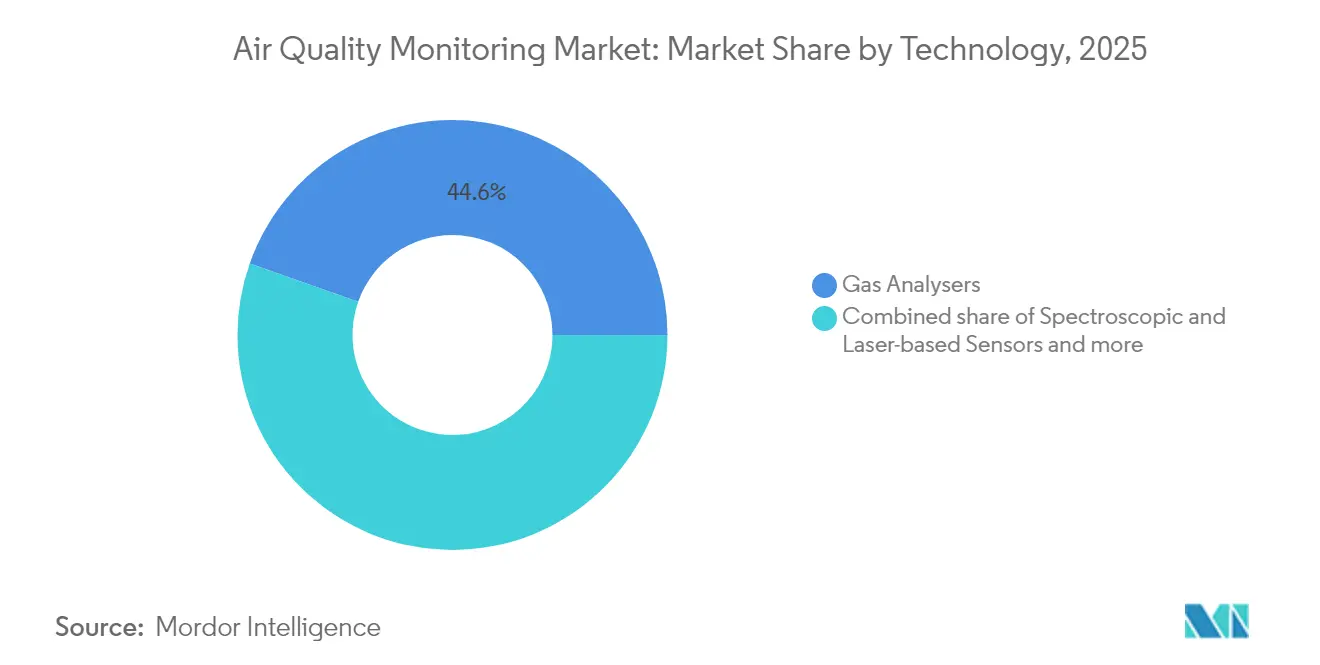
- By technology, gas analysers accounted for 44.60% of the market share in 2025, whereas spectroscopic and laser-based sensors are projected to grow by 8.60% CAGR through 2031.
- By deployment mode, fixed monitoring stations captured 64.20% revenue share in 2025, while drone-mounted and mobile platforms are set to expand at a 9.15% CAGR by 2031.
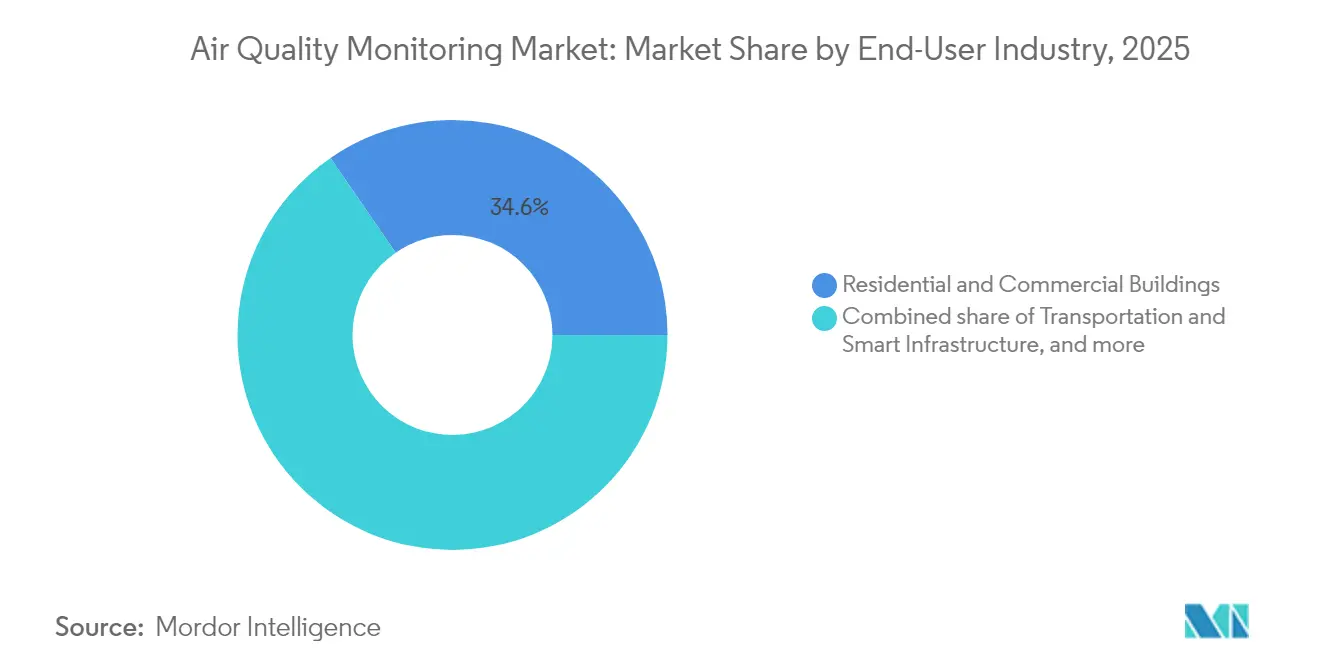
- By end-user, residential and commercial buildings accounted for 34.60% of the air quality monitoring market in 2025; residential and commercial buildings applications are advancing at an 7.75% CAGR through 2031.
- By geography, Asia-Pacific led with 37.50% revenue share in 2025 and is forecast to register the fastest 8.55% CAGR between 2026-2031.
Note: Market size and forecast figures in this report are generated using Mordor Intelligence’s proprietary estimation framework, updated with the latest available data and insights as of 2026.
Market Trends and Insights
Drivers Impact Analysis of Air Quality Monitoring Market*
| Driver | (~) % Impact on CAGR Forecast | Geographic Relevance | Impact Timeline |
|---|---|---|---|
| National-level roll-outs of low-cost sensor networks in Asian smart-city programs | +1.20% | Asia-Pacific core, spill-over to MEA | Medium term (2-4 years) |
| Corporate ESG disclosure mandates in EU requiring real-time ambient data for Scope 3 reporting | +0.80% | Europe & North America, expanding to APAC | Short term (≤ 2 years) |
| Rise of wildfire smoke events in North America driving demand for distributed PM sensors | +0.60% | North America, with spillover to Australia | Short term (≤ 2 years) |
| Integration of AQ data into HVAC automation in commercial buildings post-COVID | +0.50% | Global, with early gains in North America & EU | Medium term (2-4 years) |
| Mandatory fence-line monitoring around US petrochemical clusters after EPA OOOOa rule | +0.40% | North America, with regulatory spillover to EU | Long term (≥ 4 years) |
| Deployment of drone-based monitoring for methane & VOC detection in O&G assets | +0.30% | Global, concentrated in major O&G regions | Medium term (2-4 years) |
| Source: Mordor Intelligence | |||
National-level roll-outs of low-cost sensor networks in Asian smart-city programs
Extensive smart-city budgets across China, India, and Japan are underwriting dense sensor deployments that fill spatial data gaps left by sparse reference-grade stations. China’s Blue Sky Protection Campaign now covers 269 cities and leverages digital integration to cut PM2.5 levels in resource-heavy municipalities.(1)Hyderabad’s 49-node grid spanning 4 km² illustrates how granular data surfaces seasonal PM patterns missed by legacy networks.(2)Japanese researchers apply AI algorithms—AIRTrans—to satellite inputs, lowering aerosol optical thickness errors and guiding local compliance programs. Bulk procurement volumes push sensor prices down, accelerating adoption and giving policymakers evidence to direct targeted emission controls.
Corporate ESG disclosure mandates in EU requiring real-time ambient data for Scope 3 reporting
Roughly 50,000 companies must now file granular emissions accounts under the EU Corporate Sustainability Reporting Directive, spurring investments in continuous ambient monitoring to support Scope 3 calculations. Banks follow European Banking Authority rules that embed air quality risks into credit assessments.(3) California’s Climate Corporate Data Accountability Act and Australia’s incoming disclosure penalties reinforce the global trend, compressing compliance timelines and lifting demand for automated monitoring networks that integrate directly with greenhouse gas inventories.
Rise of wildfire smoke events in North America driving demand for distributed PM sensors
Wildfires that blanketed the Midwest and Eastern Seaboard in 2023 raised emergency room visits and highlighted gaps in real-time smoke data. Rapid-deployment projects such as Caltech’s PHOENIX network install low-cost PM sensors within days of ignitions, feeding local alerts. Satellite-driven smoke algorithms presented at the American Geophysical Union meeting classify city-level exposure hot spots, prompting municipalities to adopt permanent sensor arrays for community warnings. Portable multi-parameter kits for first responders extend protection to frontline personnel.
Integration of AQ data into HVAC automation in commercial buildings post-COVID
Building owners increasingly link IAQ sensors to BMS platforms that modulate ventilation in real-time. Siemens’ Smart Air Quality offering supports the US EPA Clean Air in Buildings Challenge and demonstrates combined IAQ gains and energy savings. Quebec’s 47,000-sensor school network transmits readings every five minutes via LoRaWAN, enabling timely ventilation changes while capturing more than 7 million messages daily. Academic pilots show CO₂-based occupancy detection can drive demand-controlled ventilation strategies that lower energy bills without sacrificing air quality.
Restraints Impact Analysis of Air Quality Monitoring Market*
| Restraint | (~) % Impact on CAGR Forecast | Geographic Relevance | Impact Timeline |
|---|---|---|---|
| Calibration-drift & accuracy issues of low-cost sensors limiting bulk procurements | -0.90% | Global, particularly affecting developing markets | Short term (≤ 2 years) |
| Delays in 5G/LPWAN roll-outs in rural Africa hindering remote-station connectivity | -0.40% | Sub-Saharan Africa, with spillover to rural Asia | Medium term (2-4 years) |
| High maintenance cost of reference-grade analyzers for cash-strapped municipalities | -0.30% | Global, concentrated in emerging markets | Long term (≥ 4 years) |
| Complex multi-jurisdictional certification (EPA EQOA, EU CEN) slowing time-to-market | -0.20% | North America & Europe, affecting global suppliers | Medium term (2-4 years) |
| Source: Mordor Intelligence | |||
Calibration-drift & accuracy issues of low-cost sensors limiting bulk procurements
Field trials show that machine-learning recalibration can improve NDIR CO₂ sensor accuracy by 65%, yet inter-model variability remains wide, and temperature or humidity swings still skew particulate readings.(4) Agencies such as the US EPA and European AirSensEUR project are drafting harmonized calibration protocols, but until those frameworks mature, city planners often cap purchase volumes or keep sensors in pilot mode. Quantile mapping and other statistical corrections add cost and complexity, tempering near-term uptake in budget-sensitive regions.
Delays in 5G/LPWAN roll-outs in rural Africa hindering remote-station connectivity
Studies from GSMA highlight the lag in 5G coverage across sub-Saharan markets, making real-time uploads from remote monitors unreliable. LoRaWAN backbones solve some power and cost issues but still need dense gateway placement, a hurdle for sparsely populated areas. Cellular router workarounds—such as Teltonika’s RUT-series deployments—perform well in Europe yet depend on local network quality. Without communications and power resilience, project scale-up in rural districts slows, limiting data visibility where public health needs are acute.
*Our forecasts treat driver/restraint impacts as directional, not additive. The impact forecasts reflect baseline growth, mix effects, and variable interactions.
Air Quality Monitoring Market Segment Analysis
By Product Type:
Outdoor dominance maintains regulatory backboneOutdoor analyzers delivered 62.40% of 2025 revenues as federal rules, including the US EPA’s stricter PM2.5 limit of 9 µg/m³, imposed round-the-clock compliance checks. Fixed stations equipped with Federal Reference Method instruments form the air quality monitoring market size cornerstone for government networks. Complementing them are mobile platforms, including university-developed drones that sample plume constituents in three-dimensional profiles.
Indoor monitors are the fastest risers, expanding at 9.10% CAGR by catering to post-pandemic ventilation mandates and healthy-building certifications. Portable badges and room sensors connect over BLE, Wi-Fi, or LoRaWAN, streaming data into BMS dashboards for real-time HVAC adjustments. Feature integration—temperature, RH, PM, TVOC, and eCO₂ in one board—cuts deployment friction and enhances uptake across offices, classrooms, and healthcare settings.


By Sampling Method:
Continuous monitoring secures compliance confidenceContinuous systems account for 55.30% of the air quality monitoring market size, championed by EPA Performance Specification 19 for ethylene oxide CEMS and parallel NSPS logic that require automatic data capture at one-minute intervals. Industrial operators prefer laser-based continuous analyzers that auto-zero and self-calibrate, cutting maintenance downtime.
Continuous methods grow 8.25% annually thanks to their cost advantage for dense grids. Cartridge-based passive samplers at petrochemical fence lines and battery-powered mini-stations on urban lampposts gather legally defensible snapshots where 24 × 7 power is infeasible, broadening spatial coverage without heavy capital outlays.
By Component:
Hardware foundation enables software-led value creationHardware retained a 49.40% share in 2025. Compliance projects still specify chemiluminescence or FDMS PM modules to match statutory uncertainty thresholds.
Software and cloud platforms, projected to scale 9.55% CAGR, transform raw signals into insights through AI-enabled calibration, forecasting, and compliance dashboards. The UAE’s 31-station National Air Quality Platform feeds a machine-learning model that predicts three-day episodes and informs traffic planning. Multitenant SaaS architectures also simplify enterprise Scope 3 reporting, driving subscription stickiness.
By Pollutant Parameter:
Particulate standards tighten, biology emergesRegulators’ focus on PM2.5 and PM10 underpins 56.20% share for particulate sensors. Europe’s new directive will add mandatory ultrafine particle counts by 2030, steering demand to condensation particle counters and SMPS units.
Biological monitoring is the quickest-growing slice at 8.95% CAGR as research links bioaerosols with haze events and allergenic burdens. Sensors that trap spores and RNA fragments are moving from labs into municipal stations, enabling health departments to warn vulnerable populations more precisely.
By Technology:
Spectroscopy lifts accuracy ceilingGas analyzers still lead with a 44.60% share, leveraging decades of chemiluminescence and NDIR reliability. Yet spectroscopic and laser-based modalities, advancing at 8.60% CAGR, now meld FTIR, UV-DOAS, and LiDAR in compact footprints. Chinese-developed SkyLidar systems produce three-dimensional scans of PM2.5, while AI-enhanced satellite retrievals like AIRTrans shrink aerosol error margins for policymakers.
By Deployment Mode:
Fixed grids anchor, drones accelerateFixed stations contribute 64.20% of the 2025 value, delivering long-term baselines required for NAAQS attainment plans. New procurement favors modular huts with integrated gas, PM, meteorology suites, and redundant power.
Drone and other mobile platforms expand 9.15% annually. Systems such as Botlink’s 7-kg multicopter measure NO₂, SO₂, CO, and O₃ over a 15-mile radius, useful in wildfire smoke mapping and pipeline leak surveys. Hybrid networks that fuse fixed, portable, and drone data streams provide fuller spatial granularity.
By End-User Industry:
Residential and commercial buildings spearhead new growthResidential and commercial buildings remained the largest buyers, holding a 34.60% share, due to the growing construction activities in the developing countries.
Residential and commercial buildings log the fastest 7.75% CAGR. Thanks to regulatory mandates, smart buildings, LEED/green certifications, and HVAC/BMS integration, commercial buildings are driving the market. In addition, Residential is fueled by smart-home demand, consumer health awareness, and higher adoption of portable & integrated monitors.
Geography Analysis
APAC Air Quality Monitoring Market
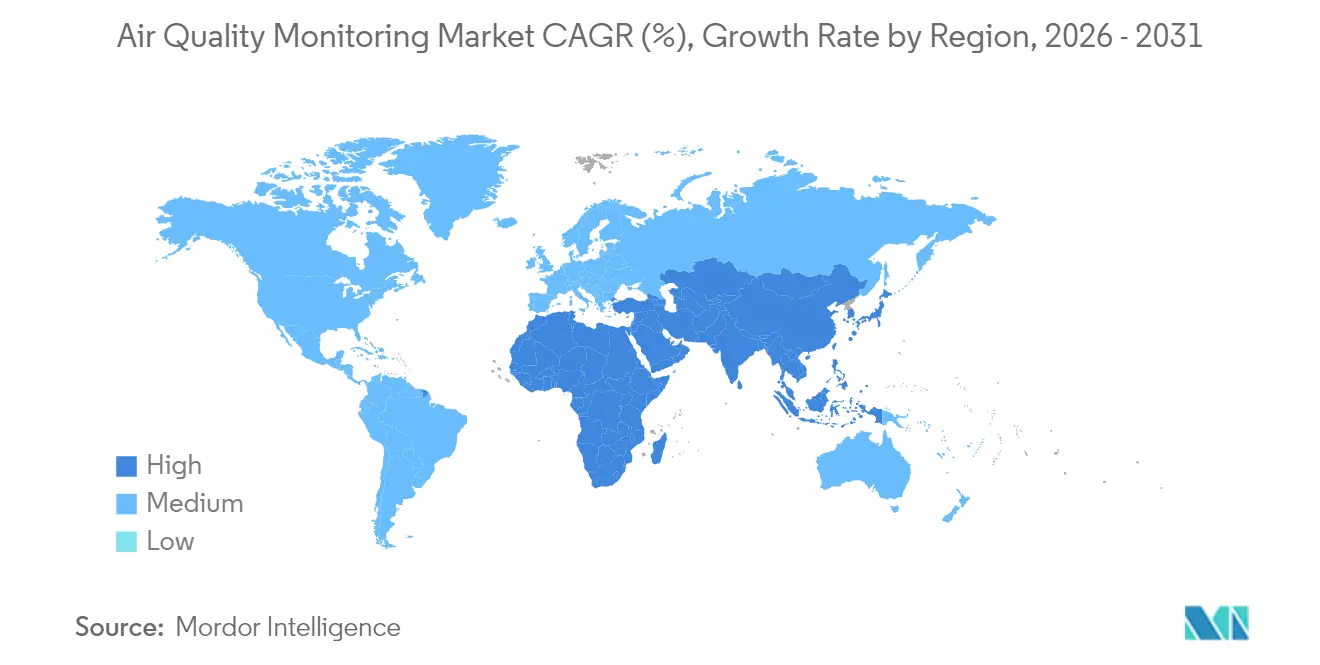
Asia-Pacific delivered 37.50% of 2025 revenue, and the fastest 8.55% CAGR through 2031, buoyed by China’s 269-city Blue Sky grid and India’s district-level pilots that reveal hyper-local pollution nuances. Japan’s AI-powered satellite analytics further elevate regional technical sophistication. Manufacturing depth lowers per-unit sensor costs, tilting global supply chains toward the region and helping governments roll out thousands of nodes in compressed timeframes.
Middle East Air Quality Monitoring Market
The Middle East is the second fastest growing region through 2030 due to sovereign commitments to smart-city livability targets. The UAE operates 31 AI-enabled stations and funds USD 500 million for new mobile units, while Saudi Arabia equips 7,000 industrial sites for continuous emissions checks. Offshore research cruises and carbon-based sensor R&D underscore regional scientific ambition.
The Americas, Europe and Africa Air Quality Monitoring Market
North America remains regulation-driven, anchored by the EPA’s updated PM2.5 standard that obliges daily Air Quality Index reporting in all metros above 350,000 residents. Wildfire smoke episodes spanning from British Columbia to the Mid-Atlantic catalyze community sensor deployments and emergency service toolkits. Europe’s growth is shaped by ESG mandates and the 2024 Ambient Air Quality Directive that introduces ultrafine particle metrics. South America and Africa seize pilot funding yet face telecom and power gaps that slow remote-station rollout, though LoRaWAN and solar kits begin to close the divide in urban clusters.
Mordor Intelligence provides coverage of the air quality monitoring market across other key regional markets, including Asia, South America, Europe, and Middle East and Africa, each with their regulatory frameworks and demand patterns.
Regulatory Landscape
Air quality monitoring demand is anchored in tighter ambient-air standards and more prescriptive reporting frameworks across major regions. In the United States, the US EPA finalized a stricter primary annual PM2.5 National Ambient Air Quality Standard of 9.0 micrograms per cubic meter in February 2024, raising the compliance bar for reference-grade networks, continuous sampling, and QA/QC programs used for attainment planning and public reporting.
In Europe, Directive (EU) 2024/2881 entered into force on 10 December 2024 and resets 2030 attainment targets while adding stronger technical requirements around modelling and spatial representativeness. The European Commission adopted an implementing decision in January 2026 covering technical details for air quality modelling and representativeness assessments, and Member States face a transposition deadline of 11 December 2026. This timetable supports continued procurement of compliant monitoring hardware and regulatory-ready analytics.
Competitive Landscape
The market structure is moderately fragmented. Thermo Fisher Scientific, Teledyne Technologies, and Siemens guard installed bases thanks to EPA Federal Reference Method certifications, while Sensirion, Bosch Sensortec, and PurpleAir monetize low-cost sensor volumes for citizen science and IoT stacks. Consolidation is underway: SICK transferred about 800 staff into a joint venture with Endress+Hauser to strengthen gas analysis portfolios, and DwyerOmega’s 2024 acquisition of Process Sensing Technologies widened vertical reach into pharma and energy.
Competitive advantage increasingly hinges on software differentiation. Teledyne’s ACES aircraft suite pairs laboratory-grade analyzers with cloud ingestion for flight safety analytics. Mobile Physics pioneers consumer cellphone sensing to crowd-source urban exposure maps. Vendors with ready pathways through multi-jurisdictional certifications protect premium pricing, whereas analytics-first newcomers target subscription margins above commoditized hardware. Opportunities also open in biological monitoring and drone platforms, where reference standards are still nascent and early movers can set de facto benchmarks.
Air Quality Monitoring Industry Leaders
-
Siemens AG
-
Thermo Fisher Scientific Inc.
-
Horiba Ltd
-
Emerson Electric Co.
-
MicroJet Technology Co., Ltd.
- *Disclaimer: Major Players sorted in no particular order
Air Quality Monitoring Market Companies Covered in this Report
- Thermo Fisher Scientific Inc.
- Teledyne Technologies Inc.
- Siemens AG
- Honeywell International Inc.
- Horiba Ltd.
- TSI Inc.
- Emerson Electric Co.
- 3M Company
- Merck KGaA
- Agilent Technologies Inc.
- Aeroqual Ltd.
- Vaisala Oyj
- ABB Ltd.
- Ametek Inc.
- ENVEA Group
- AlphaSense Ltd.
- Sensirion AG
- Bosch Sensortec GmbH
- Oizom Instruments Pvt Ltd.
- Kaiterra Inc.
- Breeze Technologies UG
- PurpleAir Inc.
- Ecotech Pty Ltd (ACOEM)
- Opsis AB
- FLIR Systems (Teledyne FLIR)
Market Opportunities and Future Outlook
The current opportunity set is concentrated around compliance-driven network modernization and a shift from single-pollutant stations to integrated, multi-pollutant and analytics-enabled deployments. In the EU, the recast Ambient Air Quality Directive (EU) 2024/2881 is already in force, with an 11 December 2026 transposition deadline and stronger modelling and representativeness expectations. This combination leaves room for vendors that pair certified instruments with software workflows for modelling inputs, QA/QC, and auditable reporting, particularly where zones need to plan ahead for 2026-2029 when measured outcomes track against the revised 2030 standards.
North America also continues to show visible, incremental expansion and modernization through federal programs, supporting repeat purchasing, services, and data-platform needs. The US EPA CASTNET network plan logged operational changes in 2026, including resuming monitoring at Cedar Creek, WV on March 2, 2026 and adding a new small footprint filter pack site in Caddo, OK on April 6, 2026. Alongside public funding mechanisms, including approximately USD 83 million in one-time Inflation Reduction Act grants allocated for state, local, and tribal fence-line, multipollutant, and air sensor monitoring activities (as of 2024/2025), vendors offering turnkey deployment, calibration services, and cloud integration can better align with multi-year rollout programs rather than one-off instrument sales.
Recent Industry Developments in Air Quality Monitoring Market
- June 2026: Horiba Ltd. reported that its AP-380 series air quality monitors received multiple type approvals, including from the US Environmental Protection Agency and Germany’s Federal Environment Agency (UBA) with TÜV Rheinland, as well as approvals involving the UK Environment Agency (via CSA Group), South Korea’s NIER, and China’s SAMR. Multi-regulator clearance reduces barriers to multinational rollouts and supports broader use beyond single-country reference networks. It also raises competitive pressure on suppliers lacking comparable certification coverage across key regulatory jurisdictions.
- January 2025: Emerson Electric Co. launched the AVENTICS DS1 dew point sensor for real-time monitoring of humidity and air quality in compressed air and industrial gas processes. The product extends air quality monitoring into plant utility systems where condition monitoring and contamination control are tied to uptime and quality assurance. This broadens the addressable market toward industrial facilities adopting continuous sensing at more points than traditional perimeter or ambient stations.
- July 2024: Thermo Fisher Scientific introduced the 5014iQ Beta Attenuation Monitor and 5030iQ SHARP Monitor following approvals from the US EPA and China’s CCEP. Regulatory approvals help standardize equipment choices for government networks and regulated industrial users that require defensible measurement methods. The launch reinforces the role of reference-grade and near-reference-grade PM instrumentation even as low-cost sensor deployments expand for dense coverage.
Air Quality Monitoring Market Report Scope and Research Methodology
Market Definition and Coverage
For this methodology, the market covers revenues generated from equipment and systems used to measure and track air pollutants in indoor or outdoor settings, including fixed and portable monitoring deployments.
Scope exclusions: We exclude adjacent lab testing services and consulting-only environmental audits where no monitoring hardware or monitoring system revenue is involved.
Segments Covered in This Report
- By Product Type
- Indoor Monitors (Fixed/Stationary Indoor and Portable/Wearable Indoor)
- Outdoor Monitors (Fixed/Stationary Outdoor and Portable/Mobile Outdoor)
- By Sampling Method
- Continuous
- Manual
- Intermittent/Passive
- By Component
- Hardware
- Sensors
- Samplers and Pumps
- Data Loggers and Analysers
- Software and Cloud Platforms
- Services (Calibration, Maintenance, Data Subscriptions)
- By Pollutant Parameter
- Particulate Pollutants (PM1, PM2.5, PM10, UFP)
- Gaseous Pollutants (NOx, SO?, O?, CO, VOCs)
- Toxic Metals and Radionuclides (Pb, Hg, Radon)
- Biological Pollutants (Pollen, Mould Spores, Bacteria)
- By Technology
- Gas Analysers (Chemiluminescence, NDIR, FID)
- Particle Counters (Optical, Gravimetric, Beta-attenuation)
- Spectroscopic and Laser-based Sensors (FTIR, UV-DOAS, LiDAR)
- By Deployment Mode
- Fixed Monitoring Stations
- Portable Detectors
- Wearable AQ Sensors
- Drone-mounted and Mobile Platforms
- By End-User Industry
- Residential and Commercial Buildings
- Industrial Facilities (Power Generation, Oil, Gas and Petrochemicals, Mining and Metallurgy, and Discrete and Process Manufacturing)
- Government and Academic Research
- Healthcare Facilities
- Transportation and Smart Infrastructure (Airports, Tunnels, Smart-City Networks)
- By Geography
- North America
- United States
- Canada
- Mexico
- Europe
- United Kingdom
- Germany
- France
- Spain
- Nordic Countries
- Russia
- Rest of Europe
- Asia-Pacific
- China
- India
- Japan
- South Korea
- Malaysia
- Thailand
- Indonesia
- Vietnam
- Australia
- Rest of Asia-Pacific
- South America
- Brazil
- Argentina
- Colombia
- Rest of South America
- Middle East and Africa
- United Arab Emirates
- Saudi Arabia
- South Africa
- Egypt
- Rest of Middle East and Africa
- North America
Data Sources, Market Sizing, and Validation
Desk Research
Desk research was used to frame the market boundary and to anchor key input series that are publicly repeatable. We relied on official and open sources such as the US Environmental Protection Agency (air monitoring basics and pollutant definitions), the World Health Organization (air quality guidance and exposure framing), the European Environment Agency (ambient air reporting and indicators), and the World Bank (urbanization and macro indicators).
To translate that context into a sizing model, we also reviewed supporting materials such as government tender portals for monitoring projects, customs and trade statistics where available for relevant instrument categories, standards and method notes from bodies such as ISO and NIST, and peer-reviewed journals that describe common measurement approaches and sensor performance limits. Company filings and investor presentations were used to understand product mix language and typical revenue streams, and a paid subscription for company financials and a patent database were used selectively to reduce blind spots. These examples are not exhaustive, and many other public sources were reviewed to collect, cross-check, and clarify data points.
Primary Interviews and Surveys
Primary work focused on validating what gets purchased, how pricing is evolving, and what parts of demand are tied to regulation versus voluntary monitoring. We spoke with a mix of manufacturers, channel partners, system integrators, and end users across APAC, EMEA, and the Americas so assumptions could be stress-tested across different compliance regimes and adoption maturity.
Distribution of primary research fieldwork respondents
| Company type | Respondent position | Region |
|---|---|---|
| Top tier: 33% | CXOs: 15% | APAC: 40% |
| Mid tier: 52% | Functional/Unit leaders: 29% | EMEA: 37% |
| Smaller Players: 15% | Managers: 56% | Americas: 23% |
Market-Sizing & Forecasting
Sizing starts with a top-down build where environmental monitoring spend signals and deployment intensity are reconstructed by region, and then mapped to air monitoring use cases through adoption rates. To keep totals grounded, we run selective bottom-up checks using sampled shipment proxies and installed-base refresh assumptions, followed by average selling price (ASP) bands for fixed stations, portable monitors, and sensor modules.
A few practical inputs that move the model are monitored closely, such as the number of ambient monitoring stations added or upgraded, the share of continuous versus manual sampling in industrial sites, typical pollutant coverage (for example PM2.5 and NOx) that drives sensor count per site, replacement cycles for analyzers and sensors, and public procurement intensity for smart city or compliance programs. Where volume signals were incomplete, gaps were handled by using comparable market penetration in similar regulatory settings, and then adjusted after channel checks.
For forecasting, scenario analysis is used so adoption can be flexed under faster regulation tightening, stable enforcement, or delayed capital budgets. The forward path for ASPs is also reviewed with interview inputs, since pricing is affected by sensor commoditization, calibration needs, and the mix shift between basic devices and networked systems.
Data Validation & Update Cycle
Validation is done through multiple passes where model outputs are compared against independent signals, and then reviewed for break-points that do not match known market behavior. We check year-over-year growth against policy and funding events, confirm that regional shares align with visible deployment activity, and re-test assumptions when an outlier appears.
Before sign-off, another analyst reviews the build, inputs, and calculation flow so the logic is easy to follow and repeat. The report is refreshed annually, and interim updates are triggered when material events occur, such as large public programs, major standard changes, or sharp FX moves that can alter USD totals. Right before delivery, a fresh pass is completed so clients receive the most current view.
Mordor Intelligence's Air Quality Monitoring Market Sizing Compared With Other Published Estimates
Published market sizes for air quality monitoring do not always match because the boundary is not treated the same way by every publisher, and because the math behind pricing and refresh cycles is not always explained. Differences also come from the year used for currency conversion, the treatment of services versus equipment, and whether indoor devices are counted alongside regulatory ambient systems.
When ASPs are rolled forward using a single inflation uplift, or when exchange rates are applied from a different month than the stated base year, the final USD value can swing even if unit demand is similar. In that case, the model is rechecked with procurement and replacement signals right before release in Mordor Intelligence.
Benchmark comparison
| Source | Market Size | Gaps in Research Methodology |
|---|---|---|
| Mordor Intelligence | USD 6.15 B (2026) | |
| Global Consultancy A | USD 4.71 B (2024) | Often narrower device-only framing for monitoring systems, with limited inclusion of networked platforms and fewer adjustments for station upgrades and periodic analyzer replacements. |
| Industry Publisher B | USD 4.72 B (2024) | Commonly uses a fixed base-year value with a broad CAGR and lighter checks on ASP bands by end user, which can understate regions with higher compliance-driven specifications. |
Overall, the spread in published values mostly tracks three items: scope boundaries, the timing of currency conversion, and how replacement demand is treated versus new deployments. By keeping assumptions tied to observable deployment and procurement patterns, the estimate stays easier to trace back to real buying behavior and to re-run when conditions change.
Key Questions Answered in the Report
What is the current value of the air quality monitoring market?
The air quality monitoring market stands at USD 6.15 billion in 2026.
How fast will the air quality monitoring market grow by 2031?
It is projected to grow at a 7.35% CAGR to reach USD 8.77 billion by 2031.
Which region leads the air quality monitoring market?
Asia-Pacific commands 37.50% of 2025 revenues due to expansive smart-city programs and industrial demand.
What segment (Deployment mode) is expanding the quickest?
Drone-mounted and other mobile platforms show the highest 9.15% CAGR thanks to wildfire, oil-and-gas and remote-area monitoring needs.
Why are software platforms gaining share?
AI-based calibration and analytics turn raw sensor streams into compliance-ready insights, driving a 9.55% CAGR for software and cloud services.
How strict are new PM2.5 regulations?
The US EPA lowered the annual PM2.5 standard to 9 µg/m³ in 2024, requiring daily AQI updates for all metros above 350,000 residents.