
Market Overview
| Study Period | 2021 - 2031 |
|---|---|
| Market Size (2026) | USD 20.04 Billion |
| Market Size (2031) | USD 29.05 Billion |
| Growth Rate (2026 - 2031) | 7.71 % |
| Fastest Growing Market | Asia Pacific |
| Largest Market | Asia Pacific |
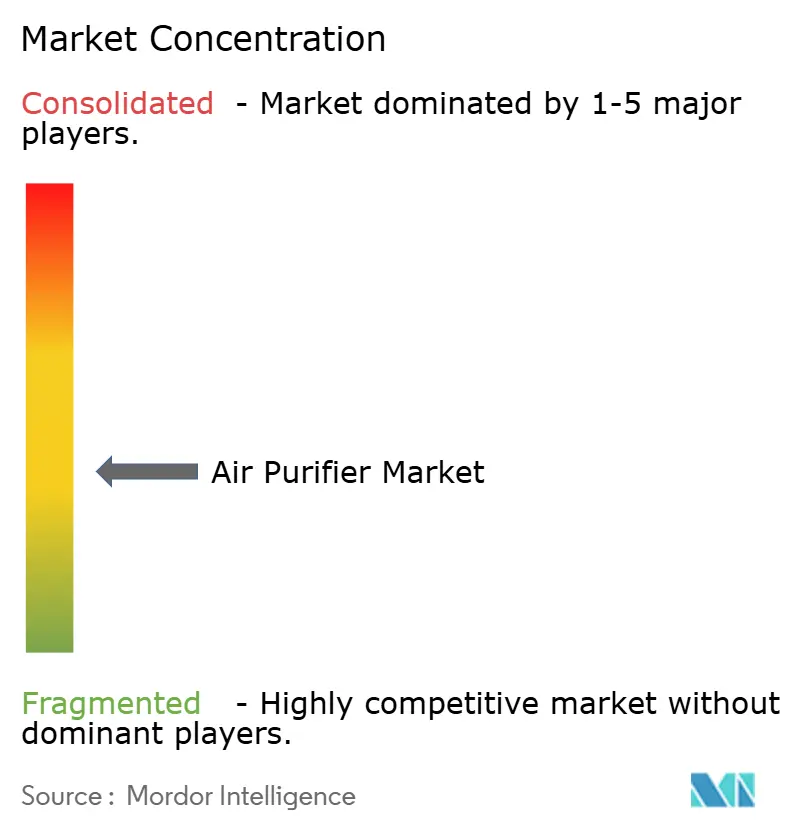
| Market Concentration | Medium |
Major Players *Disclaimer: Major Players sorted in no particular order Image © Mordor Intelligence. Reuse requires attribution under CC BY 4.0. | |
Air Purifier Market Analysis by Mordor Intelligence
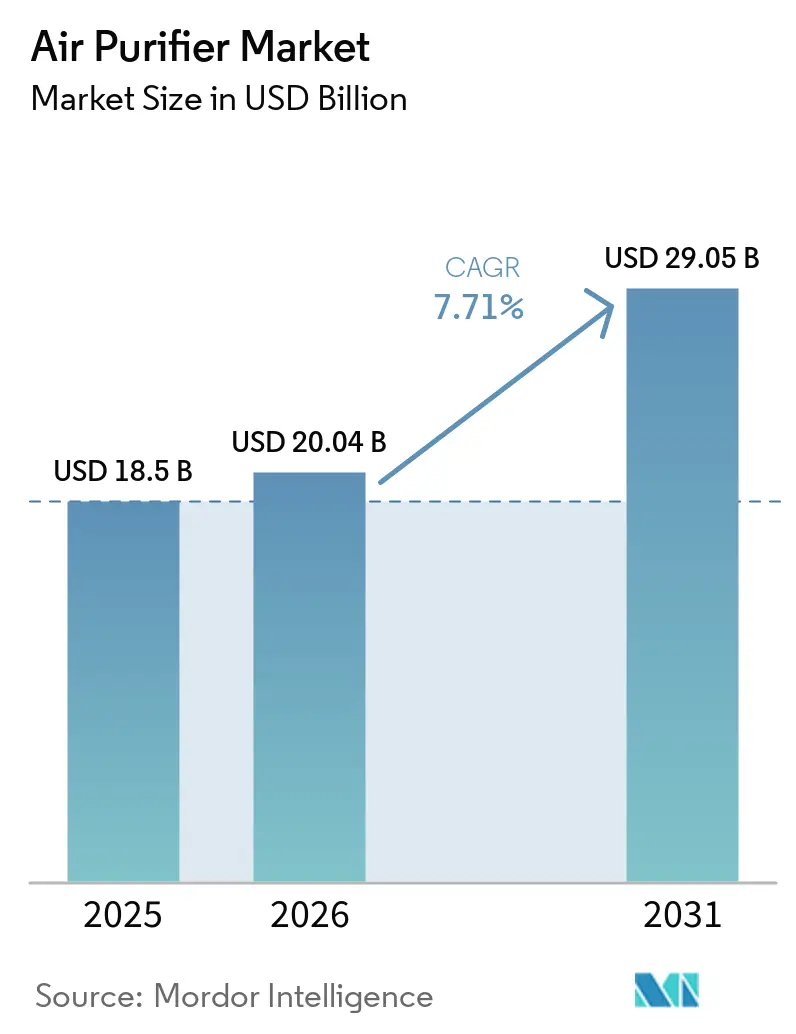
The Air Purifier Market is expected to grow from USD 18.5 billion in 2025 to USD 20.04 billion in 2026 and is forecasted to reach USD 29.05 billion by 2031 at 7.71% CAGR over 2026-2031.
This expansion reflects a structural shift from pandemic-era panic buying toward policy-driven indoor-air-quality mandates that are embedding purification into commercial real-estate retrofits, semiconductor cleanrooms, and connected-home ecosystems. LEED v4.1 requirements for MERV 13 or higher filtration, along with real-time PM2.5 monitoring, are accelerating upgrades in North America. At the same time, the CHIPS and Science Act is channeling USD 52.7 billion into U.S. fab construction, each facility demanding ISO Class 4-6 environments supported by HEPA and ULPA systems.[1]National Institute of Standards and Technology, “CHIPS Act Funding Overview,” nist.gov Asia-Pacific continues to anchor demand as chronic urban pollution, national clean-air programs, and electronics manufacturing hubs sustain high household and institutional adoption, while smart-home connectivity and ESG reporting requirements create premium niches in Europe and the Gulf.
Key Report Takeaways
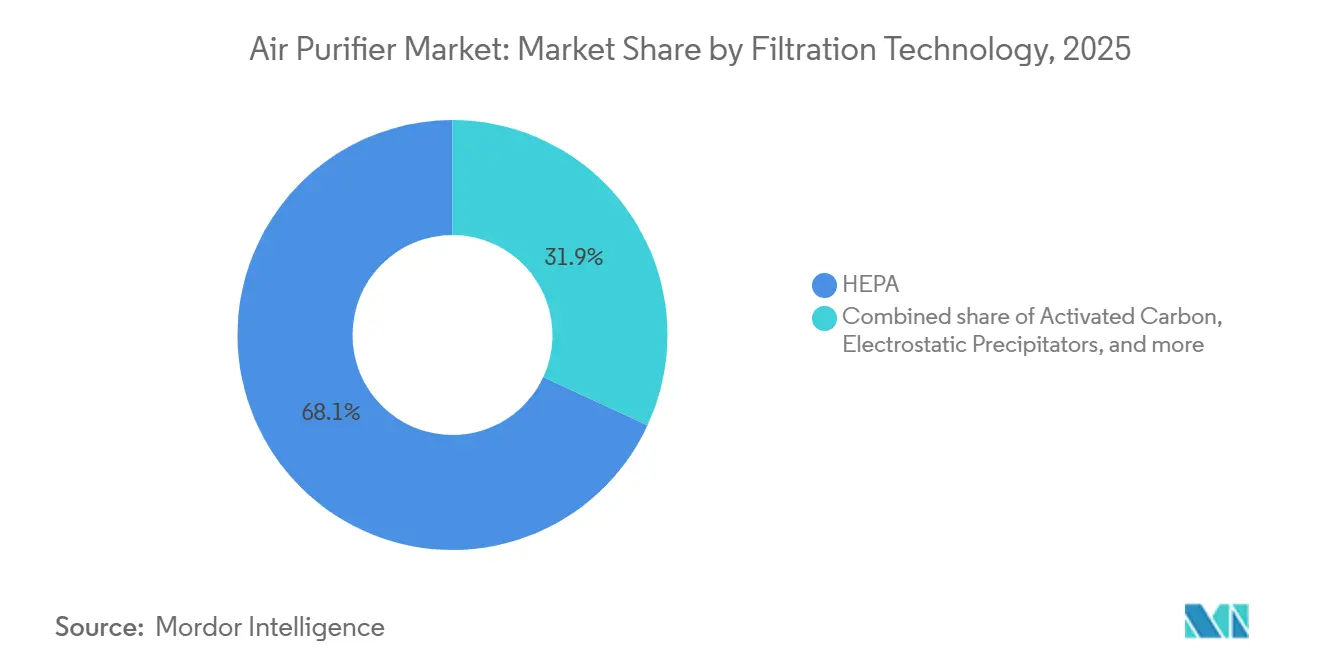
- By filtration technology, HEPA systems led with 68.1% of air purifier market share in 2025; hybrid multi-stage units are forecast to expand at a 9.3% CAGR through 2031.
- By type, stand-alone portable units captured 79.5% of the air purifier market in 2025, whereas in-duct central HVAC solutions are growing at an 8.8% CAGR to 2031.
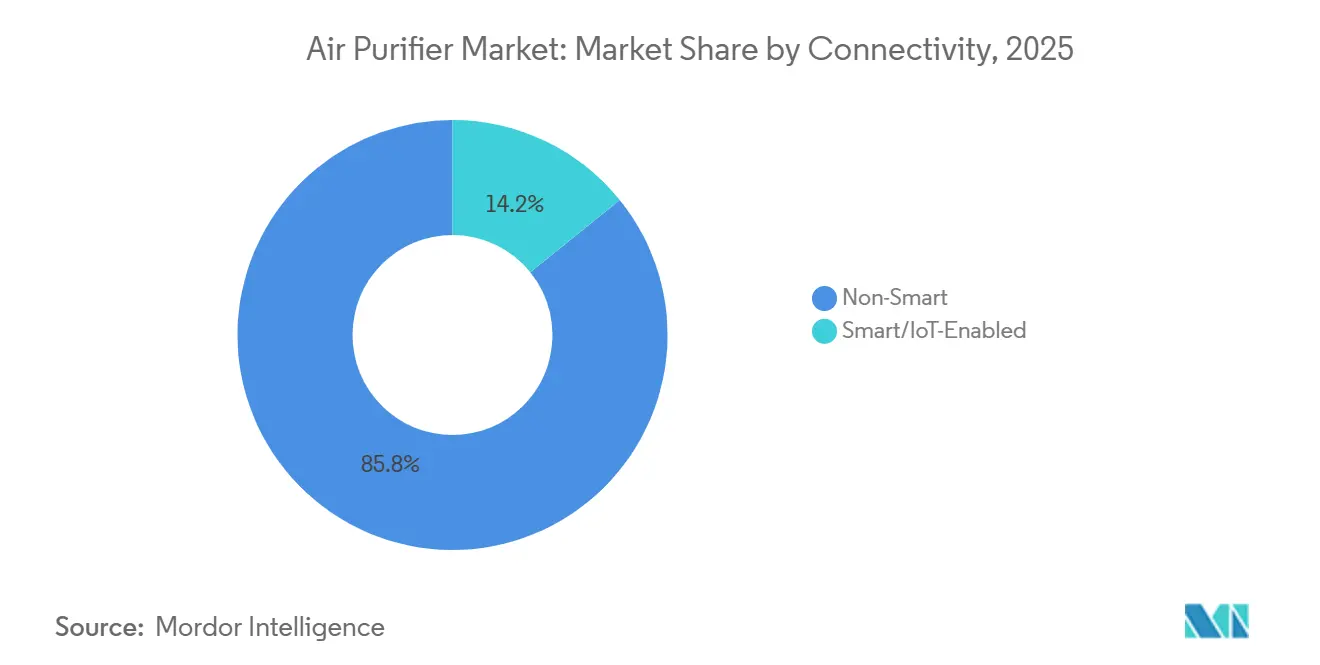
- By connectivity, non-smart analog models dominated with 85.8% volume share in 2025, while IoT-enabled purifiers are rising at an 11.2% CAGR.
- By end user, residential buyers accounted for 61.7% of the air purifier market size in 2025; commercial deployments are advancing at a 9.7% CAGR on ESG and healthy-building mandates.
- By geography, Asia-Pacific held 42.9% revenue share of the air purifier market in 2025, and is also the fastest regulatory-driven growth at 8.5% CAGR to 2031.
Note: Market size and forecast figures in this report are generated using Mordor Intelligence’s proprietary estimation framework, updated with the latest available data and insights as of January 2026.
Market Trends and Insights
Drivers Impact Analysis of Air Purifier Market*
| Driver | (~) % Impact on CAGR Forecast | Geographic Relevance | Impact Timeline |
|---|---|---|---|
| Post-COVID Health-Centric Device Adoption in East Asian Metros | +1.2% | China, Japan, South Korea, Taiwan | Medium term (2-4 years) |
| Stricter PM2.5 Commercial Real-Estate Standards in North America (LEED v4.1) | +1.5% | United States, Canada | Long term (≥ 4 years) |
| Semiconductor Clean-room Capacity Build-out in the US & South Korea | +0.9% | United States, South Korea, Taiwan | Long term (≥ 4 years) |
| Smart-Home Integration Pull for Connected Purifiers in EU & US | +1.3% | European Union, United States | Medium term (2-4 years) |
| ESG-Driven Hospitality Upgrades across GCC Countries | +0.7% | UAE, Saudi Arabia, Qatar | Short term (≤ 2 years) |
| Indian NCAP Subsidies for HEPA Purifiers in Public Schools | +0.4% | India (102 non-attainment cities) | Medium term (2-4 years) |
| Source: Mordor Intelligence | |||
Post-COVID Health-Centric Device Adoption in East Asian Metros
Persistent PM2.5 readings above national targets in Beijing, Seoul, and Tokyo have normalized year-round purifier ownership, extending the air purifier market beyond the pandemic spike. China’s Ministry of Ecology and Environment confirmed that 38 of 168 monitored cities missed PM2.5 goals in 2024.[2]Ministry of Ecology and Environment, “China Air Quality Report 2024,” mee.gov.cn Japan’s health ministry updated indoor-air guidelines in 2024 to recommend HEPA filtration in childcare and eldercare facilities, institutionalizing a replacement cycle.[3]Ministry of Health, Labour and Welfare, “Indoor Air Quality Guidelines 2024,” mhlw.go.jp Semiconductor engineers in South Korea, exposed to ultra-clean fabs, increasingly mirror workplace standards at home, creating a premium residential cohort. Xiaomi’s RMB 2.5 billion smart-appliance factory opened in Wuhan in 2025, adding 7 million units of annual capacity that can flex between domestic and export orders. This combination of regulatory push and consumer pull solidifies a stable East-Asian demand base.
Stricter PM2.5 Commercial Real-Estate Standards in North America (LEED v4.1)
LEED v4.1’s Indoor Environmental Quality credit mandates MERV 13 or higher filtration and continuous PM2.5 monitoring, compelling U.S. and Canadian building owners to retrofit or specify advanced purification from the design stage. Compliance budgets ranging from USD 50,000 to USD 150,000 for a 100,000-square-foot office are increasingly justified as tenants demand healthy-building certification for talent attraction and ESG reporting. ASHRAE 62.1-2022 further tightens outdoor-air ventilation rates, encouraging hybrid solutions that pair in-duct HEPA modules with portable units in meeting spaces. The Canada Green Building Council noted that 68% of new commercial projects sought LEED certification in 2025, signaling mainstream adoption. These standards are likely to cascade into Europe as revisions to the Energy Performance of Buildings Directive embed indoor-air metrics by 2027.
Semiconductor Cleanroom Capacity Build-out in the US & South Korea
The CHIPS and Science Act directs USD 52.7 billion toward domestic semiconductor manufacturing, with Intel, TSMC, and Samsung allocating more than USD 200 billion to fab construction through 2030. Every ISO Class 4-6 cleanroom cycles air 300-400 times per hour, translating into thousands of HEPA or ULPA modules per site. South Korea mirrors this intensity as SK Hynix and Samsung expand fabs that will add 1.5 million m² of cleanroom space by 2028, each square meter requiring 15-20 HEPA filter modules. Daikin’s USD 163 million R&D lab announced in 2025 targets these industrial niches with next-generation filtration platforms. The technology spillover influences home-purchase decisions among engineers who internalize cleanroom standards, fueling premium residential sales.
Smart-Home Integration Pull for Connected Purifiers in EU & US
Matter protocol adoption by Apple, Google, Samsung, and Amazon is dissolving brand silos and making smart purifiers a seamless node in the connected-home stack. Voice-assistant triggers, real-time dashboards, and predictive filter alerts command a USD 100-USD 200 premium over analog units but resonate with digitally native households. Dyson’s Big+Quiet couples PM2.5 and VOC sensors with automatic speed modulation, achieving up to 30% energy savings compared with fixed-speed models. The European Union’s energy-labeling regulation now requires air cleaners to disclose energy use per cubic meter, further incentivizing sensor-driven optimization. Utility rebates of USD 50-USD 100 for ENERGY STAR-certified smart purifiers in California and New York accelerate payback periods.
Restraints Impact Analysis of Air Purifier Market*
| Restraint | (~) % Impact on CAGR Forecast | Geographic Relevance | Impact Timeline |
|---|---|---|---|
| Ozone-Emission Restrictions on Ionizers in California & Japan | -0.8% | California, Japan, South Korea | Short term (≤ 2 years) |
| High Filter Replacement Cost Sensitivity in ASEAN Mass Market | -1.1% | Indonesia, Philippines, Vietnam, Thailand | Medium term (2-4 years) |
| Consumer Skepticism on CADR Claims - Lack of Unified Test Protocol | -0.6% | Global, with acute impact in North America & EU | Medium term (2-4 years) |
| HVAC In-duct Filtration Diluting Stand-alone Unit Demand in Large Offices | -0.5% | North America, Western Europe | Long term (≥ 4 years) |
| Source: Mordor Intelligence | |||
Ozone-Emission Restrictions on Ionizers in California & Japan
California’s Air Resources Board capped ozone output from indoor cleaners at 0.050 ppm in 2024, effectively sidelining ionizer-centric designs.[4]California Air Resources Board, “Indoor Air Cleaner Regulation,” arb.ca.gov Japan’s health ministry imposed parallel labeling rules in 2025 that limit ionizer sales in childcare facilities. Brands dependent on ionization, including Sharp and Panasonic, face USD 15-USD 25 per-unit redesign costs to meet thresholds, crimping margins in entry segments. The rule change funnels demand toward HEPA-pure or hybrid devices, benefiting competitors without ion emitters.
High Filter Replacement Cost Sensitivity in ASEAN Mass Market
HEPA and carbon filters are often priced at 40%-60% of the original unit cost in ASEAN, making ownership expensive relative to per-capita income. With local filter manufacturing still nascent, import duties add up to 30% to landed costs in Vietnam and Thailand. Xiaomi’s washable pre-filters extend service intervals but reduce CADR 15%-20%, reinforcing consumer skepticism over performance claims. Until regional supply chains mature or subscription models proliferate, mass-market penetration remains constrained.
*Our forecasts treat driver/restraint impacts as directional, not additive. The impact forecasts reflect baseline growth, mix effects, and variable interactions.
Air Purifier Market Segment Analysis
By Filtration Technology:
Hybrid Systems Gain as Contaminant Diversity WidensHEPA media captured 68.1% of the air purifier market share in 2025, favored for its 99.97% efficiency at 0.3 µm and endorsements from the U.S. EPA and WHO. Hybrid configurations that pair HEPA with activated carbon, UV-C, or photocatalytic oxidation are slated for a 9.3% CAGR because households and businesses now target VOCs, pathogens, and odors in a single chassis. Daikin’s Streamer plasma module showed 99.9% SARS-CoV-2 inactivation in 2024 lab tests. Panasonic’s nanoe X hydroxyl-radical generator is popular in Japan’s eldercare market, where pathogen control ranks with particulate capture. Ionic precipitators retreat to niche industrial uses as ozone-cap rules in California and Japan tighten. Lack of harmonized efficacy standards for hybrid units, however, tempers adoption in risk-averse hospitals and pharmaceutical plants.
Hybrid systems also dovetail with smart-sensor arrays that trigger stage-specific filtration to curb energy draw and extend filter life. LG’s Clean Booster vortex airflow increases CADR 47% over conventional centrifugal fans, enabling similar room coverage with smaller form factors. UV-C and photocatalytic modules remain premium add-ons costing USD 80-USD 120 per unit, limiting penetration below the USD 500 price tier. Prospective regulation around UV-C exposure could further shape the competitive field, but no global consensus exists yet.


By Type:
In-Duct Systems Capitalize on Whole-Building IAQ MandatesStand-alone devices, including portable air purifiers, accounted for 79.5% of the air purifier market volume in 2025 as renters and homeowners favored plug-and-play solutions priced between USD 150 and USD 800. Nevertheless, in-duct installations are scaling at an 8.8% CAGR through 2031, especially within commercial campuses that prefer centralized maintenance. A single in-duct HEPA retrofit costing USD 20,000-USD 40,000 can meet LEED air-change requirements for a 50,000-square-foot office, whereas equivalent coverage with portables would need 50 units and recurring labor for filter swaps. Samsung’s 2025 acquisition of FläktGroup extends its HVAC reach into purification modules that target hospitals and airports. Data-center operators adopt in-duct systems to keep airborne particulates below 10 µg/m³, protecting high-density servers from overheating or shorts. Portable units remain dominant in hospitality and multifamily housing, where room-specific control and aesthetics outweigh operational consolidations.
Regional HVAC penetration shapes these trends: North America and Europe, with about 85% central-HVAC adoption in commercial buildings, naturally migrate to in-duct solutions. By contrast, Asia-Pacific’s heterogeneous building stock sustains portable demand, although new Grade-A offices in Beijing, Seoul, and Singapore are increasingly designed with built-in filtration plenum space. Suppliers that can package both portable and in-duct offerings stand to address the full project life cycle, from break-fix replacements to green-field architectural specs.
By Connectivity:
IoT Purifiers Command Premium but Face Interoperability HurdlesSmart models represented only 14.2% of shipments in 2025 but are on an 11.2% CAGR trajectory as they integrate into broader home-automation platforms. Real-time particulate dashboards, filter-life analytics, and voice-assistant triggers justify a USD 100-USD 200 uplift, with early adopters concentrated in North America and Western Europe. Xiaomi’s Mi Air Purifier 4 Pro, priced at RMB 1,499, secured 18% of China’s smart segment by bundling Wi-Fi and Matter compatibility without premium price drift. The European energy label now requires disclosure of kWh per cubic meter, pushing manufacturers to embed occupancy and pollutant sensors that modulate fan speed, cutting electricity use by up to 30%.
Interoperability, however, remains a pinch point. A 2025 Consumer Technology Association study showed 38% of owners reported set-up or stability issues, dampening repeat intent. Analog devices persist in ASEAN and Latin America, where smartphone penetration lags, and consumers prioritize upfront cost over feature depth. The air purifier market will likely bifurcate: premium brands extend IoT ecosystems, while budget players refine cost-efficient analog units.
By End User:
Commercial Segments Outpace Residential on ESG and Regulatory TailwindsResidential buyers held 61.7% of the air purifier market size in 2025, yet commercial demand across hospitality, healthcare, education, and corporate offices is rising at a 9.7% CAGR. Marriott aims to retrofit 80% of its Middle-East properties by 2027 to meet LEED and Dubai tourism requirements. U.S. hospitals follow CDC guidance mandating 12 air changes per hour in isolation rooms, driving HEPA upgrades. Indian public schools tap NCAP subsidies, though filter-replacement funding gaps threaten long-term efficacy. Industrial niches, semiconductor fabs, food-processing plants, and data centers offer smaller volumes but high average selling prices owing to mission-critical uptime. Daikin’s new R&D center will develop purifier-HVAC bundles tailored for AI data centers, where particulate contamination can cause costly downtime.
Seasonal volatility affects residential sales during wildfire seasons in California and Australia and during severe pollution episodes in Delhi and Beijing. Conversely, commercial contracts are longer term, often three- to five-year service agreements that bundle consumables and remote monitoring, smoothing revenue streams for vendors.
Geography Analysis
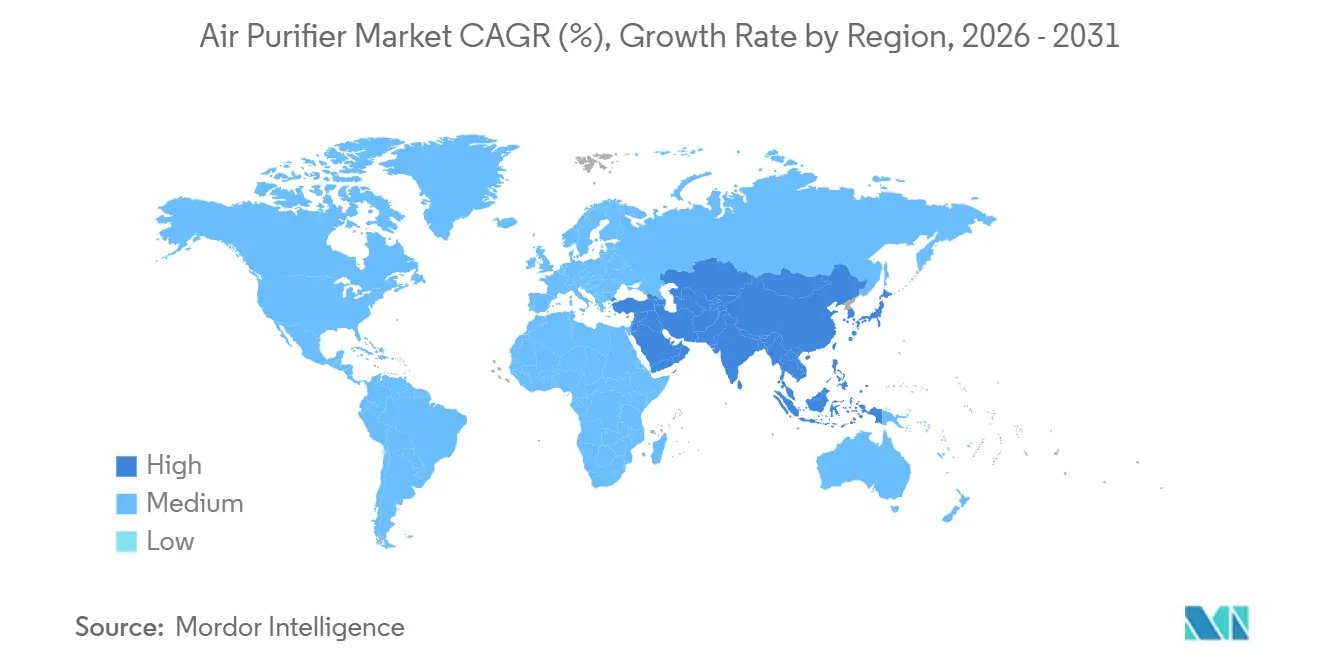
APAC Air Purifier Market
Asia-Pacific generated 42.9% of 2025 revenue for the air purifier market and will climb at an 8.5% CAGR through 2031 on sustained urban PM2.5 levels, aggressive semiconductor investments, and government clean-air programs. China’s environment ministry reported 38 non-attainment cities in 2024, underpinning stable household demand. Xiaomi’s Wuhan factory adds 7 million units of annual output, reinforcing local cost advantages. Japan’s updated childcare IAQ guidelines promote HEPA installations, creating steady replacement cycles.
North America Air Purifier Market
North America, though smaller in unit volume, exhibits the fastest policy-driven acceleration as LEED v4.1, ASHRAE 62.1, and CHIPS Act funds converge. Semiconductor fabs under construction across Arizona, Texas, and Ohio mandate HEPA/ULPA infrastructure, pulling through significant B2B orders. Canada’s 68% LEED adoption rate for new builds underscores continental alignment with IAQ standards.
Europe, Middle East and South America Air Purifier Market
Europe’s forthcoming Energy Performance of Buildings Directive revision will formalize indoor-air metrics by 2027, driving uptake in Germany, France, and the Nordics. The Middle East leverages hospitality retrofits under Saudi and Emirati climate pledges, producing double-digit growth, albeit from a small base. South America trails as economic volatility and limited regulatory frameworks hamper widespread adoption, although pollution in São Paulo and Buenos Aires nudges incremental residential sales.

Regulatory Landscape
Energy and product-claims compliance is tightening around measurable clean-air performance and ozone safety. In North America, ENERGY STAR Room Air Cleaners Version 3.0 moved programs toward PM2.5 Clean Air Delivery Rate (CADR) and Integrated Energy Factor (IEF) metrics (effective October 2025). The US DOE also set Tier 2 energy conservation standards with a December 2025 compliance date for conventional room air cleaners, and it published a May 2025 proposal to withdraw the determination that portable air cleaners are covered products under EPCA, creating design and labeling uncertainty for some SKUs depending on final scope. California Air Resources Board (CARB) certification continues to constrain ionizer-centric designs through ozone-emission limits, shaping product architecture and go-to-market choices.
Canada is moving toward harmonized requirements with the United States. In June 2026, the Government of Canada published a proposed Amendment 19 to the Energy Efficiency Regulations, 2016, to adopt US DOE test and efficiency approaches and introduce EnerGuide labeling requirements for air cleaners. While this can reduce technical barriers for cross-border product lines, it also increases compliance workload for suppliers that are not already aligned to DOE methods. Separately, claim substantiation is drawing more enforcement attention: under US EPA oversight, devices making antimicrobial or air-purification claims can fall under FIFRA pesticide-device provisions, pushing brands toward tighter language, test-backed marketing, and third-party verification practices.
Competitive Landscape
The top five vendors, Daikin, Sharp, Dyson, Philips, and LG, control roughly 35%-40% of global shipments, placing the air purifier market in a moderately fragmented state. Technology differentiation and cost leadership form dual competitive axes. Incumbents bank on proprietary modules (Sharp’s Plasmacluster ionizer, Panasonic’s nanoe X, and Daikin’s Streamer plasma) to justify price premiums, while challengers like Xiaomi deploy vertically integrated factories to offer IoT-equipped units at 40%-50% lower prices.
Samsung’s EUR 1.5 billion purchase of FläktGroup in 2025 marks a pivot toward integrated HVAC-purification platforms aimed at hospitals, airports, and corporate campuses. Daikin’s USD 163 million R&D laboratory will focus on data-center and cleanroom applications, eyeing high-margin industrial niches. Smaller disruptors such as Airdog and Medify Air introduce washable filters and subscription consumables, courting cost-sensitive ASEAN consumers.
Innovation intensity is evident: Dyson filed 127 purification patents in 2024-2025 covering formaldehyde sensing and catalytic destruction. LG’s vortex airflow increased CADR 47%, highlighting aerodynamic advances. Regulatory pressure around ozone emissions forces ionizer-heavy portfolios to redesign, temporarily advantaging HEPA-focused rivals. Lack of unified CADR protocols remains a strategic risk, opening the door for standards-compliant brands to differentiate through certified performance data.
Air Purifier Industry Leaders
Daikin Industries Ltd
Dyson Ltd
Sharp Corporation
Koninklijke Philips N.V.
LG Electronics Inc.
- *Disclaimer: Major Players sorted in no particular order
Air Purifier Market Companies Covered in this Report
- Daikin Industries Ltd
- Sharp Corporation
- Dyson Ltd
- Koninklijke Philips N.V.
- LG Electronics Inc.
- Panasonic Corporation
- Whirlpool Corporation
- Resideo Technologies Inc.
- Samsung Electronics Co. Ltd
- Xiaomi Corp.
- Honeywell International Inc.
- IQAir AG
- Coway Co. Ltd
- Winix Inc.
- Blueair AB
- AllerAir Industries Inc.
- Airdog (IAQ Tech)
- Austin Air Systems Ltd
- Kent RO Systems Ltd
- TruSens (ACCO Brands)
- Medify Air LLC

Market Opportunities and Future Outlook
A key opportunity lies in the overlap between measurable building IAQ requirements, energy disclosure, and third-party test methods that address buyer skepticism about performance claims. Standards used by building operators and specifiers, including ASHRAE Standard 241 (control of infectious aerosols), together with test methods such as ANSI/ASHRAE Standard 185.3-2024 for in-room commercial and industrial air-cleaning devices, shift procurement toward clean-airflow metrics instead of broad marketing statements. This creates whitespace for manufacturers that can bundle certified performance (PM2.5 CADR, energy per delivered clean air, and ozone-safe designs) with monitoring and controls that plug into smart building management and connected-home ecosystems.
Materials and sustainability are also becoming differentiators, particularly where filter replacement cost and end-of-life waste constrain adoption in parts of the market. In 2026, multiple research disclosures pointed to biodegradable and lower-resistance filtration pathways, including biodegradable trans-scale fiber membranes for PM0.3 removal published in Nature Communications and electrospun nanofiber filter research in Fibers and Polymers. On the commercialization side, Blueair unveiled its Wool EcoLast filter in July 2026, signaling active development around more sustainable filter materials. This direction aligns with tighter efficiency and labeling regimes (ENERGY STAR/DOE and proposed Canadian EnerGuide labeling) and with ongoing regulatory pressure that is already shifting portfolios away from ozone-emitting ionization approaches.
Recent Industry Developments in Air Purifier Market
- April 2026: LG Electronics announced the LG PuriCare 2026 New Series in Hong Kong, adding multi-functional formats such as the AeroSpeaker Air Purifying Table alongside compact models. The broader lineup expands purifier use cases beyond standalone boxes and supports premium positioning through design-led, space-efficient products.
- October 2025: ENERGY STAR Version 3.0 for Room Air Cleaners took effect, shifting performance emphasis toward PM2.5 CADR and Integrated Energy Factor metrics. The update raises the bar for test-backed efficiency and clean-air performance disclosures, influencing product design priorities and retail merchandising.
- September 2024: Wind Point Partners completed its acquisition of Clean Solutions Group, highlighting private-equity interest in indoor environmental and cleaning-related platforms. The consolidation can broaden distribution reach and expand service capabilities for air-treatment offerings that sell into commercial and institutional accounts.


Air Purifier Market Report Scope and Research Methodology
Market Definition and Coverage
This market covers revenue earned from selling new, electrically powered air purifier units that clean indoor air by removing particles, gases, and biological contaminants using mechanical, electrostatic, or similar purification methods, across residential, commercial, and light-industrial use.
Scope exclusions: We exclude replacement filters and consumables sold separately, automotive cabin purifiers, and passive gadgets that do not function as powered air-cleaning units.
Segments Covered in This Report
- By Filtration Technology
- HEPA
- Activated Carbon
- Ionic/Electrostatic Precipitators
- UV-Cand Photocatalytic Oxidation
- Hybrid and Multi-stage Systems
- By Type
- Stand-alone/Portable
- In-duct/Central HVAC
- By Connectivity
- Non-Smart (Manual/Analog)
- Smart/IoT-Enabled (App and Voice Controlled)
- By End User
- Residential
- Commercial (Hospitality and Leisure, Healthcare Facilities and Clinics, Educational Institutions and Corporate Offices and Retail)
- Industrial (Manufacturing and Warehousing, Food and Beverage Processing, Pharmaceuticals and Clean-rooms and Data Centers and Server Rooms)
- By Geography
- North America
- United States
- Canada
- Mexico
- Europe
- United Kingdom
- Germany
- France
- Spain
- Nordic Countries
- Russia
- Rest of Europe
- Asia-Pacific
- China
- India
- Japan
- South Korea
- ASEAN Countries
- Australia
- Rest of Asia-Pacific
- South America
- Brazil
- Argentina
- Colombia
- Rest of South America
- Middle East and Africa
- United Arab Emirates
- Saudi Arabia
- South Africa
- Egypt
- Rest of Middle East and Africa
- North America
Data Sources, Market Sizing, and Validation
Desk Research
Desk research was used to set the demand context and to anchor the model with public signals that are refreshed regularly. We referenced sources such as the US Environmental Protection Agency for indoor air guidance, the World Health Organization for ambient air quality linkages, and the World Bank for urbanization and income indicators that influence adoption. Where available, we also relied on national statistics offices for country-level baselines, customs and trade statistics for air treatment equipment flows, and peer-reviewed studies on indoor PM exposure and allergy or asthma prevalence.
On the supply and pricing side, we reviewed company annual reports, investor presentations, and product specification sheets to understand feature mix and typical price points across room sizes. Select paid subscriptions were used only to speed up company financial screening, patent lookups on filtration technologies, and shipment-level import-export checks where trade data was needed for triangulation. These examples are not exhaustive, and other public sources were also consulted for data collection, validation, and research clarification.
Primary Interviews and Surveys
Primary work focused on validating what portion of households and commercial sites are actively purchasing units, and how that mix changes by climate, pollution episodes, and allergy seasonality. We spoke with a spread of manufacturers, channel partners, and procurement or facility stakeholders across major regions, then used the feedback to tighten assumptions on pricing levels, replacement cycles for devices, and the share of portable versus in-duct installations.
Distribution of primary research fieldwork respondents
| Company type | Respondent position | Region |
|---|---|---|
| Top tier: 32% | CXOs: 18% | APAC: 42% |
| Mid tier: 49% | Functional/Unit leaders: 39% | EMEA: 37% |
| Smaller Players: 19% | Managers: 43% | Americas: 21% |
Market-Sizing & Forecasting
Sizing starts with a top-down demand pool build where population, household formation, urban housing stock, and commercial floor-space indicators are translated into a realistic base of locations that can use air purifiers. That potential base is then filtered by adoption rates adjusted by indoor air quality awareness, particulate pollution patterns, allergy and respiratory health signals, and the observed shift toward higher CADR units for larger rooms.
To keep totals practical, results were checked with selective bottom-up approximations, including sampled average selling prices by capacity band, retail and online channel checks, and supplier and distributor feedback on shipment trends. When a country has limited direct indicators, nearby proxy markets with similar income levels and pollution profiles were used first, and the final values were then corrected through interview-led reality checks. For forecasting, we relied mainly on scenario analysis guided by expert views on regulation, seasonality-driven demand spikes, and expected price compression from feature standardization, and then converted those scenarios into yearly trajectories.
Data Validation & Update Cycle
Validation is done through multiple passes where model outputs are compared against independent signals, such as import trends for air cleaning equipment, retail category momentum, and country-level macro indicators that influence discretionary appliance buying. Outliers are flagged, and assumptions are revisited, after which follow-up calls are triggered when pricing or adoption feedback is inconsistent across respondent groups. Before sign-off, another analyst reviews the logic, the math, and the year-to-year movements so any variance is explained in plain terms.
The report is refreshed annually, and interim updates are completed when there are material events like new indoor air rules, major product shifts, or sustained changes in raw material and logistics costs that affect end prices. Right before delivery, we do a final update pass to ensure the latest public releases and interview inputs are reflected.
Mordor Intelligence's Air Purifier Market Size Compared Against Other Published Estimates
Published market sizes for air purifiers can look close at first glance, but they still spread because each publisher makes different choices on what to count, which year to anchor on, and how to treat price and mix changes across countries. The differences become more visible when portable units, in-duct systems, and adjacent air treatment products are handled inconsistently.
The main gap comes from whether replacement filters, add-on service revenues, and non-powered air cleaning products are included, and then how fast price declines are assumed for HEPA-led models as smart features become common. Some estimates also lean heavily on a single sales channel or a short period of elevated demand, which can inflate the starting year. For Mordor Intelligence, only new powered purifier units are counted at the final invoiced price to the first end-user, and consumables and passive devices are kept out so the demand pool stays tied to equipment purchases.
Benchmark comparison
| Source | Market Size | Gaps in Research Methodology |
|---|---|---|
| Mordor Intelligence | USD 18.5 B (2025) | |
| Global Consultancy A | USD 18.09 B (2025) | Uses a broader segmentation set where coverage range and sales channel assumptions can shift totals, and the approach may capture a wider set of air treatment revenues depending on category mapping across regions. |
| Industry Publisher B | USD 18.1 B (2025) | Presents a 2025 estimate with limited visible detail on exclusions and currency timing, so device-only revenue and add-on streams can be mixed, and price and feature mix progression may be applied more uniformly across countries. |
Overall, the spread is not driven by math errors as much as by scope and pricing choices that move the counted revenue base. By keeping the unit definition consistent across regions and by validating adoption and ASP logic with field inputs, our estimate stays traceable to clear demand drivers and repeatable checks.


Key Questions Answered in the Report
How large will the global air purifier market be by 2031?
It is forecast to reach USD 29.05 billion by 2031, advancing at a 7.71% CAGR from 2026 to 2031.
Which filtration technology leads current sales?
HEPA media leads with 68.1% of 2025 revenue, thanks to 99.97% particle capture efficiency.
Why are in-duct systems growing faster than portable units?
Commercial buildings opt for centralized HEPA retrofits to meet LEED v4.1 and ASHRAE 62.1 standards, delivering whole-building compliance with lower lifecycle cost.
Which region holds the largest revenue share?
Asia-Pacific commanded 42.9% of 2025 turnover on the back of chronic PM2.5 pollution and robust electronics manufacturing.
What regulatory trend most influences North American demand?
LEED v4.1’s requirement for MERV 13 or higher filtration and real-time PM2.5 monitoring is driving widespread retrofits in offices and public buildings.
Page last updated on:


 Your data is secure and never sold or shared.


