
Market Overview
| Study Period | 2019 - 2031 |
|---|---|
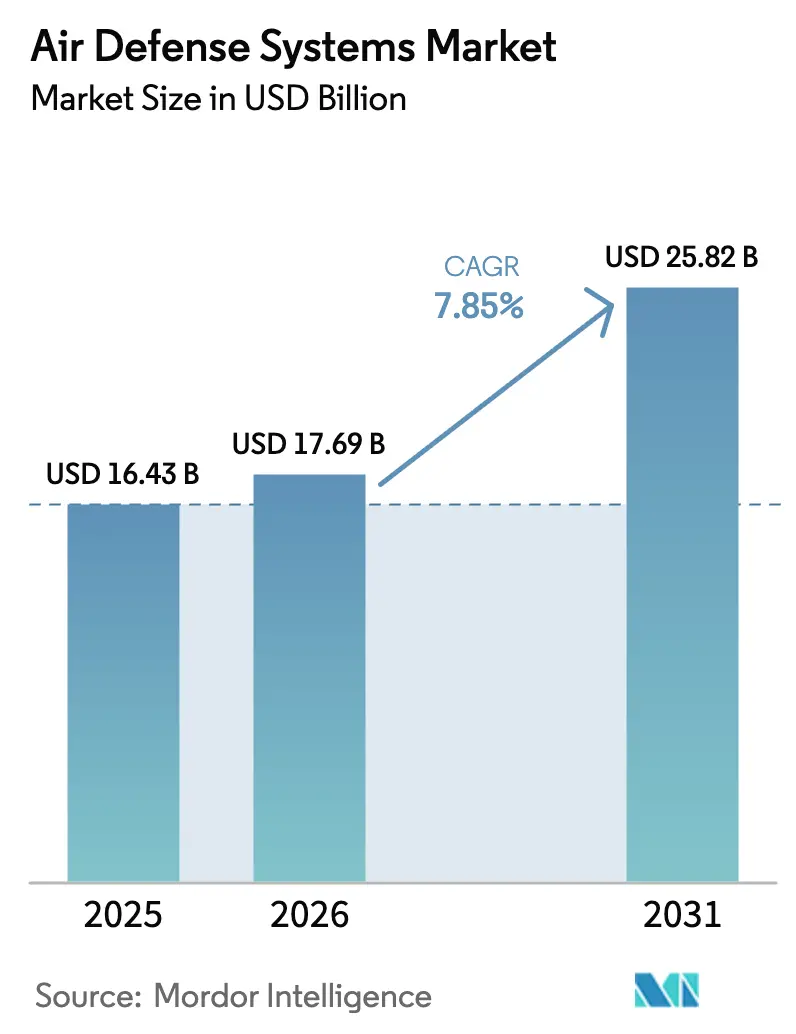
| Market Size (2026) | USD 17.69 Billion |
| Market Size (2031) | USD 25.82 Billion |
| Growth Rate (2026 - 2031) | 7.85 % |
| Fastest Growing Market | Asia Pacific |
| Largest Market | North America |
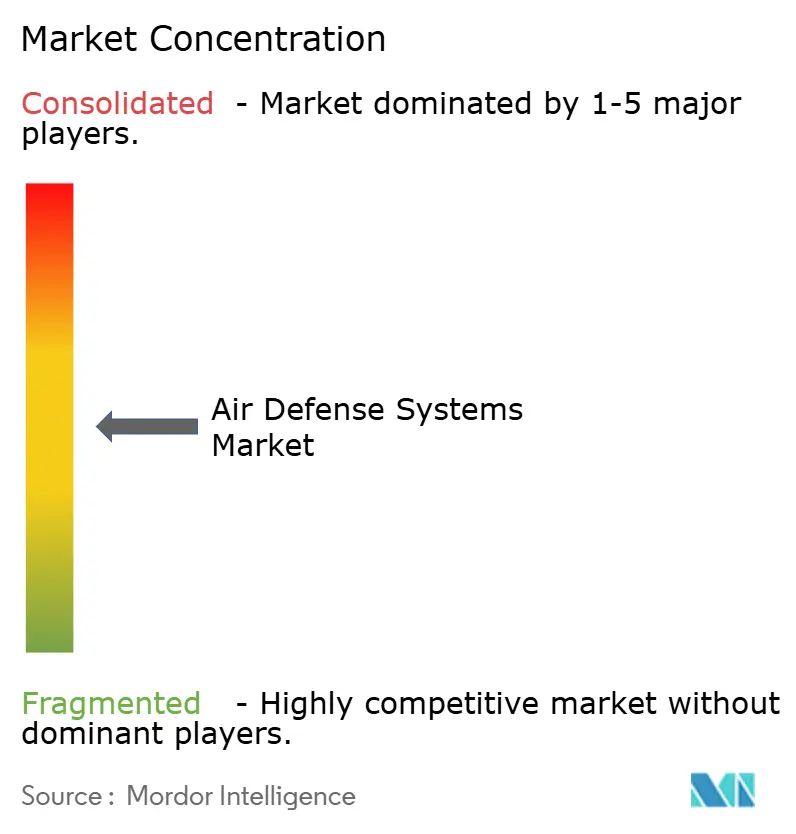
| Market Concentration | Medium |
Major Players *Disclaimer: Major Players sorted in no particular order Image © Mordor Intelligence. Reuse requires attribution under CC BY 4.0. | |
Air Defense Systems Market Analysis by Mordor Intelligence
The air defense systems market size is expected to grow from USD 16.43 billion in 2025 to USD 17.69 billion in 2026 and is forecasted to reach USD 25.82 billion by 2031 at a 7.85% CAGR over 2026-2031. Demand is escalating as hypersonic glide vehicles, stealth aircraft, and autonomous drone swarms overwhelm legacy radar networks, prompting governments to accelerate the purchase of network-centric architectures that link land, sea, air, and space sensors in near real-time. NATO states have moved decisively toward layered defense; Poland’s USD 4.75 billion Patriot package and Germany’s USD 3.5 billion Arrow 3 deal illustrate the shift from single-tier batteries to interoperable interceptors that cover short, medium, and exo-atmospheric ranges. Parallel efforts in space are equally pivotal: the Space Development Agency’s 28-satellite Tracking Layer Tranche 0, operational since late 2024, delivers hypersonic tracking coverage beyond the reach of ground radars. On the technology front, the fast-growing directed-energy segment offers sub-dollar shots that redress the unsustainable economics of firing missiles worth hundreds of thousands of dollars at hobby-grade drones. Meanwhile, supply constraints on gallium nitride (GaN) semiconductors and stringent export regimes, such as ITAR and MTCR, temper near-term volume growth.
Key Report Takeaways
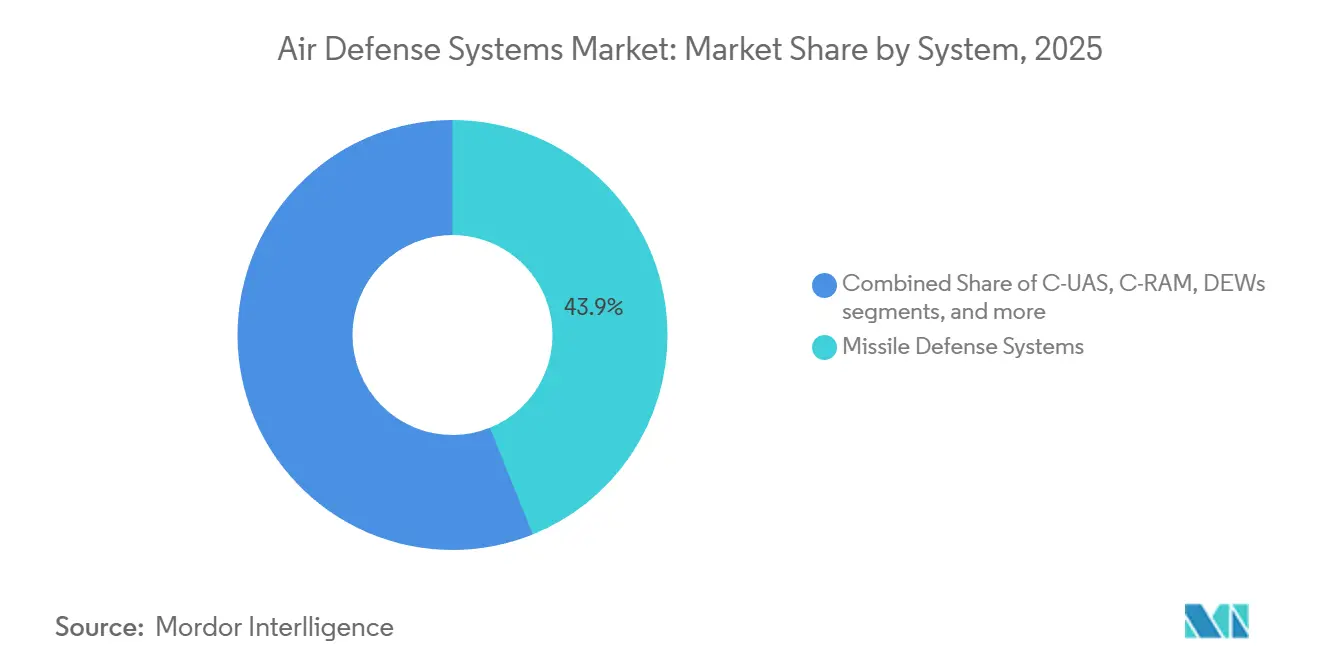
- By system type, missile defense systems held 43.91% of the air defense systems market share in 2025, while directed-energy weapons (DEWs) are projected to advance at an 11.08% CAGR through 2031.
- By platform, land-based solutions commanded 59.75% of the air defense systems market size in 2025; sea-based assets are projected to expand at a 9.0% CAGR between 2026 and 2031.
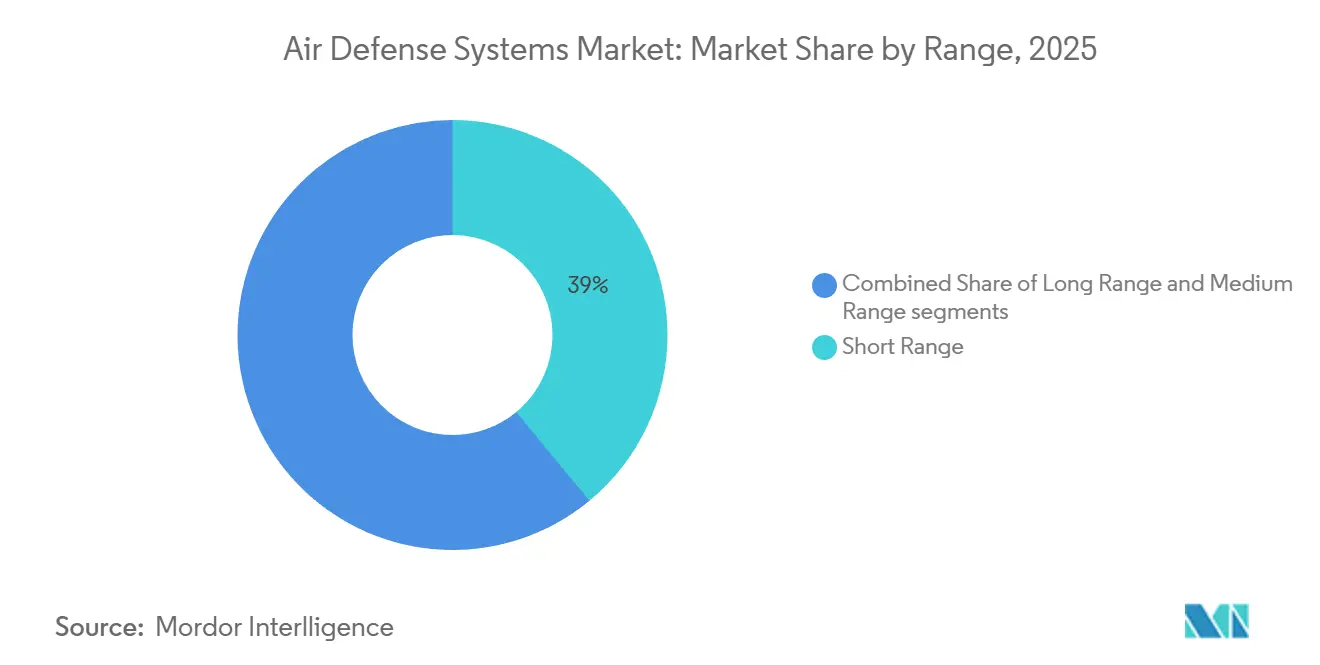
- By range, long-range interceptors accounted for 38% of the air defense systems market in 2025 and are forecast to grow at an 8.15% CAGR through 2031.
- By subsystem, weapon systems held 25.65% of the air defense systems market share in 2025, while fire control systems are projected to expand at an 8.91% CAGR through 2031.
- By technology, kinetic-kill effectors accounted for 42.45% of the air defense systems market in 2025, whereas high-power microwave systems are forecast to grow at a 9.55% CAGR through 2031.
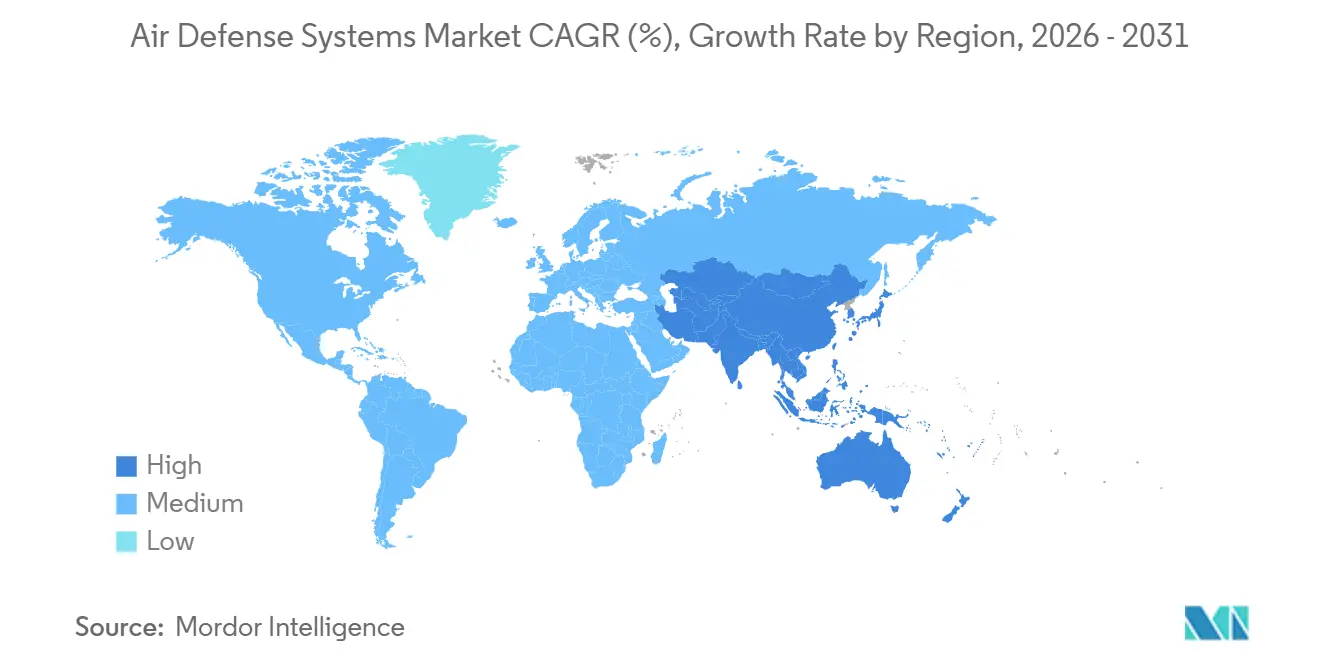
- By geography, North America led the air defense systems market with a 46.62% share in 2025; the Asia-Pacific region is forecast to grow at a 9.76% CAGR through 2031.
Note: Market size and forecast figures in this report are generated using Mordor Intelligence’s proprietary estimation framework, updated with the latest available data and insights as of January 2026.
Market Trends and Insights
Drivers Impact Analysis of Air Defense Systems Market*
| Driver | (~) % Impact on CAGR Forecast | Geographic Relevance | Impact Timeline |
|---|---|---|---|
| Acceleration of integrated air and missile defense procurement | +1.8% | Global, with concentration in NATO and INDOPACOM | Medium term (2-4 years) |
| Escalating spectrum of airborne threats | +1.5% | Eastern Europe, Middle East, Korean Peninsula | Short term (≤2 years) |
| AI-enabled sensor fusion for stealth detection | +1.2% | North America, Europe, Japan, South Korea, Australia | Medium term (2-4 years) |
| Mobile directed-energy SHORAD adoption | +0.9% | North America, Europe, Middle East | Medium term (2-4 years) |
| GaN-based AESA radar cost decline | +0.7% | North America and Europe lead global adoption | Long term (≥4 years) |
| Higher budgets for counter-UAS and point defense | +1.0% | Global, with spikes in Ukraine and Middle East | Short term (≤2 years) |
| Source: Mordor Intelligence | |||
Acceleration of Integrated Air and Missile Defense Procurement
Armed forces are converging once-separate radar, interceptor, and command networks into unified frameworks that share tracks across services and allies. The US Army’s Integrated Battle Command System (IBCS) links Patriot, THAAD, Sentinel, and F-35 sensors via a common software backbone, reducing engagement timelines from minutes to seconds. Europe mirrors this approach: the European Sky Shield Initiative, counting 21 members by late 2024, aligns purchases of IRIS-T SLM, Patriot, and Arrow 3 to avoid duplicative national programs. Contracts now reward integrators that can certify plug-and-play interfaces, raising entry barriers for newcomers lacking legacy protocols. Poland’s USD 4.75 billion Wisla order was explicitly designed to bundle IBCS nodes.[1] As joint targeting moves toward real-time kill chains, satellite constellations feed birth-to-death tracks directly into ground batteries, completing the multi-domain loop.[2]
Escalating Spectrum of Airborne Threats
Hypersonic glide vehicles, low-observable cruise missiles, and cooperative drone swarms compress reaction time to seconds, forcing the modernization of radar. Russia’s Kinzhal attacks in Ukraine accelerated deliveries of the GaN-based Lower Tier Air and Missile Defense Sensor (LTAMDS), which detects objects with radar cross-sections below 0.01 m². China’s DF-17 spurred Japan to consider THAAD batteries and to co-fund the Hypersonic and Ballistic Tracking Space Sensor program, with prototype satellites slated for 2025. Ukraine’s adaptation of USD 1,000 quadcopters into tank killers revealed the asymmetric payoff of cheap aerial platforms, prompting the US Joint Counter-small UAS Office to vet nine low-cost systems in 2024.
AI-Enabled Sensor Fusion for Stealth Detection
Machine-learning (ML) algorithms now correlate radar, infrared, and electronic support measure returns to classify elusive targets. Northrop Grumman’s IBCS software employed neural networks during Project Convergence 2024, cutting false alarms by 30% in littoral clutter. Palantir’s Apollo platform merges LTAMDS, Sentinel, and space-based IR feeds every two seconds, a five-fold improvement over legacy cycles. Israel’s Iron Dome upgrade fused UAV electro-optical imagery with ELM-2084 radar data, boosting intercept probability against maneuvering rockets by 15%. The primary friction point is bandwidth; current Link 16 data links cannot stream high-resolution synthetic aperture radar, prompting parallel investment in Link 22 and future MDO networks.
Mobile Directed-Energy SHORAD Adoption
Laser and high-power microwave effectors offer unlimited magazines and a potential cost of under USD 1 per shot, a compelling alternative to firing a USD 500,000 missile at a USD 1,000 drone. The US Army deployed four 50-kilowatt Directed Energy Maneuver-SHORAD vehicles to Europe in February 2024, each capable of defeating drones up to 5 kilometers away. The UK's DragonFire laser achieved GBP 10 (USD 13) shots during July 2024 trials, a fraction of the cost of a missile. Israel's Iron Beam, which combines a 100-kilowatt laser with Iron Dome radars, is set to enter service in late 2025 and intercept rockets within a 7-kilometer range for under USD 2 per kill. Atmospheric attenuation and thermal management remain significant challenges; continuous firing requires liquid-cooling units that add approximately 500 kg to the platform's weight.
Restraints Impact Analysis of Air Defense Systems Market*
| Restraint | (~) % Impact on CAGR Forecast | Geographic Relevance | Impact Timeline |
|---|---|---|---|
| Supply-chain bottlenecks in GaN radar modules | -0.6% | North America and Europe face acute shortages | Short term (≤2 years) |
| Stringent ITAR and MTCR export controls limiting system sales to emerging nations | -0.5% | Middle East, Southeast Asia, Latin America | Long term (≥4 years) |
| Technical and materials challenges in reliably intercepting maneuvering hypersonic targets, inflating R&D risk | -0.4% | North America, Europe, Japan, South Korea | Long term (≥4 years) |
| Electromagnetic spectrum congestion raising interoperability challenges | -0.3% | NATO and coalition operations worldwide | Medium term (2-4 years) |
| Source: Mordor Intelligence | |||
Supply-Chain Bottlenecks in GaN-Based Radar T/R Modules
Reliance on a handful of wafer fabs creates single-point vulnerabilities. Wolfspeed’s Mohawk Valley plant supplies over 40% of the US's defense-grade GaN wafers; any outage would ripple across the LTAMDS, SPY-6, and F-35 lines. Yield rates of roughly 65% for X-band MMICs necessitate that OEMs overbook wafers by 30%, thereby inflating inventory costs. With gallium exports now subject to Chinese quotas, average lead times for 200-mm wafers stretch to 16 weeks, delaying full radar deliveries until 2028 for orders placed in 2026.
Stringent ITAR and MTCR Export Controls Limiting System Sales to Emerging Nations
Category VIII and XI listings under ITAR require State Department licensing for any foreign sale of radar or interceptors. At the same time, the MTCR caps range above 300 kilometers, restricting exports of Patriot PAC-3 MSE and THAAD outside major allies. Ankara’s 2019 ejection from the F-35 program over S-400 procurement underscored the commercial risk of non-compliance. Work-arounds include co-production, such as Lockheed Martin’s PAC-3 MSE partnership with Mitsubishi in Japan, but that path suits only large economies willing to share tooling and intellectual property.
*Our forecasts treat driver/restraint impacts as directional, not additive. The impact forecasts reflect baseline growth, mix effects, and variable interactions.
Air Defense Systems Market Segment Analysis
By System:
Directed Energy Extends the Engagement EnvelopeDirected-energy architectures are projected to register an 11.08% CAGR through 2031, the fastest among major segments, reflecting the operational need for inexpensive, high-rate engagements that lasers and high-power microwave systems provide. The US Navy's 60-kilowatt Layered Laser Defense aboard USS Preble neutralized subsonic cruise missiles at ranges up to 3 kilometers at a cost of less than USD 1 per shot.[3] Missile defense solutions nevertheless retained 43.91% of the air defense systems market share in 2025, underpinned by PAC-3 MSE and THAAD backlogs that extend into 2028 due to shortages of solid-rocket motors.
The air defense systems market continues to pivot toward counter-UAS, C-RAM, and high-power microwave options that promise deep magazines and low costs against saturating drone attacks. Rheinmetall's Skyranger 30, adopted by Germany in 2024, couples 30-mm airburst rounds with radar cueing to defeat quadcopters cost-effectively. The US Marine Corps' procurement of Anduril's integrated counter-UAS suite validated software-defined architectures that can update defenses through code updates rather than hardware swaps.

By Platform:
Land Dominance Sustains Mobility InvestmentsLand configurations secured 59.75% of the air defense systems market in 2025 and are expected to grow at a CAGR of 8.21% through 2031 as armies rediscover the value of mobile SHORAD. The US Army’s IM-SHORAD roll-out of 144 Stryker-mounted launchers combines Stinger, Hellfire, and a 30-mm cannon to protect maneuver forces within an 8-kilometer radius. Europe is emulating this playbook; Boxer-mounted Skyranger turrets provide German brigades with movable drone defense that keeps pace with their armor columns.[4]
Sea-based capacity benefits from Aegis upgrades; Japan’s Maya-class destroyers feature SPY-1D(V) radars and SM-3 IIA interceptors, expanding the air defense systems market at sea and ensuring regional missile coverage aligns with US assets. Airborne systems, such as the F-35’s Distributed Aperture System and airborne countermeasure system capabilities, add detection but not yet kinetic response, positioning them as forward sensors rather than shooters.
By Range:
Long-Range Demand AcceleratesLong-range batteries are forecast to grow at an 8.15% CAGR through 2031 as hypersonic and exo-atmospheric threats proliferate. Germany’s Arrow 3 deal exemplifies Europe’s first acquisition of an exo-atmospheric layer capable of engagements beyond 100 kilometers in altitude, expanding the market for strategic interceptors. Short-range weapons still dominate numerically. Iron Dome intercepted over 90% of rockets fired in 2024 operations, validating C-RAM for highly populated areas.
Medium-range solutions remain the backbone of NATO airspace, with the Patriot PAC-3 MSE offering up to 160 kilometers of coverage, and Poland’s purchase of eight Wisla batteries highlights the importance of interoperability via IBCS. South Korea’s KM-SAM exports to the UAE demonstrate that sub-50-kilometer systems can succeed commercially when priced 30% below Western incumbents and free of MTCR constraints.
By Sub-System:
Fire-Control Software Gains MomentumFire-control elements are posting an 8.91% CAGR as neural-network fusion becomes indispensable. IBCS has already trimmed false-alarm rates by 30% and enables cross-domain cueing in under 10 seconds, features that elevate the air defense systems industry to a software-centric paradigm. Weapon subsystems, missiles, guns, and lasers retain a 25.65% share, anchored by Lockheed Martin’s USD 1.7 billion Precision Strike Missile contract that will replace ATACMS by 2029.
Command-and-control is benefiting from Joint All-Domain Command and Control investments, as demonstrated by the US Air Force’s ABMS-linked F-35 sensors, which were able to engage Patriot firing units in 10 seconds during 2024 exercises, significantly tightening the engagement loop. Open-architecture mandates under the Modular Open Systems Approach (MOSA) are fragmenting the subsystem supply base, allowing niche power-supply or cooling vendors to win standalone contracts.
By Technology:
High-Power Microwave Moves From Lab to FleetHigh-power microwave concepts are projected to register a 9.55% CAGR through 2031 as navies and armies field prototypes. The US Navy’s at-sea CHAMP trial in January 2026 successfully disabled Group 2-3 drones at distances below 2 kilometers, achieving an 85% success rate and demonstrating readiness for deck deployment. Kinetic-kill effectors still represent 42.45% of the 2025 market, as validated by ongoing production of PAC-3 MSE, THAAD, and SM-3.
EW soft-kill packages such as the Army’s Terrestrial Layer System now accompany maneuver brigades, jamming GPS and data links to neutralize drones without physical destruction. These capabilities also raise legal questions about compliance with international humanitarian law, an area where consensus remains nascent.
Geography Analysis
North America Air Defense Systems Market
North America commanded 46.62% of the air defense systems market in 2025 as the US DoD outlays exceeded USD 8 billion for modernization. RTX’s USD 1.2 billion LTAMDS order for 28 radars, to be delivered by 2028, underscores its continuing investment in GaN arrays that track stealth aircraft at a range of 400 kilometers. NORAD upgrades now incorporate NASAMS batteries and Tracking Layer downlinks, expanding continental warning architecture.[5] Canada participates actively, while Mexico’s limited focus is on counter-narcotics C-UAS along the US border.
APAC Air Defense Systems Market
Asia-Pacific is projected to grow at a 9.76% CAGR through 2031, the highest regional pace. Japan allocated USD 2.3 billion in FY 2025 for ballistic-missile defense upgrades, including THAAD considerations and satellite tracking investments. South Korea’s KM-SAM exports to the UAE and Poland illustrate Seoul’s cost competitiveness in the mid-tier arena. India is scaling its QRSAM line to 200 missiles annually by 2027 to reduce reliance on Russian S-400s. Australia’s NASAMS order and AUKUS collaboration indicate tighter US integration, while China’s opaque HQ-9 exports to Pakistan suggest production volumes exceeding 50 batteries per year.
Europe Air Defense Systems Market
Europe accelerated procurement under the European Sky Shield Initiative, which enrolls 21 nations committed to interoperable layers. Germany’s Arrow 3 breakthrough diversifies suppliers beyond the United States. The UK’s DragonFire laser will start sea trials in 2027, adding directed-energy depth to naval defenses. France and Italy continue to develop the SAMP/T NG in line with NATO IAMD requirements, aiming to meet the 2028 IOC.
Middle East Air Defense Systems Market
The Middle East remains a hotspot as Saudi Arabia’s THAAD batteries counter Houthi missiles. The UAE modernized its defense capabilities with Patriot and NASAMS while fast-tracking counter-UAS measures following the Red Sea incidents. Israel’s Iron Dome, David’s Sling, and Arrow layers maintained 90% intercept success, and Iron Beam will soon extend that envelope.
South America and Africa Air Defense Systems Market
South America and Africa remain embryonic segments, as Brazil evaluates NASAMS and RBS 70 NG for Amazon border defense, while South Africa’s Umkhonto-IR supplies naval point defense amid budget constraints.
Regulatory Landscape
Regulation for air defense systems is shaped by export-control regimes and interoperability policies that determine who can buy high-end sensors and interceptors, and how systems integrate across allies. In the United States, International Traffic in Arms Regulations (ITAR) licensing requirements continue to gate foreign transfers of radars and interceptors. The Department of Defense issued DoDD 5134.20E (effective April 25, 2025) to formalize nonstandard acquisition policies for Missile Defense System (MDS) elements, reinforcing accelerated procurement pathways for missile defense capabilities.
In Europe, NATO defense ministers endorsed the Integrated Air and Missile Defence Policy on February 13, 2025, reinforcing alliance-level direction for layered, interoperable architectures that align national procurements. The European Commission adopted the 2025 European Defence Fund (EDF) Work Programme, which prioritizes AIRDEF-related collaborative development, reflecting the shift toward common standards and multi-nation industrial participation. In China, the National Development and Reform Commission (NDRC) advanced governance of civil air defense through measures effective January 1, 2025 for civil air defense protection equipment and new civil air defense industry-standards management measures issued July 2, 2025. The T/ZS 0802-2026 data-management specification for civil air defense works began implementation on February 9, 2026.
Value Chain Analysis
The air defense systems value chain starts with upstream materials and microelectronics (GaN wafers and RF components), then moves through sub-tier manufacturing of seekers, propulsion, and radar T/R modules. Prime integration follows, including radars, launchers, fire control, and command-and-control networks, followed by test and certification, delivery, and long-life sustainment (spares, depot repair, software updates, and training). Sub-tier constraints shape throughput: solid rocket motors (for Patriot, THAAD, and Standard Missile families) and active radar seekers remain recurring bottlenecks. Reuters-reported roadblocks in the US-Japan Patriot production plan highlighted dependence on a limited-capacity component supply base.
Downstream, procurement increasingly bundles sensors and effectors with industrial cooperation and multi-country sustainment constructs, shifting value toward integrators that can field interoperable architectures and sustain availability. Romania signing a record SPYDER air defense deal with Rafael in June 2026, with extensive local production and industrial cooperation, illustrates this. Kuwait procuring NASAMS via US Foreign Military Sales with a June 2026 Kongsberg-Raytheon contract valued at USD 400 million adds a separate example of the same pattern. In Benelux, Belgium's July 2026 package combining NASAMS, Rheinmetall Skyranger 30, Thales GM200 radars, and command vehicles for integration with the Netherlands shows how shared architectures are standardizing logistics and maintenance across partners.
Competitive Landscape
Market concentration is moderate, with RTX Corporation, Lockheed Martin Corporation, Israel Aerospace Industries Ltd., Thales Group, and Northrop Grumman Corporation capturing about 50% of the market share in 2025, owing to their decades-long integration with legacy command-and-control (C2) systems. RTX’s 2024 revenue climbed 9% to USD 79.8 billion on LTAMDS and Patriot upgrades, while Lockheed Martin’s backlog reached USD 160 billion, ensuring multiyear production visibility. Israel Aerospace Industries disrupted the exo-atmospheric niche with the export of Arrow 3 to Germany, ending an effective US monopoly and demonstrating that allies will diversify suppliers to mitigate single-source risk.
Hanwha Systems exemplifies rising South Korean entrants: its KM-SAM undercuts Patriot by roughly 30% and sidesteps MTCR-related range barriers, enabling penetration into the Middle East. Anduril illustrates how software-centric start-ups can secure USD 640 million counter-UAS awards by layering AI and modular hardware.
Directed-energy adoption remains a competitive wild card. The US Army’s DE M-SHORAD prototypes validated 50-kilowatt lasers against Group 3 drones; however, thermal load and atmospheric effects mean that scale deployment still favors incumbents with power-management expertise. Open-architecture mandates, such as MOSA, erode incumbent lock-in by allowing niche suppliers to bid on subsystem modules, thereby fragmenting future market share. ITAR compliance continues to gatekeep emerging-market sales, preserving the oligopolistic structure in high-end interceptors while creating room for tier-two vendors in short-range segments.
Air Defense Systems Industry Leaders
-
RTX Corporation
-
Lockheed Martin Corporation
-
Israel Aerospace Industries Ltd.
-
Thales Group
-
Northrop Grumman Corporation
- *Disclaimer: Major Players sorted in no particular order
Air Defense Systems Market Companies Covered in this Report
- RTX Corporation
- Lockheed Martin Corporation
- Israel Aerospace Industries Ltd.
- Northrop Grumman Corporation
- Thales Group
- Saab AB
- Rheinmetall AG
- Leonardo S.p.A.
- Kongsberg Gruppen ASA
- The Boeing Company
- ASELSAN Elektronik Sanayi ve Ticaret A.S.
- Hanwha Systems Co., Ltd.
- Rafael Advanced Defense Systems Ltd.
- L3Harris Technologies, Inc.
- BAE Systems plc
- MBDA
- Diehl Defence (Diehl Group)
- Elbit Systems Ltd.
- Bharat Dynamics Limited
- China Aerospace Science and Technology Corporation
- MDA Ltd.
- China North Industries Group Corporation
Market Opportunities and Future Outlook
Opportunities are concentrated where governments are institutionalizing layered, interoperable air and missile defense and where low-cost mass threats, especially drones and rockets, are forcing new effector mixes. NATO alignment and multinational procurement constructs widen the addressable market for systems that can plug into allied command networks and accept mixed sensor inputs. Belgium's July 2026 plan to acquire NASAMS, Skyranger 30, and Thales Ground Master 200 radars as part of a shared Benelux architecture indicates sustained demand for open, network-ready components rather than stand-alone batteries.
A second area is affordable depth of magazine, spanning low-cost interceptors, reusable effectors, and high-rate solutions for counter-UAS and point defense. The United Kingdom's July 2026 LEAP awards for low-cost air defense interceptors point to active budget lines for cheaper engagements against drone swarms, complementing kinetic inventories constrained by seeker and rocket-motor capacity. Parallel investments in national and coalition missile-defense architectures also pull new requirements for integrated sensors, battle management, and production scale, including the US Army's FY2027 budget request with funding lines for M-SHORAD and the Next Generation Short Range Interceptor (NGSRI).
Recent Industry Developments in Air Defense Systems Market
- June 2026: Lockheed Martin received a seven-year undefinitized contract action valued up to USD 35 billion to accelerate Terminal High Altitude Area Defense (THAAD) interceptor production, with a stated ramp from 96 to 400 interceptors per year. The award supports industrial-base scaling for strategic missile defense and increases long-range interceptor availability for integrated air and missile defense architectures.
- May 2026: RTX received a USD 1 billion contract from the US Department of War to manufacture and deliver NASAMS air defense systems for Kuwait. The order reinforces the role of the US Foreign Military Sales channel in scaling interoperable medium-range air defense and adds volume pull for AMRAAM-ER and associated fire-control and radar integration.
- April 2026: RTX secured a USD 234.7 million contract transitioning AMRAAM-ER surface-to-air missiles to full-rate production for NASAMS partners. Moving to full-rate production increases missile supply for allied batteries and supports broader adoption of networked, distributed air defense across multiple geographies.
Air Defense Systems Market Report Scope and Research Methodology
Market Definition and Coverage
This market covers revenues from air defense systems that are procured and fielded to detect, track, and intercept airborne threats, including aircraft, missiles, rockets, artillery, and unmanned systems, along with the linked radar, launcher, fire-control, and command-and-control elements needed to operate them.
Scope exclusions: Stand-alone early-warning radars and sensor-only upgrades that are not tied to an interceptor or effector layer in a deployable air defense solution are excluded.
Segments Covered in This Report
- By System
- Missile Defense Systems
- Anti-Aircraft Gun and SAM Systems
- Counter-Unmanned Aerial Systems (C-UAS)
- Counter-Rocket, Artillery and Mortar (C-RAM)
- Directed Energy Weapons (DEWs)
- By Platform
- Land-Based
- Sea-Based
- Air-Based
- Space-Based Early-Warning Assets
- By Range
- Short Range
- Medium Range
- Long Range
- By Sub-system
- Weapon System
- Fire Control System
- Command and Control (C2) System
- Others
- By Technology
- Kinetic-Kill Effectors
- High-Energy Laser Systems
- High-Power Microwave Systems
- Electronic Warfare (EW) Soft-Kill Solutions
- By Geography
- North America
- United States
- Canada
- Mexico
- Europe
- United Kingdom
- France
- Germany
- Russia
- Rest of Europe
- Asia-Pacific
- China
- India
- Japan
- South Korea
- Rest of Asia-Pacific
- South America
- Brazil
- Rest of South America
- Middle East and Africa
- Middle East
- Saudi Arabia
- United Arab Emirates
- Israel
- Rest of Middle East
- Africa
- South Africa
- Rest of Africa
- Middle East
- North America
Data Sources, Market Sizing, and Validation
Desk Research
Desk work starts with open defense spending and trade signals so the model is not built on assumptions first. Sources include public defense budget documents and procurement plans, official releases from defense ministries and armed forces, and multilateral datasets such as SIPRI military expenditure and arms transfer databases, plus UN Comtrade trade codes to sanity-check electronics, missile, and radar related flows.
We also reviewed regulatory and standard-setting bodies for aviation and spectrum context, then used technical publications and peer-reviewed defense and aerospace journals to understand performance benchmarks that shape demand, such as engagement range and radar coverage. Company annual reports, investor presentations, and reputable press were used to map program timelines and delivery status, and patent databases helped validate technology direction in seekers, radars, and counter-UAS. Where needed, paid subscriptions for company financials and news intelligence, defense contracts and tenders, and shipment-level trade datasets were used to validate program awards and delivery milestones. These examples are not exhaustive, and other public sources were consulted to compile data, cross-check it, and clarify open questions.
Primary Interviews and Surveys
Primary work centered on structured discussions with defense procurement specialists, integrators, subsystem suppliers, and retired operators who can explain what is actually being bought, and what tends to get delayed. Inputs were used to confirm the procurement unit, typical order size, delivery phasing, and how upgrades are treated versus new systems across key regions, then to pressure-test assumptions that could not be cleanly derived from public documents alone.
Distribution of primary research fieldwork respondents
| Company type | Respondent position | Region |
|---|---|---|
| Top tier: 26% | CXOs: 13% | APAC: 44% |
| Mid tier: 57% | Functional/Unit leaders: 34% | EMEA: 34% |
| Smaller Players: 17% | Managers: 53% | Americas: 22% |
Market-Sizing & Forecasting
Sizing starts from a top-down build where defense procurement and delivery data are reconstructed into an addressable air defense spend pool, then filtered by system categories that qualify as integrated detect to engage solutions. Once that demand pool is built, we corroborate it with selective bottom-up checks such as sampled program values by country, typical battery or unit configurations, and sampled ASP times tied to expected deliveries. This helps adjust totals when public budgets are not execution-ready.
Key inputs used in the model include defense capital expenditure direction, active and planned air defense programs and delivery schedules, mix shifts across short, medium, and long range solutions, the rise of counter-UAS requirements, and radar and interceptor replenishment patterns that follow regional threat posture. Pricing progression was handled through observed contract award signals and inflation assumptions for major subsystems, including radars, interceptors, launchers, and C2. Gaps were handled by using proxy programs and peer-country comparables when a country reports only partial procurement detail.
For forecasting, scenario analysis is used because defense procurement can move in steps rather than smooth lines. Assumptions on procurement tempo, delivery slippage, and replenishment cycles are set from expert consensus, and then scenarios are reconciled back to the most plausible case before publishing the final year-by-year curve.
Data Validation & Update Cycle
Model outputs are checked against independent signals, including defense budget execution direction, public program milestone updates, and contract award patterns that should align with the implied delivery value. If any country or region shows an unusual jump, the line items are re-reviewed, the conversion and timing are rechecked, and primary contacts are re-engaged when the variance cannot be explained by an announced procurement event.
Before sign-off, the work is reviewed in multiple steps so the assumptions, inputs, and math remain consistent across regions and years. The report is refreshed annually, and interim updates are completed when material events occur, such as large new awards, cancellations, or major conflicts that change procurement priorities. Right before delivery, a final analyst pass is performed so clients receive the latest updated view.
Mordor Intelligence's Air Defense Systems Market Sizing Compared With Other Published Estimates
Published market sizes for air defense systems can look far apart because the boundary of what is counted is not the same across studies, and because different teams choose different timing rules for multi-year procurement programs. Currency conversion timing, whether upgrades are treated as market revenue, and how delivery schedules are interpreted also create spread, even when all studies reference the same defense headlines.
Contract award announcements, delivery milestone disclosures, and budget execution signals are used as evidence checks that keep Mordor Intelligence's estimate anchored to deliverable integrated systems that include an effector layer, rather than broader defense electronics totals. When a published number includes sensor-only modernization, stand-alone early warning radars, or a larger set of adjacent missile categories, the reported market size naturally increases. On the other side, conservative scenarios that assume longer slippage for deliveries can push near-term value down even if the long-term trajectory looks similar.
Benchmark comparison
| Source | Market Size | Gaps in Research Methodology |
|---|---|---|
| Mordor Intelligence | USD 17.69 B (2026) | |
| Global Consultancy A | USD 49.58 B (2024) | Uses a broader global revenue view for air defense systems and related components, which can include wider platform and component definitions and may not separate delivery value from wider program and system scope consistently across regions. |
| Industry Publisher B | USD 45.80 B (2024) | States a revenue-based global total with broad segment buckets, and does not clearly call out exclusions like stand-alone early warning radars or sensor-only upgrades, which can expand the counted market compared with integrated interceptor-centric systems. |
The table mainly reflects scope and timing differences, not a disagreement on demand direction. By tying the market value to deliverable integrated air defense solutions and then validating the result with public procurement and milestone evidence, the final number stays traceable to clear inputs that a reader can follow and repeat.
Key Questions Answered in the Report
How large is the air defense systems market in 2026?
The air defense systems market size stands at USD 17.69 billion in 2026 and is on track to reach USD 25.82 billion by 2031, expanding at a 7.85% CAGR.
Which region is expanding the fastest?
Asia-Pacific records the highest 9.76% CAGR through 2031, propelled by Japanese, South Korean, and Indian procurement.
What system type is growing most rapidly?
Directed-energy weapons (DEWs) exhibit the fastest 11.08% CAGR thanks to sub-dollar cost per engagement and unlimited magazine depth.
Who are the leading companies?
RTX Corporation, Lockheed Martin Corporation, Israel Aerospace Industries Ltd., Thales Group, and Northrop Grumman Corporation together command more than half of North American orders, while Israel Aerospace Industries and Hanwha Systems are growing in Europe and the Middle East.
What are the main bottlenecks slowing deliveries?
Limited GaN wafer capacity, ITAR/MTCR export controls, and technical hurdles intercepting hypersonic glide vehicles delay some systems until 2028 or later.
How are militaries dealing with drone swarms?
Forces are combining AI-enabled sensors, directed-energy lasers, high-power microwaves, and low-cost interceptors such as the Coyote to create layered counter-UAS defenses.