
Air Conditioner Market Size and Share
Air Conditioner Market Analysis by Mordor Intelligence
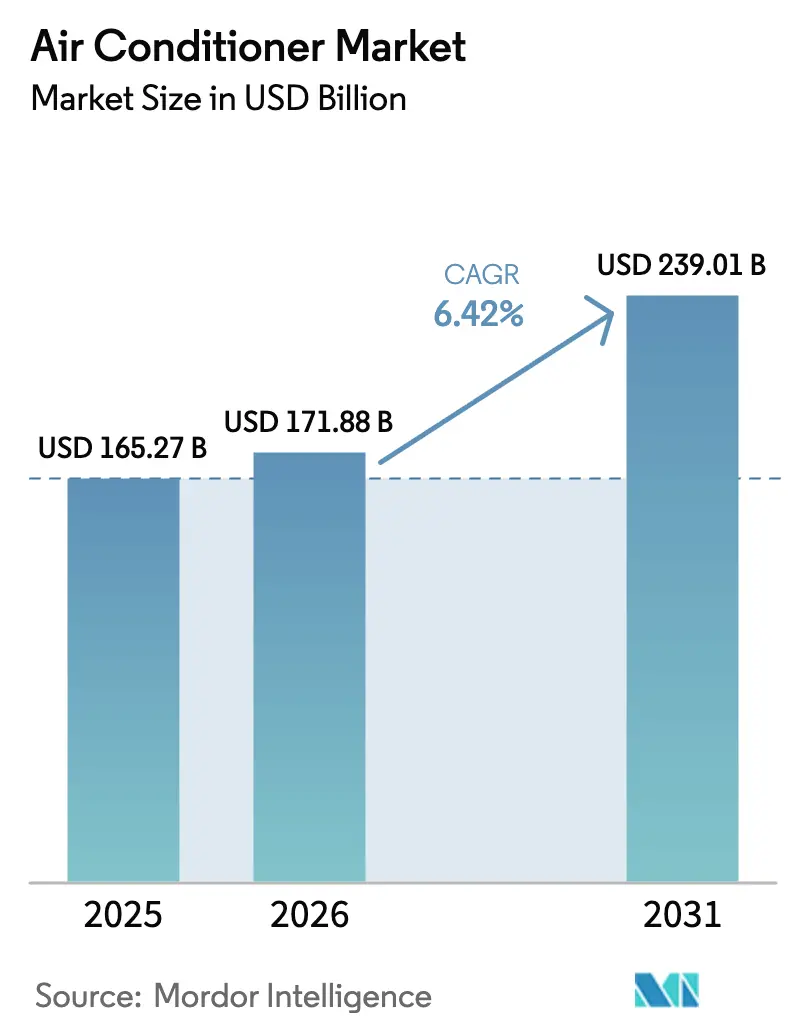
The air conditioner market size is expected to grow from USD 171.9 billion in 2026 to USD 183.6 billion in 2027 and is forecast to reach USD 251.8 billion by 2032 at 6.52% CAGR over 2027-2032.
Urban heat exposure and improving household purchasing power strengthen the case for room cooling, while China's efficiency-linked subsidies reduce acquisition costs for qualifying equipment. India's inverter transition also opens a replacement route as new purchases change the installed equipment mix. Manufacturers can respond with production partnerships and consumer-retail fulfillment models that connect equipment supply to specific buying requirements. High initial prices and refrigerant-transition premiums keep affordability central to the sales proposition. With high acquisition costs constraining first-time adoption, efficiency subsidies in China and inverter replacement in India make upgrades a stronger route to growth.
Key Report Takeaways
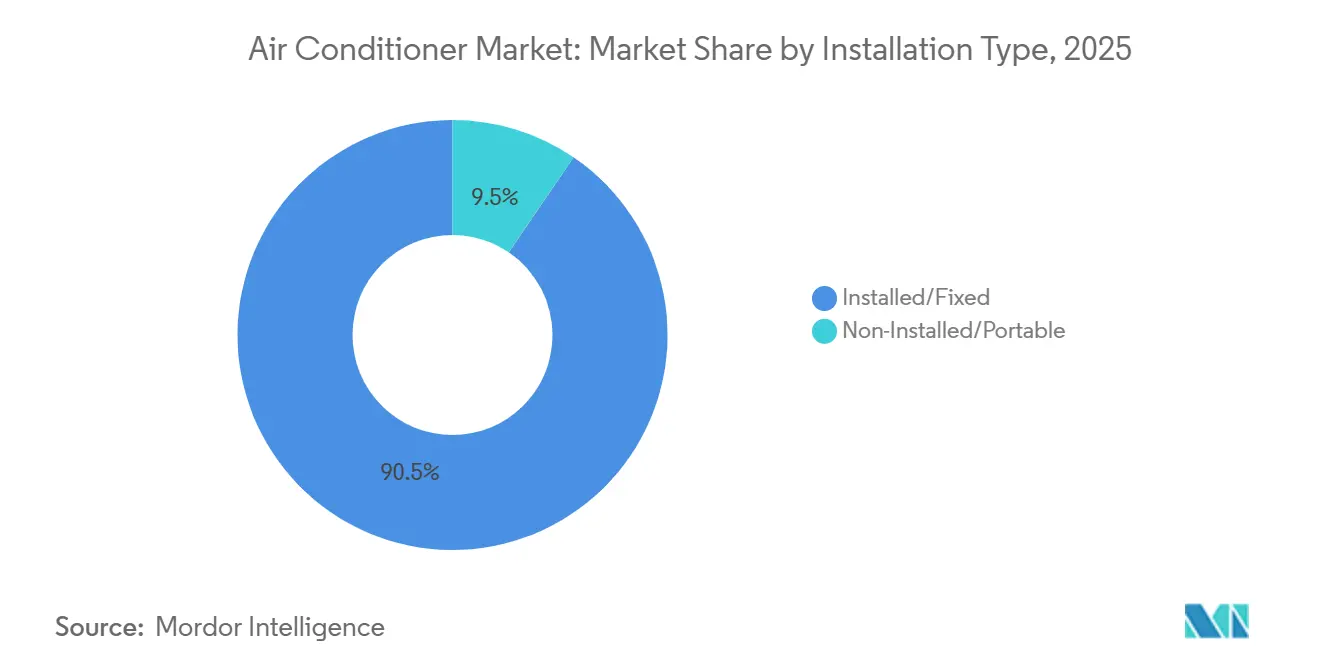
- By installation type, installed/fixed units held a 90.41% air conditioner market share in 2026, while non-installed/portable units are forecast to grow fastest at 7.3% CAGR over 2027-2032.
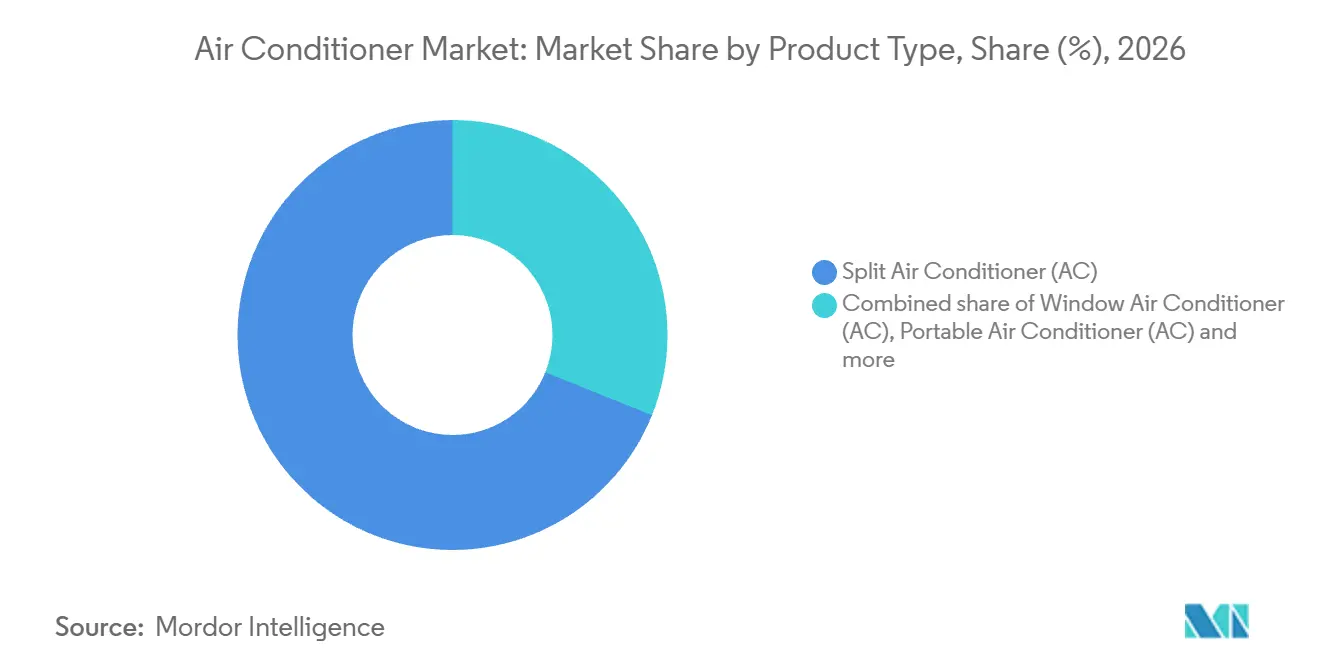
- Split air conditioners led product type with a 68.92% share of the air conditioner market size in 2026, and portable units are forecast to grow fastest at 7.3% CAGR over 2027-2032.
- Residential users led end-user demand with a 71.36% revenue share in 2026, while commercial users are forecast to grow fastest at 7% CAGR over 2027-2032.
- Inverter technology held a 72.39% revenue share in 2026 and is the fastest-growing technology segment, with a forecast 7.3% CAGR over 2027-2032.
- By capacity, units below 3 kW accounted for 58.2% of revenue in 2026, while 3-7 kW units are forecast to grow fastest at 7.4% CAGR over 2027-2032.
- Consumer retail led distribution with 75.08% of revenue in 2026 and is forecast to be the fastest-growing channel, at 6.86% CAGR over 2027-2032.
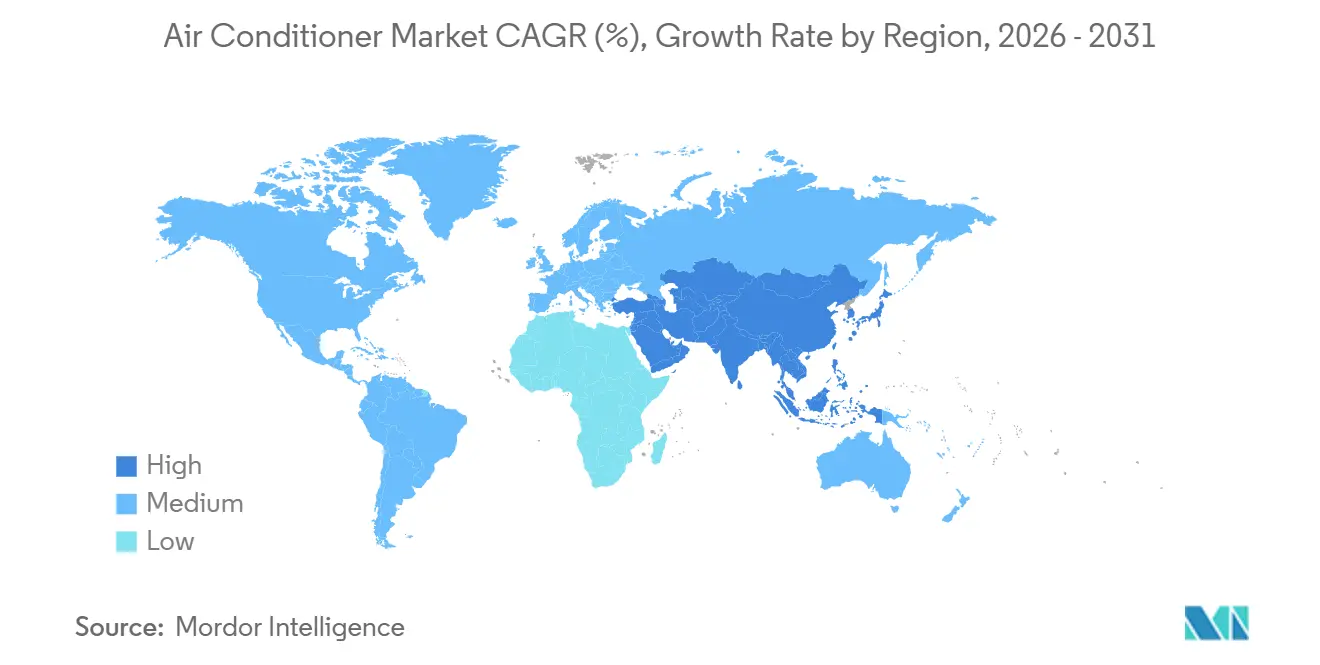
- Geographically, Asia-Pacific held a 47.17% revenue share in 2026, while the Middle East and Africa region is forecast to grow fastest at 7.25% CAGR over 2027-2032.
Note: Market numbers in this report are based on Mordor Intelligence's proprietary estimation framework, which combines nine months of actuals with Q4 projections for base year 2026.
Market Trends and Insights
Drivers Impact Analysis of Air Conditioner Market*
| Driver | (~) % Impact on CAGR Forecast | Geographic Relevance | Impact Timeline |
|---|---|---|---|
| Intensifying urban heat-island effects and rising temperature anomalies | +2.6% | London's urban sensor clusters | Long term (≥ 4 years) |
| Rising disposable income among the emerging middle class | +2.1% | China's nationwide household markets | Medium term (2-4 years) |
| Accelerated adoption of energy-efficient inverter AC technology | +1.9% | India's room-air-conditioning markets | Medium term (2-4 years) |
| Government incentives and subsidies promoting high-star-rated air conditioners | +1.4% | China's national consumer markets | Short term (≤ 2 years) |
| Commercial lease mandates emphasizing workplace comfort and wellness | +0.6% | Sunnyvale, California office premises | Medium term (2-4 years) |
| AI-enabled predictive maintenance reduces the total cost of ownership | +0.5% | Asia-Pacific, North America and Europe | Long term (≥ 4 years) |
| Source: Mordor Intelligence | |||
Intensifying urban heat-island effects and rising temperature anomalies
Urban heat-island exposure adds a local demand trigger for cooling in densely built districts. Using a 25-location sensor network, researchers measured London urban heat-island intensity of 0.4°C to 2.8°C against an Essex reference site in June 2025. The peaks coincided with 2 heatwaves, on June 16-21 and June 27-30. These local air-temperature differences mean that a wider area's weather reading can understate the exposure relevant to an urban building's cooling decision. Where that additional heat exceeds an urban building's existing cooling capability, installation or upgrading becomes relevant even if the reference site's temperatures would not justify the same intervention.
Rising disposable income among the emerging middle class
Rising household income improves the commercial case for equipment that must be paid for before it delivers cooling. China's nationwide per-capita disposable income rose 5% in 2025 in both nominal and real terms. For a household replacing a unit, acquisition affordability determines whether a more efficient model can be considered before operating savings accrue. China's established household ownership base makes that decision relevant alongside first-time adoption. Real income growth supports the budget for renewing existing cooling equipment, extending the demand opportunity beyond households buying their first air conditioner.
Accelerated adoption of energy-efficient inverter AC technology
Inverter adoption changes the equipment entering service faster than it changes the cooling fleet already in homes. The Alliance for an Energy Efficient Economy's 2025 India room AC stocktake reports inverter models at about 77% of new sales, up from about 1% in 2015.[1] The same stocktake places their share of the installed base at roughly half. The stocktake also examines efficiency loss in aging equipment alongside the policy case for replacement. If replacement purchases follow that new-sales mix, retiring fixed-speed equipment from the remaining half of the installed base would usually add an inverter unit.
Government incentives and subsidies promoting high-star-rated air conditioners
China's efficiency subsidy lowers the purchase hurdle specifically for qualifying high-efficiency air conditioners. From January 1, its 2026 program offers individual buyers 15% of the final discounted price of eligible Grade 1 air conditioners, limited to one unit per person in that category.[2] The per-appliance cap is CNY 1,500 (USD 213.4 at the December 31, 2025 rate), so the effective discount shrinks as a share of price above CNY 10,000, where 15% reaches the cap. That design favors a qualifying upgrade while limiting the public contribution toward more expensive equipment. Suppliers have a clearer commercial reason to place eligible efficiency models within reach of households considering a replacement. The capped benefit makes the final selling price relevant to competition alongside the equipment's energy rating.
Restraints Impact Analysis of Air Conditioner Market*
| Restraint | (~) % Impact on CAGR Forecast | Geographic Relevance | Impact Timeline |
|---|---|---|---|
| High initial cost compared with room coolers, limiting adoption in low-income regions | -1.2% | Low-income areas of India | Long term (≥ 4 years) |
| Strict refrigerant phase-out regulations are increasing compliance costs | -0.8% | United States equipment markets | Medium term (2-4 years) |
| Grid instability and peak-load penalties restrict AC usage in vulnerable regions | -0.4% | Iran's southern provinces | Short term (≤ 2 years) |
| ESG-linked financing discourages investment in non-green HVAC solutions | -0.2% | Vietnam's domestic financing market | Long term (≥ 4 years) |
| Source: Mordor Intelligence | |||
High initial cost compared with room coolers, limiting adoption in low-income regions
An Indian buyer faces a larger acquisition hurdle for an air conditioner than for an evaporative cooler. A 2025 study's price snapshot put AC acquisition costs at 10% to 30% of 2019 median annual household income, compared with 0.5% to 8% for evaporative coolers. Even the lower end of the AC price band exceeded the upper end of the cooler band. That separation can restrict the addressable customer pool at purchase, before any future operating savings become relevant to ownership. The same December 2025 study says low incomes and credit constraints limit adoption of air conditioners in India.
Strict refrigerant phase-out regulations are increasing compliance costs
Refrigerant transitions raise acquisition prices even where buyers accept them. William Blair's first-quarter 2025 analysis of selected US HVAC manufacturers and distributors associated the A2L transition with HVAC equipment prices 8% to 10% higher. The market appeared to accept the higher prices at that stage. The analysts also estimated that tariffs could add a further 2% to 3% on top of the A2L pricing.
*Our forecasts treat driver/restraint impacts as directional, not additive. The impact forecasts reflect baseline growth, mix effects, and variable interactions.
Air Conditioner Market Segment Analysis
By Installation Type:
Fixed Equipment Scale and Portable Unit Sales TractionInstalled/fixed units accounted for a 90.41% share of the air conditioner market size in 2026. The Japan Refrigeration and Air Conditioning Industry Association (JRAIA) estimated global 2025 demand for nonportable residential and commercial unitary air conditioners, including cooling-and-heating heat pumps, at 139.8 million units.[3] The count spans household and commercial units, showing that fixed installation serves both end uses in the report.
Non-installed/portable units are the fastest-growing segment, with a 7.3% CAGR forecast over 2027-2032. By July 1, 2026, Midea had sold more than 300,000 PortaSplit mobile split air conditioners across multiple European markets since the product's 2024 European launch. AUX Electric reported 32.4% year-over-year revenue growth for household mobile units in its unaudited first-half 2026 consolidated results, covering mainland China and other jurisdictions. These examples show commercial scope for relocatable equipment across several national markets. Portability gives suppliers a distinct installation proposition through which to reach cooling buyers, alongside the larger fixed-equipment business.



By Product Type:
Split Production Capacity and Portable Retail DemandSplit air conditioners represented a 68.92% air conditioner market share in 2026. On March 30, 2026, EPACK Manufacturing Technologies Private Limited, EPACK Durable's wholly owned subsidiary, began mass-producing split room air conditioners for anchor customer Hisense in Sri City, India. The facility had installed capacity of 0.75 million sets per year. With Hisense as anchor customer, the plant ties split-unit supply for the leading product type to local production in India.
Portable air conditioners are the fastest-growing segment, with a 7.3% CAGR forecast over 2027-2032. UK electrical retailer Currys' CEO Alex Baldock reported that sales of portable air-conditioning units rose 330% during the United Kingdom's record-breaking heat in June 2026. That retail response illustrates the importance of short selling windows for equipment purchased when temperatures rise. Demand during a heat episode makes the retailer's ability to deliver a usable cooling unit part of the product proposition, alongside rated cooling performance and the customer's immediate need.

By End-User:
Household Equipment Depth and Commercial OrdersResidential users accounted for 71.36% of revenue in 2026, making them the largest segment. China's National Bureau of Statistics reported 161.8 air conditioners per 100 households in 2025, 44.1 more than in 2020. An ownership average above one unit per household indicates equipment depth within the customer base, while the measured increase creates a larger stock exposed to eventual replacement. With multiple units already owned per household on average, replacement cycles operate at the appliance level rather than following household formation alone.
Commercial users are the fastest-growing segment, with a 7% CAGR forecast over 2027-2032. Trane Technologies' Americas Commercial HVAC organic bookings grew 50% in Q2 2026 against Q2 2025, and its backlog rose 90%. The business also reported organic revenue growth in the low teens for the same quarterly comparison. This gap between order growth and realized revenue puts the conversion of booked commercial demand at the center of the manufacturer's opportunity. Converting Trane's backlog into delivered equipment determines how much of this order expansion becomes revenue rather than remaining a future delivery obligation.
By Technology:
Inverter Scale and Power Semiconductor SupplyInverter equipment held 72.39% of revenue in 2026 and is the fastest-growing segment, with a 7.3% CAGR forecast over 2027-2032. Gree Electric Appliances' interim report for the 6 months ended June 30, 2025, described batch application of power semiconductors in inverter air conditioners. Annual usage of the reported power-semiconductor products exceeded 30 million chips, across products also usable in other appliances and intelligent equipment. Gree's wholly owned subsidiary, Zhuhai Zero-Boundary Integrated Circuit Co., Ltd., owned the semiconductor range. This component-use scale connects inverter cooling to an established electronics application base.
Gree Electric Appliances' 2025 annual report said tests of its low-carbon dynamic operation control for inverter air conditioners showed annual power-consumption reductions above 13.6%. The company reported applying the technology to wall-mounted air conditioner series. The project combined coordinated control of the unit's actuators, matching of output to room load and chip integration design. For buyers comparing inverter models, the tested control approach supplies a more specific efficiency consideration than the inverter designation alone.
By Capacity:
Cooling Duty Shapes Capacity ChoicesUnits rated below 3 kW held 58.2% of revenue in 2026, making them the largest segment. Small single-room residential cooling gives this band a specific application, with the purchase adding or replacing equipment for an individual room. Within that load ceiling, inverter and non-inverter versions offer different balances of acquisition price and operating efficiency. For households whose room load fits the rating, improving cooling economics does not require buying a larger unit.
The 3-7 kW category is the fastest-growing segment, with a 7.4% CAGR forecast over 2027-2032. The Air-Conditioning, Heating, and Refrigeration Institute reported 575,926 US shipments by participating manufacturers of central air conditioners and air-source heat pumps in its 16.5-21.9 thousand BTUH band (about 4.8 to 6.4 kW) for January-August 2026. That was 10.7% above the same period of 2025. Above 7 kW, UK research conducted from November 2024 to February 2025 identified typical 10 to 30 kW variable refrigerant flow systems in small offices, retail and restaurants. That shipment gain falls inside the 3-7 kW range, separating this growth evidence from the higher-capacity UK commercial example.
By Distribution Channel:
Retail Positioning and Dealer FulfillmentThe business-to-consumer (B2C) retail channel held 75.08% of revenue in 2026 and is the fastest-growing segment, with a 6.86% CAGR forecast over 2027-2032. Haier Smart Home's air-conditioning share in China rose in both channels in 2025, by 1.8 percentage points offline and 0.6 percentage points online. Its domestic air-conditioning revenue also grew at a double-digit rate. The larger gain came offline, so physical retail remained central to Haier's channel results even as its online share also rose.
Direct-to-consumer (DTC) fulfillment can also operate with retail dealers in the commercial model. In 2025, revenue generated for Haier Smart Home's DTC-enrolled air-conditioning dealers in China grew more than 130%. The result ties a manufacturer-led consumer program to revenue generated for downstream dealers. A DTC model can retain a commercial role for those intermediaries, so direct consumer engagement need not displace dealer participation.
Geography Analysis
Asia-Pacific Air Conditioner Market
Asia-Pacific accounted for 47.17% of the air conditioner market size in 2026. JRAIA estimated China's 2025 demand at 57.1 million nonportable residential and commercial unitary air conditioners, including cooling-and-heating heat pumps. Midea Electronics Indonesia inaugurated its air-conditioner and refrigerator factories in Cikarang, Indonesia, on September 9, 2026. China's annual equipment requirement makes production scale a central consideration for manufacturers seeking to serve a large, identifiable national demand base. The region's supply opportunity includes an Indonesian manufacturing position alongside China's demand anchor, allowing market access and production participation to be pursued in different national markets.
Middle East & Africa Air Conditioner Market
The Middle East and Africa region is forecast to grow fastest, at 7.25% CAGR over 2027-2032. In September 2026, Haier Egypt's complex in 10th of Ramadan City produced household air conditioners with a 65% local-component ratio and had annual capacity above 1 million electrical appliances across product categories. JRAIA estimated 2025 demand for nonportable residential and commercial unitary air conditioners at 5,581 thousand units in the Middle East and 3,993 thousand in Africa, with year-on-year indices of 108% and 105%, respectively. Rising unit demand in both subregions gives locally sourced household equipment a demand setting alongside Haier Egypt's existing production capability.
In North America, AHRI reported that participating manufacturers' US central air-conditioner shipments decreased 26.2% to 4,104,933 units in 2025, from 5,559,766 in 2024. In Europe, the European Commission describes space-cooling equipment as relatively uncommon in the EU compared with the United States, Japan and South Korea, while noting growth in offices and homes. In South America, Brazil produced 6.385 million split air conditioners in 2025, up from 3.816 million in 2023, according to ABRAVA. The US shipment decline and Brazil's higher output indicate different conditions for equipment producers in those national markets. EU adoption in offices and homes offers a demand opening distinct from Brazil's expanding manufacturing base.
Regulatory Framework and Outlook
The table compares selected jurisdictions from the perspective of manufacturers placing complete air-conditioning equipment on the market. Product scope matters because room-unit efficiency rules and commercial-package standards apply to different equipment categories. Medium ratings reflect defined compliance routes, while Low indicates a nearer adjustment across product classes, and future direction distinguishes technical tightening from reviews or staged sales transitions. The US Medium rating pairs planning time with tighter commercial-package standards above ASHRAE 90.1, requiring compliance from January 1, 2029.
Regulatory Table of Air Conditioner Market
| Decision factor | United States | China | Germany | Brazil | Saudi Arabia |
|---|---|---|---|---|---|
| Primary authority | US Department of Energy | State Administration for Market Regulation | European Commission, EU framework | Inmetro | SASO |
| Key instruments or direction | 2024 commercial-package rule, compliance from January 1, 2029 | GB 21455-2019 room-AC efficiency grading | Regulations (EU) 206/2012 and 626/2011 | Portaria 550/2026 supplier declaration | SASO 2874:2025 and SASO 2663:2025 |
| Commercial effect | Design compliance for air-cooled commercial-package ACs and heat pumps rated at least 65,000 Btu/h | Minimum energy-efficiency values and grades for room units | Suppliers provide labels; dealers display them | Manufacturer/importer sales transition through December 31, 2026; retail transition through December 31, 2027 | Enforcement at local manufacturers and customs from December 1, 2026 |
| Current policy attractiveness | Medium | Medium | Medium | Medium | Low |
| Future direction of policy attractiveness | Hardening | No change | No change | No change | Hardening |
| Source: Mordor Intelligence | |||||
China's draft revision of GB 21455 had comments due July 12, 2026, and remains in consultation, so operative GB 21455-2019 supports Medium attractiveness and No change. Germany's Medium rating reflects defined EU ecodesign and labeling duties under Regulations 206/2012 and 626/2011, with No change because the Commission's 2026 label review is in preparation. Brazil's Medium rating reflects its supplier-declaration route, with No change reflecting continuity of that conformity model through the December 31, 2026 manufacturer/importer sales and December 31, 2027 retail deadlines. Saudi Arabia's Low rating and Hardening reflect updated requirements across large-capacity and low-capacity window/single-split equipment, including added large-capacity rating metrics, with enforcement scheduled at local manufacturers and customs from December 1, 2026.
Value Chain Stages
The value chain compares how component production, equipment supply and downstream technical work contribute to delivery of an operable cooling system. Daikin's worldwide manufacturing footprint and Beijer Ref's multi-region wholesale operations illustrate different forms of supply reach. Local installation and service providers such as Ultra Services, Inc. in Boston and New England connect equipment availability with site-level technical execution.
Value Chain Analysis Table of Air Conditioner Market
| Primary activity | Key participants | Value capture | Bottleneck | Resilience response |
|---|---|---|---|---|
| Component production | Component manufacturers such as BITZER Kühlmaschinenbau GmbH | Compressor, component and control sales | Component qualification within equipment designs | Qualify alternatives during equipment development |
| Equipment manufacturing | Air-conditioning manufacturers such as Daikin Industries | Complete-unit sales | Exposure to production-site interruptions | Maintain alternative production capability |
| Wholesale distribution | Equipment wholesalers such as Beijer Ref and Watsco | Equipment resale earnings | Matching wholesale supply to local demand | Coordinate regional purchasing and distribution |
| Installation and service | Commercial HVAC installers and service providers such as Ultra Services, Inc. | Installation and service fees | Site-specific installation capability | Train teams for equipment and installation requirements |
| Aftermarket parts supply | Air-conditioning parts distributors such as Watsco | Parts sales | Parts availability for the installed product mix | Connect parts supply to dealer service needs |
| Source: Mordor Intelligence | ||||
LG Electronics reported in July 2026 that approximately 70 HVAC Academies in more than 40 countries trained customers, distributors and professionals in installation, maintenance, design and servicing. This places technical capability alongside equipment availability in the commercial delivery model. The training addresses the transition from supplying a unit to putting it into dependable operation. An equipment maker can support installation skills while local contractors earn the site-level fees, making downstream capability relevant to the manufacturer's equipment proposition.
Competitive Landscape
Market Concentration
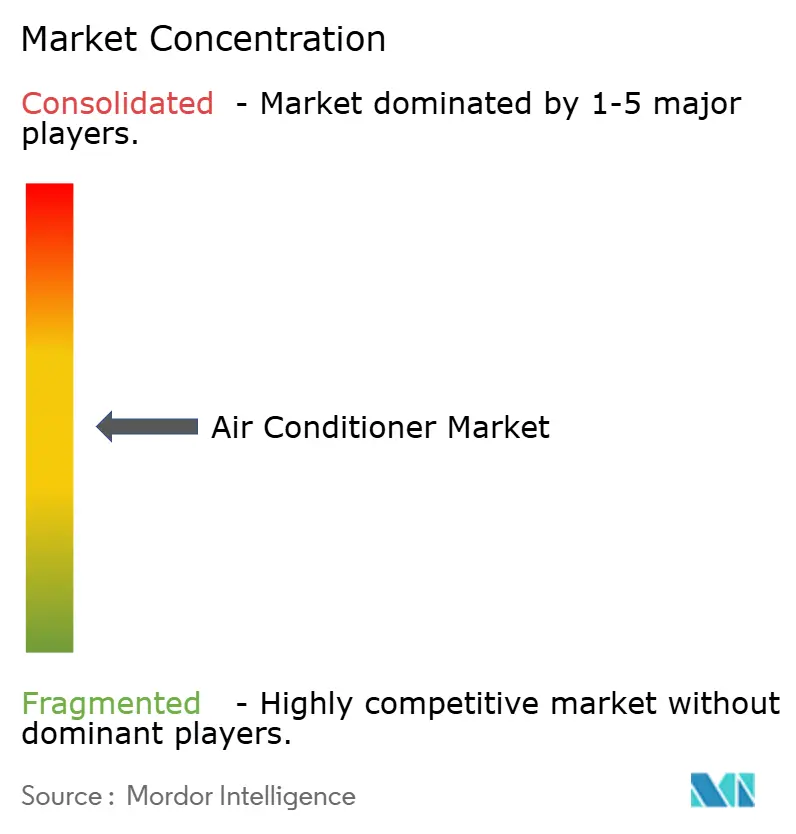
Competition is moderately concentrated around multinational equipment manufacturers, led by Haier Smart Home, Daikin Industries, Gree Electric Appliances, Midea Group and Carrier Global. Haier reported 14.8% global air-conditioning volume growth during the year ended December 31, 2025, demonstrating expansion in its equipment business. Daikin sells air-conditioning products worldwide and operates more than 130 production bases globally. Carrier supplies commercial HVAC and aftermarket services, so its business spans equipment and ongoing support.
Commercial suppliers can compete through the installed equipment base as well as the next unit order. Carrier Global reported double-digit growth in global commercial HVAC and aftermarket in 2025, excluding NORESCO. Aftermarket activity gives a supplier a customer relationship that can continue after equipment delivery, without requiring a new complete-unit purchase each time. A manufacturer seeking to replicate that coverage would need to support delivered equipment as well as supply new units.
Standards participation creates another dimension of competition by connecting equipment design with expectations for safe use over time. During its 2025 reporting period, Gree Electric Appliances led drafting China's first national standard on air-conditioner safe service life, GB/T 46738-2025. That action gives it a documented role in defining an issue that affects the installed product after the initial purchase. Clear service-life information can make a replacement decision more specific than a general claim that newer equipment is better. Midea Group reported 12.1% growth in total revenue in 2025, and Daikin's air-conditioning and refrigeration equipment segment sales rose 5.4% in the year ended March 31, 2026.
Air Conditioner Industry Leaders
-
Haier Smart Home
-
Daikin Industries
-
Gree Electric Appliances
-
Midea Group
-
Carrier Global
- *Disclaimer: Major Players sorted in no particular order
Air Conditioner Market Companies Covered in this Report
- Daikin Industries
- Gree Electric Appliances
- Midea Group
- Carrier Global
- Haier Smart Home
- LG Electronics
- Mitsubishi Electric
- Panasonic HVAC & CC Co., Ltd.
- Bosch Home Comfort Group
- Samsung Electronics
- Trane Technologies
- Lennox International
- Whirlpool Corporation
- BITZER Kühlmaschinenbau GmbH
- GENERAL Inc.
- Electrolux AB
- Rheem Manufacturing Company
- Qingdao Hisense HVAC equipment Co., Ltd.
- Voltas Limited
- Blue Star Limited
Key Opportunities for Market Participants
This comparison sets two open institutional supply-and-installation tenders beside the replacement need documented in India's installed stock. India's 2025 room-AC stocktake examined efficiency loss in aging units and the policy case for replacement, giving efficiency upgrades a rationale beyond individual tenders. The Cultural Center of the Philippines sought 24 inverter split units and one inverter window unit for its Pasay City Administration and Finance Building, with rebids due October 27, 2026. Jamaica's Accountant General's Department opened a national supply-and-installation competition on October 7, 2026, with bids due October 30, 2026.
Market Opportunities Table of Air Conditioner Market
| Opportunity | Why now | Buyer / lead segment | Recommended play | Main barrier | Likely beneficiaries |
|---|---|---|---|---|---|
| Institutional inverter split packages | Open procurement for multi-unit inverter supply | Philippine public administration buildings | Coordinate equipment supply, delivery and installation | Execution across specified capacities | Inverter split-system manufacturers and installation partners |
| Specialist inverter window supply | Window equipment is specified within a mixed-format bid | Institutional window-format cooling | Supply the window requirement through a package bidder | Single-unit requirement within a larger package | Window-unit manufacturers and specialist distributors |
| Turnkey institutional cooling | Open national supply-and-installation competition | Jamaican public-sector offices | Pair the equipment offer with local installation execution | Delivering equipment and installation together | Equipment distributors and installation firms |
| Source: Mordor Intelligence | |||||
Coordinated supply and installation is the opening in the institutional tenders, while India's aging installed stock presents a separate replacement opportunity. In July 2025, Blue Star Managing Director B. Thiagarajan described consumers moving old air conditioners to another room or selling them to shops for reuse, a barrier that replacement offers with unit collection could address. For institutional orders, mixed equipment and installation requirements make a package partner necessary when a supplier lacks the full delivery capability.
Recent Industry Developments in Air Conditioner Market
- Sep 2026: Midea Electronics Indonesia inaugurated its air-conditioner and refrigerator factories in Cikarang, Indonesia. At the event, Indonesia's deputy minister of industry reported cumulative production of 2.25 million air-conditioner units.
- Mar 2026: EPACK Durable's wholly owned subsidiary, EPACK Manufacturing Technologies Private Limited, began mass-producing split room air conditioners for anchor customer Hisense in Sri City, India, with installed capacity of 0.75 million sets per year.
- Dec 2025: Daikin Australia opened Factory 2 in Chipping Norton, New South Wales, to produce air-handling units and rooftop packaged air conditioners.
Air Conditioner Market Report Scope and Research Methodology
Market Definition and Coverage
The air conditioner market measures annual global manufacturer revenue from air conditioning equipment sold for residential and commercial space cooling. Each unit is counted once at its first manufacturer sale and classified by installation, product type, end user, technology, rated capacity, sales channel and region.
Scope exclusions: Refrigeration equipment, large centralized building chiller systems, standalone ventilation-only equipment, evaporative room coolers, and separately sold installation, maintenance, repair services and replacement parts are excluded.
Segments Covered in This Report
-
By Installation Type
- Installed/Fixed
- Non-Installed/Portable
-
By Product Type
- Window Air Conditioner (AC)
- Split Air Conditioner (AC)
- Portable Air Conditioner (AC)
- Cassette Air Conditioner (AC)
- Packaged & Rooftop Air Conditioner (AC)
-
By End-User
- Residential
- Commercial
-
By Technology
- Inverter
- Non-Inverter
-
By Capacity
- <3 kW
- 3-7 kW
- >7 kW
-
By Distribution Channel
- B2B/Direct from the Manufacturers
-
B2C/Retail Consumers
- Multi-Brand Stores
- Exclusive Brand Stores (EBOs)
- Online
- Other Distribution Channels
-
By Geography
-
North America
- United States
- Canada
- Mexico
-
South America
- Brazil
- Peru
- Chile
- Argentina
- Rest of South America
-
Europe
- United Kingdom
- Germany
- France
- Spain
- Italy
- BENELUX
- NORDICS
- Rest of Europe
-
Asia-Pacific
- China
- India
- Japan
- South Korea
- Australia
- South-East Asia
- Rest of APAC
-
Middle East & Africa
- United Arab Emirates
- Saudi Arabia
- South Africa
- Nigeria
- Rest of Middle East & Africa
-
North America
Data Sources, Market Sizing, and Validation
Desk Research
Public evidence can establish demand, product, efficiency and climate context through sources such as the Japan Refrigeration and Air Conditioning Industry Association's annual global unitary-air-conditioner demand tables, the Alliance for an Energy Efficient Economy's India room-air-conditioner stocktake, China's National Bureau of Statistics household income series, the World Meteorological Organization's global climate indicators, and the U.S. Department of Energy's room-air-conditioner standards. These sources help analysts check shipments and product mix, household purchasing conditions, heat exposure and regulatory requirements against the revenue model.
Company annual filings, investor presentations and reputable trade or financial reporting can add production, sales-channel and price context, while national statistical releases and customs data can cross-check market signals where definitions align. These named sources are illustrative and not exhaustive, and further sources inform collection, validation and clarification.
Primary Interviews and Surveys
Primary research would include structured interviews or surveys with air-conditioner manufacturers, component and channel executives, and residential and commercial buyers across APAC, EMEA and the Americas. Analysts would use those discussions to test secondary-source assumptions on sales value, product mix, pricing and channel routes, investigate conflicting regional signals, and triangulate unresolved gaps with filings, shipment evidence and comparable market indicators.
Distribution of primary research fieldwork respondents
| Company type | Respondent position | Region |
|---|---|---|
| Top tier: 35% | CXOs: 20% | APAC: 45% |
| Mid tier: 45% | Functional/Unit leaders: 35% | EMEA: 30% |
| Smaller Players: 20% | Managers: 45% | Americas: 25% |
Market-Sizing & Forecasting
A top-down estimate begins with global or regional air-conditioner sales revenue and narrows it to complete residential and commercial units sold at the manufacturer's first-sale point, with selective checks against supplier production, channel evidence and sampled average selling prices multiplied by unit volumes. Its indicators include annual AC shipments and production to indicate unit demand, household income and housing formation to support residential adoption, commercial construction and floor space to inform business demand, heat exposure to indicate cooling need, and equipment prices, inverter mix and efficiency rules to assess value and replacement choices.
Historical revenue and unit signals are reconciled by region and by the accepted installation, product, end-user, technology, capacity and channel groups. Segment shares follow observed shipments, product mix, sales values and regional market disclosures. A multivariate regression can relate historical revenue and volume to these demand and price indicators, with scenario analysis for changes in heat, construction or regulation. Analysts would compare regional and segment forecasts with expert explanations of replacement cycles, pricing and channel inventories, then investigate gaps by checking source coverage, units, timing and product classifications before using the best supported series.
Data Validation & Update Cycle
Analysts triangulate market revenue against independent shipment, production, import, company sales and price signals, checking that each covers the same products, geography and transaction stage. They investigate outliers and source variances, document their resolution through a multi-step analyst review, and re-contact relevant respondents when a material contradiction, definition change or missing input could alter the estimate. The model is refreshed annually, revisited between cycles after material market or regulatory events, and given a fresh source and calculation review before delivery.
Mordor Intelligence's Air Conditioner Market Size Measured Against Other Published Estimates
Published estimates can differ in the transactions and products they count and the inputs used to model demand. The air conditioner market measures annual global manufacturer revenue from air conditioning equipment sold for residential and commercial space cooling.
Key Gap Drivers include the study's defined coverage and market-specific modeling choices. The model's indicators include annual AC shipments and production to indicate unit demand, household income and housing formation to support residential adoption, commercial construction and floor space to inform business demand, heat exposure to indicate cooling need, and equipment prices, inverter mix and efficiency rules to assess value and replacement choices.
Benchmark comparison
| Source | Market Size | Gaps in Research Methodology |
|---|---|---|
| Mordor Intelligence | USD 183.6 B (2027) | |
| Global Consultancy A | USD 147.6 B (2025) | At its 2025 base, this estimate is 19.6% below this report's 2027 value of USD 183.6 B, 2 years later. The estimate uses a 2025 base, two years before the report's current year, so continued market expansion can contribute to a lower earlier value. |
| Global Consultancy B | USD 150.9 B (2025) | At its 2025 base, this estimate is 17.8% below this report's 2027 value of USD 183.6 B, 2 years later. The estimate is a 2025 value, two years before the report's current year, so continued market expansion can contribute to a lower earlier value. |
Mordor Intelligence's analysts triangulate market revenue against independent shipment, production, import, company sales and price signals, checking that each covers the same products, geography and transaction stage.
Key Questions Answered in the Report
What is the air conditioner market size and growth outlook?
The size is USD 183.6 billion in 2027 and is forecast to reach USD 251.8 billion by 2032, at 6.52% CAGR over 2027-2032.
What supports household demand for air-conditioning equipment?
Rising purchasing capacity supports adoption and upgrades. China's nationwide per-capita disposable income rose 5% in 2025 in both nominal and real terms.
Which air-conditioner product format has the largest share?
Split air conditioners led with a 68.92% revenue share in 2026. Portable units are forecast to grow fastest at 7.3% CAGR over 2027-2032.
Who are the leading air-conditioning equipment suppliers?
The leading suppliers include Haier Smart Home, Daikin Industries, Gree Electric Appliances, Midea Group and Carrier Global.
Why does upfront cost constrain entry-level air-conditioner adoption in India?
India's 2025 price snapshot put AC acquisition costs at 10% to 30% of 2019 median annual household income, versus 0.5% to 8% for evaporative coolers.
Which region leads air-conditioner sales revenue, and which grows fastest?
Asia-Pacific held 47.17% of revenue in 2026. The Middle East and Africa region is forecast to grow fastest at 7.25% CAGR over 2027-2032.