AIOps Market Size and Share
Market Overview
| Study Period | 2020 - 2031 |
|---|---|
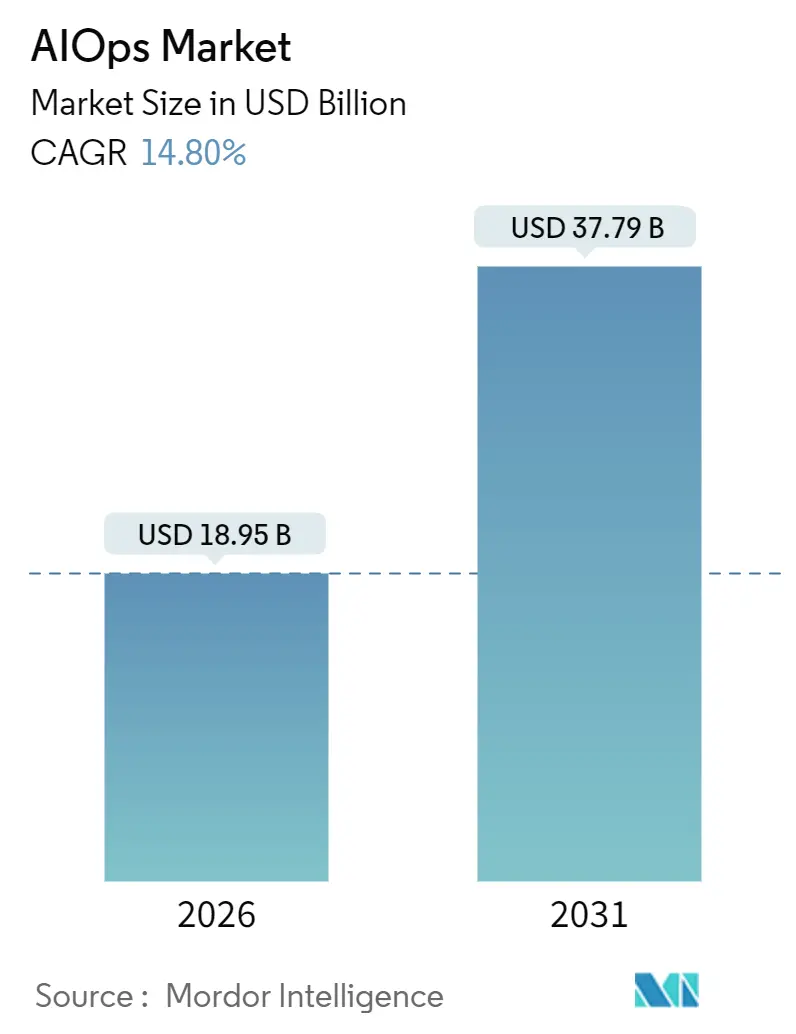
| Market Size (2026) | USD 18.95 Billion |
| Market Size (2031) | USD 37.79 Billion |
| Growth Rate (2026 - 2031) | 14.80% CAGR |
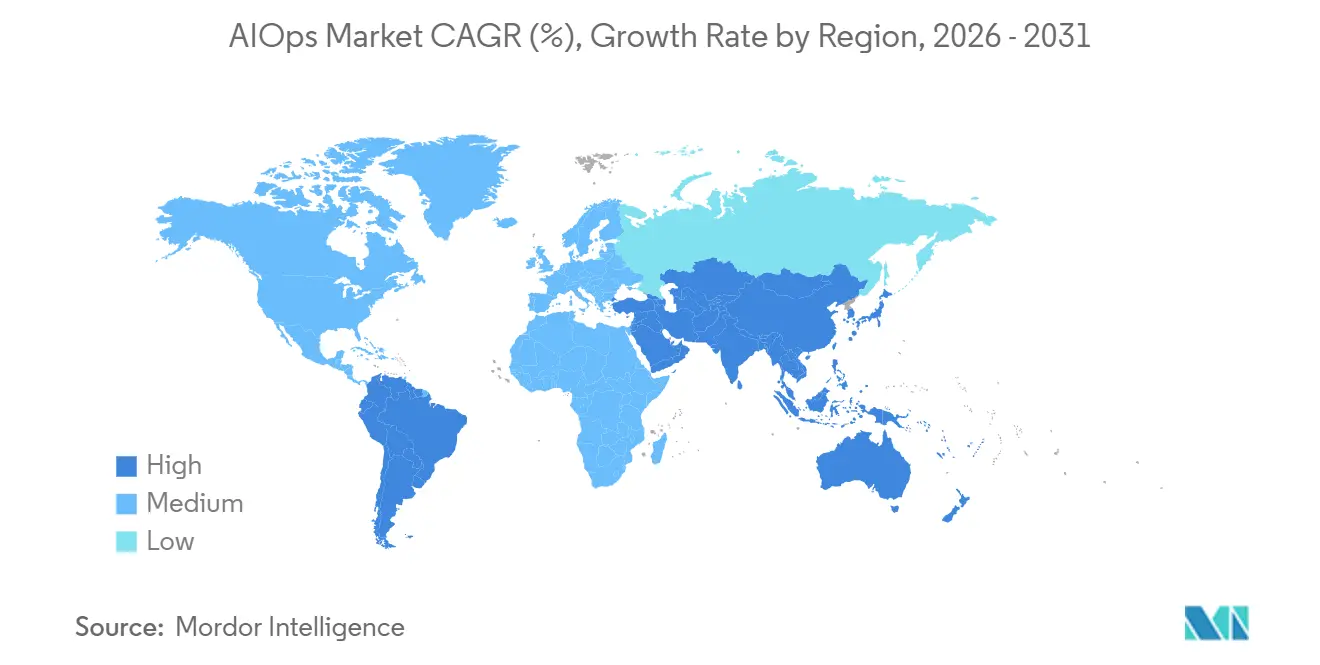
| Fastest Growing Market | Asia-Pacific |
| Largest Market | North America |
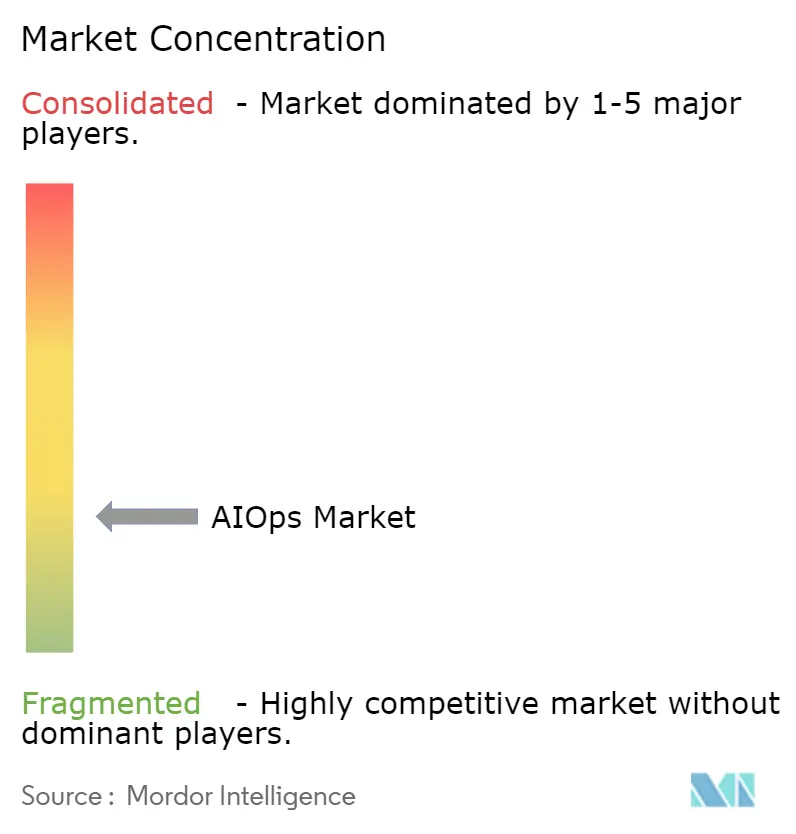
| Market Concentration | Low |
Major Players *Disclaimer: Major Players sorted in no particular order Image © Mordor Intelligence. Reuse requires attribution under CC BY 4.0. | |
AIOps Market Analysis by Mordor Intelligence
The AIOps market size stands at USD 18.95 billion in 2026 and is projected to reach USD 37.79 billion by 2031, reflecting a 14.8% CAGR. Rapid substitution of manual incident triage with machine-learning correlation engines is shortening mean time to resolution by as much as 60%, particularly across hybrid infrastructures where alert volumes have multiplied. Platform vendors currently dominate spending, yet rising integration complexity is steering future growth toward services that help customers operationalize algorithms. Cloud-first pricing models are lowering entry barriers for small and medium enterprises, while regulated industries continue to run mission-critical workloads on-premise to satisfy data-sovereignty mandates. Consolidation among platform providers and the arrival of generative AI copilots are reshaping competitive dynamics in the AIOps market.
Key Report Takeaways
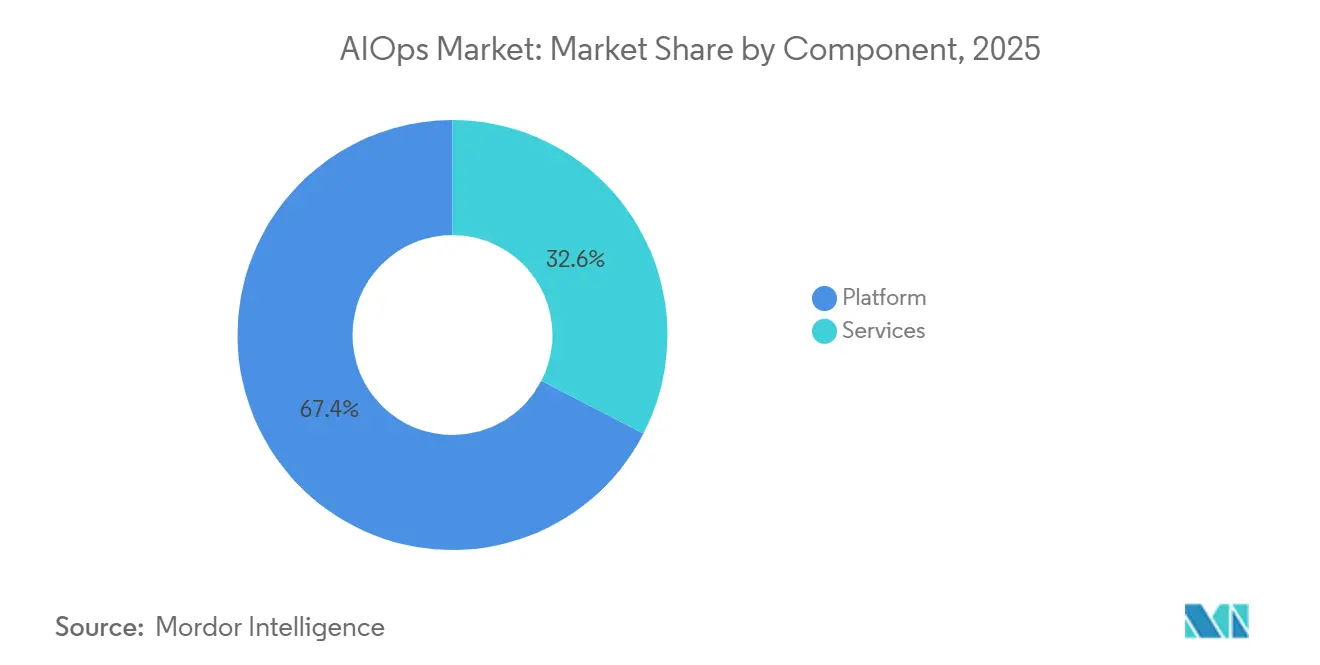
- By component, platform subscriptions led with 67.42% revenue in 2025, while services are forecast to deliver the fastest 16.04% CAGR through 2031.
- By deployment mode, on-premise installations held 56.66% share of spending in 2025, whereas cloud implementations are set to expand at a 15.66% CAGR to 2031.
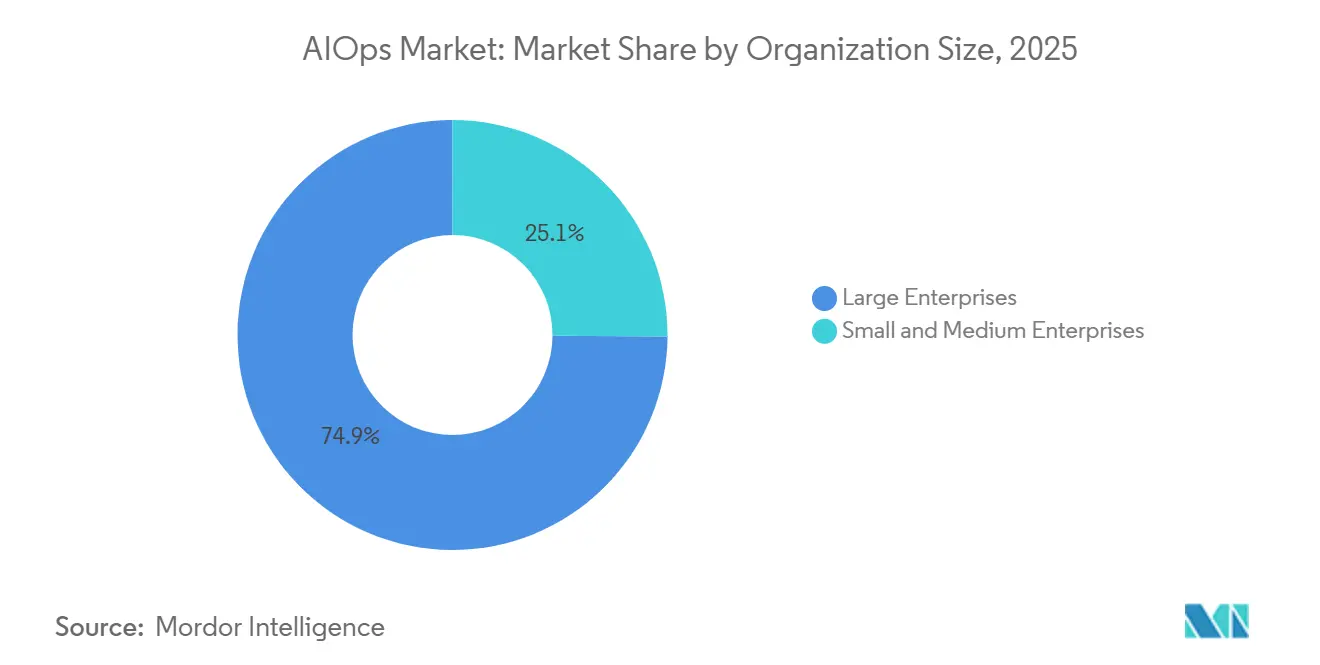
- By organization size, large enterprises commanded 74.89% purchasing power in 2025, yet small and medium enterprises represent the fastest-growing cohort at 15.44% CAGR.
- By end-user industry, IT and telecom captured 32.28% of 2025 demand, while healthcare is projected to advance at a 16.66% CAGR to 2031.
- By geography, North America accounted for 42.54% of 2025 revenue, but Asia Pacific is on track for the quickest 16.22% CAGR over the forecast horizon.
Note: Market size and forecast figures in this report are generated using Mordor Intelligence’s proprietary estimation framework, updated with the latest available data and insights as of January 2026.
Global AIOps Market Trends and Insights
Drivers Impact Analysis*
| Driver | (~) % Impact on CAGR Forecast | Geographic Relevance | Impact Timeline |
|---|---|---|---|
| AI-Driven Observability Demand Surge | +3.2% | Global, with concentration in North America and Europe | Medium term (2-4 years) |
| Shift to Hybrid and Multi-Cloud Architectures | +2.8% | Global, particularly North America, Europe, and Asia Pacific | Long term (≥ 4 years) |
| Need for Faster MTTR and SRE Adoption | +2.4% | Global, led by IT and Telecom, BFSI sectors | Short term (≤ 2 years) |
| Gen-AI Copilots for Ops Automation | +2.1% | North America and Europe early adoption, Asia Pacific following | Medium term (2-4 years) |
| FPGA and DPU Acceleration at the Edge | +1.3% | Manufacturing hubs in Asia Pacific, industrial sectors in Europe and North America | Long term (≥ 4 years) |
| Rise of ESG-Linked "Green Ops" Compliance | +0.9% | Europe primary, North America secondary, expanding to Asia Pacific | Long term (≥ 4 years) |
| Source: Mordor Intelligence | |||


AI-Driven Observability Demand Surge
Enterprises moved from 42% to 54% adoption of AI-powered monitoring between 2024 and 2025 as microservices generated tenfold more telemetry than monolithic stacks. Traditional rule-based alerts could not cope, producing storms that desensitized on-call teams. Machine-learning baselines now filter infrastructure noise and surface user-impacting incidents, shrinking triage queues. Datadog’s LLM Observability, introduced in 2025, tracks token consumption and latency in generative AI workloads, a blind spot as customer-facing applications embed large language models. Finance leaders have doubled monitoring budgets because a single hour of downtime costs USD 2 million in lost transactions and compliance penalties. The magnitude of these losses explains why the AIOps market continues to accelerate.
Shift to Hybrid and Multi-Cloud Architectures
Hybrid and multi-cloud workloads climbed to 87% in 2025, up from 76% in 2023, as firms diversify suppliers and comply with data-residency rules.[1]Flexera, “2025 State of the Cloud Report,” flexera.com Every hyperscaler exposes a different telemetry model - AWS CloudWatch, Azure Monitor and Google Cloud Operations - forcing teams to normalize data before correlation. OpenTelemetry adoption reached 64% of cloud-native projects, but legacy systems still emit syslog and SNMP, prompting gateway translation. Cisco’s post-acquisition fusion of AppDynamics and Splunk created a single pane for on-premise and cloud visibility.[2]Cisco, “Cisco Observability Suite,” cisco.com Sovereign-cloud regulations in the European Union and India require region-locked AIOps instances, fragmenting oversight while driving demand for federated analytics.
Need for Faster MTTR and SRE Adoption
Site reliability engineering practices were observed at 48% of enterprises in 2025, compared with 34% in 2023, as organizations formalized error budgets and service-level objectives. Dynatrace customers reduced mean time to resolution by 60% through distributed-trace analytics that map anomalies to user sessions. PagerDuty’s generative AI escalates incidents using historical patterns and responder availability, eliminating lengthy manual routing. Minutes of downtime during Black Friday can erase an entire day’s margin. The European Union’s Digital Operational Resilience Act obliges banks to restore critical services within two hours, converting MTTR metrics into compliance mandates.
Gen-AI Copilots for Ops Automation
Generative AI copilots entered production at 38% of enterprises in 2025, automating runbook execution and incident summaries. Azure Copilot translates natural-language prompts into Kusto queries, lowering the knowledge bar for junior engineers. Splunk’s AI Assistant drafts search queries and correlation rules by mining past tickets. Despite enthusiasm, 68% of site reliability engineers say the scripts still need review because model training lacks context for proprietary middleware. Cisco’s conversational assistant now spans AppDynamics and ThousandEyes, blending application and network intelligence. Early adopters see productivity gains, yet unchecked copilots risk propagating errors at machine speed.
Restraints Impact Analysis*
| Restraint | (~) % Impact on CAGR Forecast | Geographic Relevance | Impact Timeline |
|---|---|---|---|
| Tool Sprawl and ROI Uncertainty | -1.8% | Global, acute in North America and Europe | Short term (≤ 2 years) |
| Shortage of AIOps-Savvy Talent | -1.5% | Global, particularly acute in Asia Pacific and emerging markets | Medium term (2-4 years) |
| Data-Sovereignty and AI-Governance Hurdles | -1.1% | Europe, Asia Pacific, Middle East with strict data localization | Long term (≥ 4 years) |
| Vendor Black-Box Algorithms and Lock-In Risk | -0.8% | Global, especially impacting large enterprises | Medium term (2-4 years) |
| Source: Mordor Intelligence | |||
Tool Sprawl and ROI Uncertainty
Most enterprises still juggle multiple monitoring tools, fragmenting telemetry and inflating licensing overhead. Consolidation efforts intensified in 2025, yet integration complexity can postpone payback beyond eighteen months. Only a small subset of organizations achieved triple-digit return on investment inside the first year, while a quarter reported negative returns due to underused features. Overlaps among application, log and network monitoring create redundant alerts that drown operators in noise. Small and medium enterprises face sharper friction because many AIOps platforms assume 24/7 site reliability teams that these firms do not staff. Managed service providers help close gaps but often add margin, diluting ROI.
Shortage of AIOps-Savvy Talent
The cybersecurity and IT operations workforce gap reached 3.5 million positions in 2025.[3]ISC2, “2025 Cybersecurity Workforce Study,” isc2.org Only 12% of practitioners hold credentials in machine-learning model governance, and universities have yet to scale relevant curricula. Hybrid skill sets combining infrastructure fluency, statistical modeling and software development remain rare. Regional shortages are most pronounced in Asia Pacific, where digital transformation outpaces talent pipelines. Enterprises respond by hiring consultants at premium rates or by sending staff to vendor academies such as Dynatrace University, yet 58% of firms say new certificate holders still require six months of mentoring before they can manage platforms independently.
*Our forecasts treat driver/restraint impacts as directional, not additive. The impact forecasts reflect baseline growth, mix effects, and variable interactions.
Segment Analysis
By Component: Services Gain Ground as Integration Demands Deepen
Platform subscriptions captured 67.42% of 2025 spending, the largest slice of the AIOps market share for that year. The services segment, however, is projected to grow at a 16.04% CAGR to 2031 as organizations rely on external expertise to connect heterogeneous data feeds, tune baselines and automate remediation. This drift toward services underscores how black-box algorithms need context-specific calibration before they deliver value.
Professional services firms are embedding site reliability engineers inside client teams to accelerate adoption, while managed service providers offer follow-the-sun incident response priced on retainer. Vendor certification programs have become a parallel revenue stream and a way to expand the talent pool. Platform development is turning toward generative AI interfaces and edge inference, with DPUs and FPGAs driving sub-millisecond anomaly detection in industrial IoT environments. Environmental, social and governance metrics are also being woven into dashboards so that operational and sustainability priorities appear side by side.

By Deployment Mode: Cloud Momentum Builds Despite On-Premise Stronghold
On-premise implementations represented 56.66% of installed environments in 2025 as banks, hospitals and government agencies guarded sensitive telemetry within their own data centers. Cloud deployments are forecast to expand at a 15.66% CAGR through 2031 as hyperscalers embed native AIOps and offer sovereign regions that satisfy residency laws. The gradual shift is notable because cloud subscriptions eliminate capital outlays and scale elastically with workload growth, aligning cost with usage.
Hybrid architectures are emerging as a pragmatic compromise, retaining sensitive logs on-premise while allowing less-restricted data to flow into cloud-based analytics. Cloud-native vendors such as Datadog and New Relic enjoy outsized share among digital-first companies; Datadog’s annual recurring revenue surpassed USD 2 billion in 2025. The European Union’s GDPR fines and new sovereign clouds demonstrate how regulatory frameworks directly influence deployment choices. Over a five-year horizon, operating self-hosted stacks often costs considerably more than subscription services due to patching, scaling and hardware refresh cycles.
By Organization Size: SMEs Accelerate on SaaS Accessibility
Large enterprises held 74.89% of the AIOps market in 2025, reflecting sprawling hybrid estates that generate terabytes of telemetry daily. Small and medium enterprises are expected to post a 15.44% CAGR to 2031 as consumption-based pricing and pre-configured dashboards lower adoption friction. Entry-level plans that monitor a handful of hosts for free and expand incrementally are bringing observability within reach of budget-conscious firms.
Large organizations are meanwhile trimming toolkits from six platforms to nearer four to reduce overlap and license duplication. Consolidation favors full-stack suites that bundle application, log and infrastructure insights under a single agreement. Cisco’s 2024 absorption of Splunk exemplifies this trajectory and signals a future where platform ecosystems carry more weight than point solution features. SMEs still prize simplicity over depth, opting for quick-start templates and managed services rather than heavy customization.
By End-User Industry: Healthcare Emerges as the Fastest Adopter
IT and telecom generated 32.28% of revenue in 2025 and remain the largest vertical because operators manage both their own infrastructure and that of customers. Healthcare is anticipated to grow the fastest at 16.66% CAGR to 2031, propelled by electronic health record complexity, strict audit requirements and the patient-safety implications of downtime. A single hour of EHR unavailability can delay treatments and cost hospitals hundreds of thousands of dollars.
Financial services continue to allocate premium budgets due to the existential cost of outages and the arrival of the Digital Operational Resilience Act. Retail, manufacturing and media each have workload patterns - flash sales, predictive maintenance, live streaming - that benefit from predictive analytics and automated scaling. Government agencies across several continents are embedding AIOps into modernization projects to ensure citizen portals remain available during tax and benefits windows. Collectively, these verticals demonstrate how sector-specific regulations and service-level expectations drive nuanced adoption curves within the larger AIOps market.
Geography Analysis
North America commanded 42.54% of 2025 revenue, driven by mature IT operations capabilities and early-stage adoption of generative AI copilots. Financial institutions in the United States experience median outage costs of USD 2 million per hour, a figure that reinforces investment urgency. Vendor consolidation is most visible here, where large enterprises are standardizing on full-stack suites to satisfy audit and resilience mandates.
Asia Pacific is forecast to register the fastest 16.22% CAGR to 2031 as public-sector digitization programs and data-localization laws compel multinational firms to deploy region-specific observability stacks. India’s Digital India initiative, China’s 14th Five-Year Plan and Japan’s Society 5.0 blueprint collectively pour billions into cloud infrastructure and IoT, generating new telemetry that requires automated correlation. Regional vendors such as Alibaba Cloud and Tencent Cloud embed AIOps in their services to cut reliance on Western software.
Europe remains a significant contributor, though growth is moderated by stringent privacy and AI governance regimes. The EU AI Act classifies AIOps applied to critical infrastructure as high risk, obliging transparency and human oversight. GDPR enforcement continues to impose hefty penalties when telemetry traverses borders without consent. Latin America, the Middle East and Africa are earlier in their adoption curve but are progressing through government modernization and telecom expansion projects that plant seeds for future uptake.

Competitive Landscape
The top five vendors - Dynatrace, Splunk, Datadog, IBM and ServiceNow - controlled roughly 38% of global revenue in 2025, giving the AIOps market a moderately fragmented profile. Cisco’s USD 28 billion acquisition of Splunk in 2024 and IBM’s USD 6.4 billion purchase of HashiCorp exemplify strategic moves to build full-stack portfolios that blend infrastructure-as-code, observability and security analytics into unified workflows. Hyperscalers exert competitive pressure by embedding native AIOps into their control planes, often at marginal cost, entrenching themselves among cloud-native firms.
Smaller specialists such as BigPanda and Moogsoft differentiate through advanced event correlation that cuts alert noise by up to 90%. Open-source ecosystems - Grafana, Prometheus, OpenTelemetry - continue to gain mindshare among budget-conscious teams seeking transparency and vendor agnosticism, although regulated sectors still favor commercial support contracts. Hardware makers NVIDIA and AMD extend the battlefield to the edge, embedding inference engines in DPUs and FPGAs that enable sub-millisecond detection for industrial IoT.
Competitive strategies increasingly revolve around three vectors: embedding generative AI assistants, supporting edge inference and offering clear exit paths to mitigate lock-in concerns. Vendors are launching pre-built templates for healthcare, manufacturing and finance, a move that shortens time to value and aligns with sector compliance checklists. Managed service partners add another layer of differentiation by wrapping 24/7 incident response around core platforms, a model that resonates with resource-constrained SMEs.
AIOps Industry Leaders
International Business Machines Corporation
Cisco Systems, Inc. (AppDynamics, LLC)
Splunk LLC
Dynatrace, Inc.
Broadcom Inc. (VMware, Inc.; CA, Inc.)
- *Disclaimer: Major Players sorted in no particular order

Recent Industry Developments
- October 2025: Dynatrace released Grail 2.0, a data lakehouse that unifies logs, metrics, traces and security events and introduces natural-language investigation powered by generative AI.
- September 2025: Datadog partnered with NVIDIA to optimize LLM Observability for GPU-based AI workloads, embedding token-level tracing into CUDA libraries
- August 2025: Cisco completed the integration of Splunk, bundling AppDynamics, ThousandEyes and Splunk analytics into the Cisco Observability Suite.
- July 2025: IBM invested USD 150 million to add hybrid-cloud incident management that stitches Red Hat OpenShift telemetry with mainframe monitoring.


Research Methodology Framework and Report Scope
Market Definitions and Key Coverage
Mordor Intelligence defines the AIOps market as all platform and service revenues that apply machine learning and advanced analytics to ingest, correlate, and orchestrate IT operations data across logs, metrics, traces, events, and topology in order to predict, diagnose, and resolve incidents. The study covers commercial, subscription, and consumption-based offerings deployed on-premise or in public, private, and hybrid clouds and sold to enterprises of every size.
Scope exclusion: stand-alone observability tools that lack automated root-cause analysis or response workflows sit outside this valuation.
Segmentation Overview
- By Component
- Platform
- Services
- By Deployment Mode
- On-Premise
- Cloud
- By Organization Size
- Small and Medium Enterprises
- Large Enterprises
- By End-User Industry
- IT and Telecom
- BFSI
- Healthcare
- Retail and E-Commerce
- Media and Entertainment
- Manufacturing
- Government and Public Sector
- Other End-User Industries
- By Geography
- North America
- United States
- Canada
- Mexico
- South America
- Brazil
- Argentina
- Rest of South America
- Europe
- Germany
- United Kingdom
- France
- Rest of Europe
- Asia Pacific
- China
- India
- Japan
- South Korea
- Rest of Asia Pacific
- Middle East
- Saudi Arabia
- United Arab Emirates
- Rest of Middle East
- Africa
- South Africa
- Nigeria
- Rest of Africa
- North America
Detailed Research Methodology and Data Validation
Primary Research
Interviews and structured surveys with site-reliability leaders, cloud-ops architects, and channel partners across North America, Europe, and Asia-Pacific provided current price bands, average alert volumes, and emerging use-case weightings. These discussions filled data gaps and let us challenge secondary findings before locking the final numbers.
Desk Research
Our analysts began with core public datasets such as U.S. Bureau of Labor Statistics ICT spending tables, Eurostat cloud-computing penetration surveys, and OECD telecom ICT price indices, which clarify the demand pool. These were paired with materials from industry bodies, including TM Forum, LF AI & Data, and the OpenTelemetry project, that reveal adoption benchmarks and typical integration footprints. We strengthened the evidence base through SEC 10-K filings, selected vendor investor decks, and patent abstracts on automated incident remediation accessed via Questel. Government contract portals and Volza shipment records helped triangulate regional spending on large-scale monitoring infrastructure, while Dow Jones Factiva alerts tracked vendor deal flow indicating live deployment volumes. The sources listed are illustrative, not exhaustive; many additional repositories informed data validation.
Market-Sizing & Forecasting
The model begins with a top-down reconstruction of global IT operations software expenditure, then applies AIOps-specific penetration ratios derived from primary calls and OpenTelemetry adoption metrics. Supplier roll-ups of sampled average selling price multiplied by active platform instances act as a bottom-up cross-check, and gaps are adjusted where coverage of bundled SKUs creates double counts. Key drivers, growth in observability data ingested per node, shift of workloads to hybrid cloud, median MTTR reduction targets, regional AI budget uplift, and platform price compression, feed a multivariate regression that underpins the 2025-2030 forecast. Scenario analysis around Gen-AI uptake provides the high and low cases.
Data Validation & Update Cycle
Outputs pass a three-layer review: automated anomaly scans, peer analyst audit, and research-manager sign-off. We refresh every twelve months and issue mid-cycle updates when M&A or regulatory shifts move the baseline; before each release, a fresh desk and primary sweep ensure clients receive the latest view.
Why Mordor's Aiops Platforms Baseline Earns Decision-Maker Trust
Published estimates often diverge because firms pick different inclusion rules, currency years, and refresh cadences.
Key gap drivers include whether services revenue is bundled, how freeware observability downloads are monetized, and the velocity at which Gen-AI premium tiers are layered onto existing contracts. Mordor's model reports the full commercial revenue stack yet excludes proof-of-concept pilots, and our annual refresh smooths currency swings that others freeze for multiple years.
Benchmark comparison
| Market Size | Anonymized source | Primary gap driver |
|---|---|---|
| USD 16.42 bn (2025) | Mordor Intelligence | - |
| USD 17.79 bn (2025) | Global Consultancy A | Bundles stand-alone observability tools without automated response |
| USD 11.70 bn (2023) | Industry Association B | Uses 2023 exchange rates and rolls forward with fixed CAGR, no primary validation |
| USD 5.30 bn (2024) | Trade Journal C | Excludes cloud-native subscription revenues booked as consumption services |
Taken together, the comparison shows that when scope, time base, and validation discipline vary, totals swing widely. Mordor Intelligence delivers a transparent midpoint anchored to clearly stated variables and repeatable steps, giving users a dependably balanced baseline.


Key Questions Answered in the Report
What is the current value of the AIOps market?
The AIOps market size is USD 18.95 billion in 2026 and is forecast to reach USD 37.79 billion by 2031.
Which segment is growing faster, platforms or services?
Services are expanding at a 16.04% CAGR through 2031, outpacing platform subscriptions.
Why are healthcare organizations adopting AIOps so rapidly?
Healthcare faces strict audit trails and patient-safety imperatives, driving a 16.66% CAGR for the segment through 2031.
How does tool consolidation affect AIOps ROI?
Reducing overlapping monitoring tools cuts licensing costs and alert noise, although integration complexity can delay ROI.
Which region offers the highest growth potential for AIOps vendors?
Asia Pacific is projected to record a 16.22% CAGR through 2031, the fastest regional expansion.
What impact do generative AI copilots have on incident response?
Copilots automate query writing and remediation suggestions, shortening triage times, but still require human validation for legacy and proprietary systems.
Page last updated on:


