
AI Governance Market Size and Share
Market Overview
| Study Period | 2020 - 2031 |
|---|---|
| Market Size (2026) | USD 0.44 Billion |
| Market Size (2031) | USD 1.51 Billion |
| Growth Rate (2026 - 2031) | 28.15 % |
| Fastest Growing Market | Asia Pacific |
| Largest Market | North America |
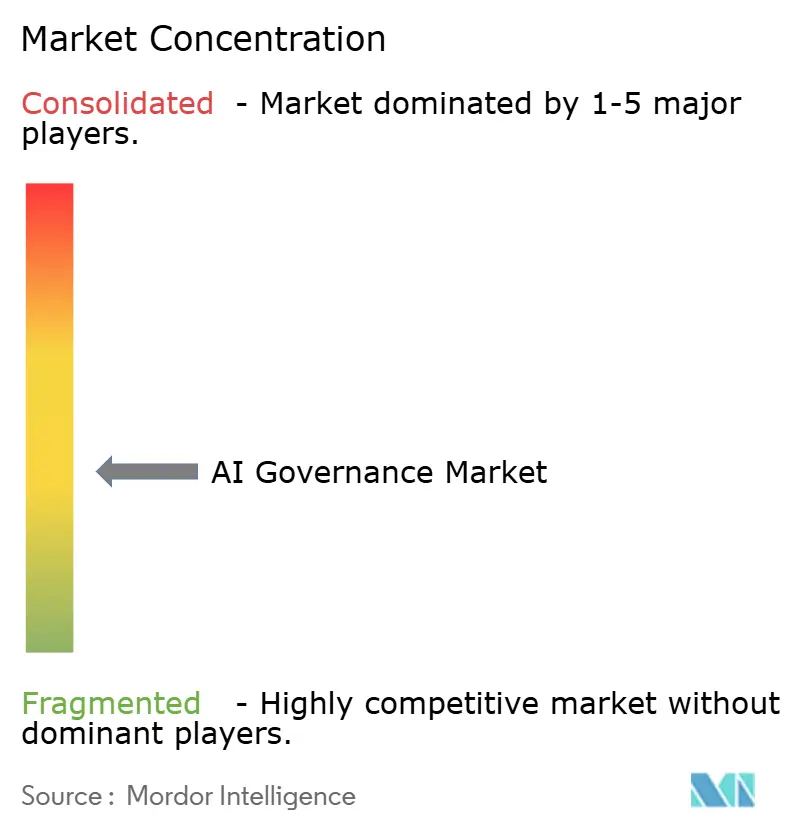
| Market Concentration | Medium |
Major Players *Disclaimer: Major Players sorted in no particular order Image © Mordor Intelligence. Reuse requires attribution under CC BY 4.0. | |
AI Governance Market Analysis by Mordor Intelligence
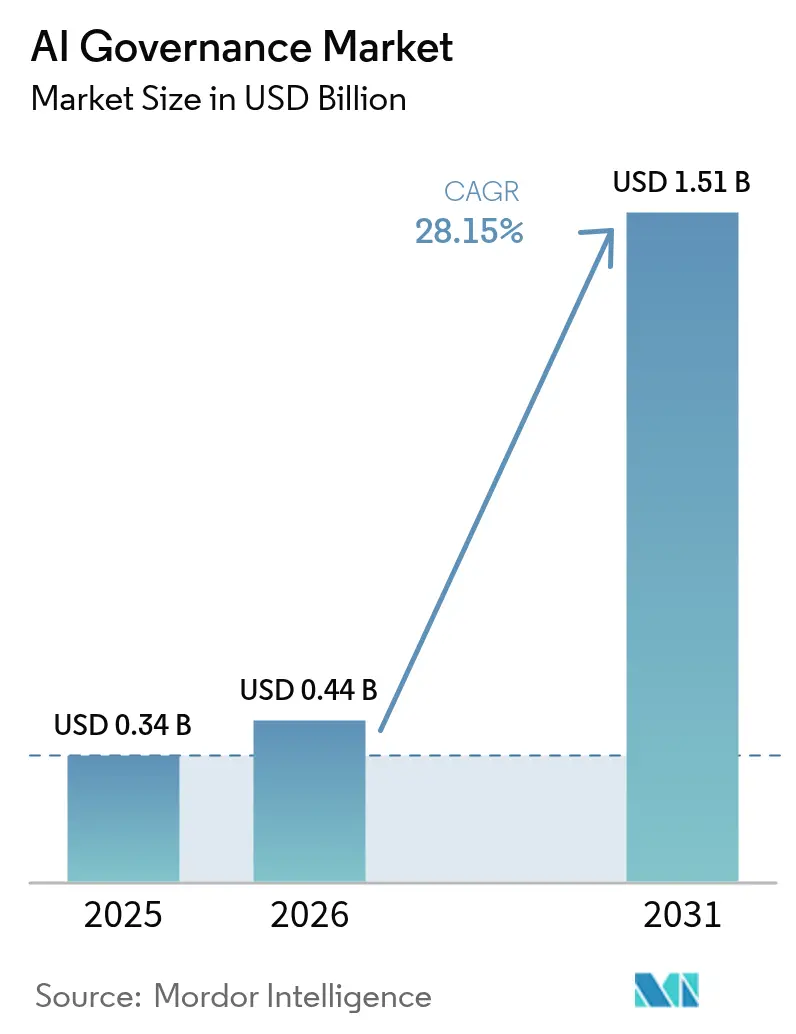
The AI Governance Market size was valued at USD 0.34 billion in 2025 and estimated to grow from USD 0.44 billion in 2026 to reach USD 1.51 billion by 2031, at a CAGR of 28.15% during the forecast period (2026-2031).
Accelerated growth reflects the urgent need for systematic oversight as generative AI adoption continues to outpace legacy risk-management frameworks. Enforcement of the EU AI Act from February 2025 has become a pivotal inflection point, mandating comprehensive governance structures for high-risk systems and threatening fines of up to EUR 35 million or 7% of global turnover for non-compliance[1]. Simultaneously, insurance carriers now link premium discounts to certified governance frameworks, pushing enterprises toward rapid adoption. Large enterprises dominate initial spending, yet cloud-native platforms are lowering entry barriers and catalysing small- and mid-size enterprise (SME) demand. Geographically, North America leads today, while Asia Pacific records the fastest future upswing as regional regulators blend innovation agendas with progressively tighter safety rules.
Key Report Takeaways
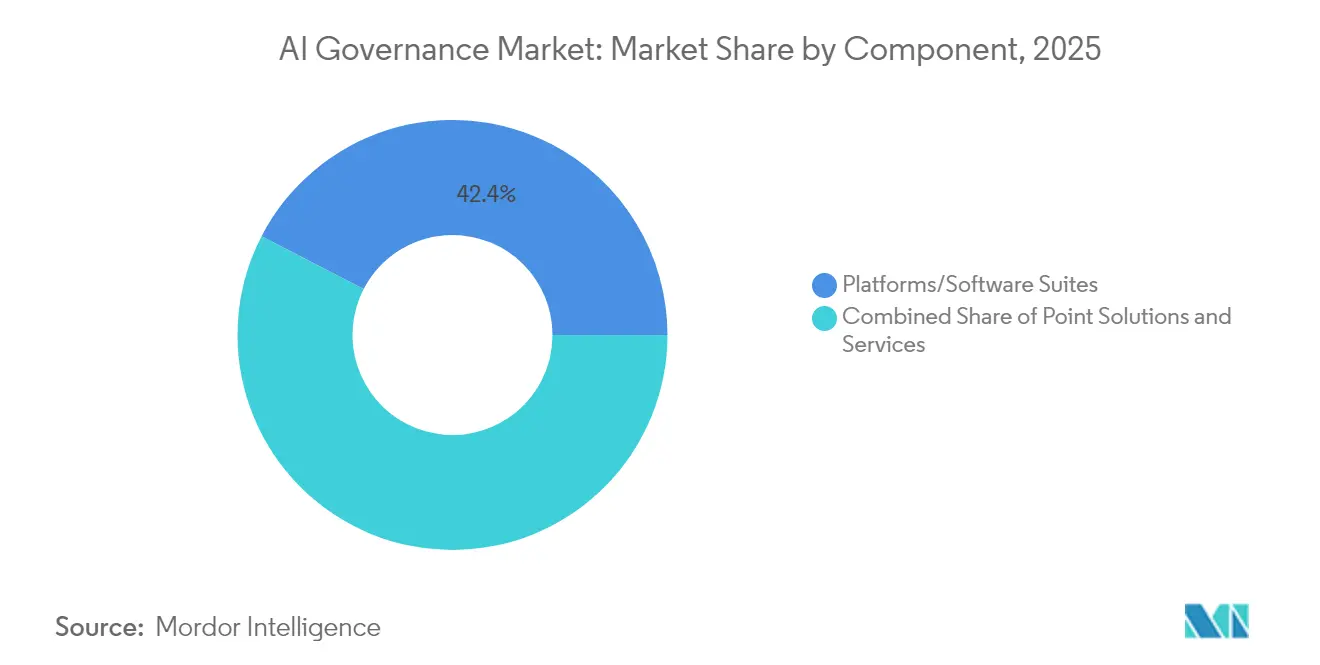
- By component, platforms and software suites held 42.40% of the AI Governance market share in 2025, whereas point solutions for bias detection and explainability are forecast to expand at a 28.6% CAGR through 2031.
- By deployment model, cloud implementations represented 77.20% of the AI Governance market size in 2025 and are projected to widen at a 29.4% CAGR to 2031.
- By end-user industry, financial services led with 25.40% revenue share in 2025; healthcare is advancing at a 28.5% CAGR through 2031.
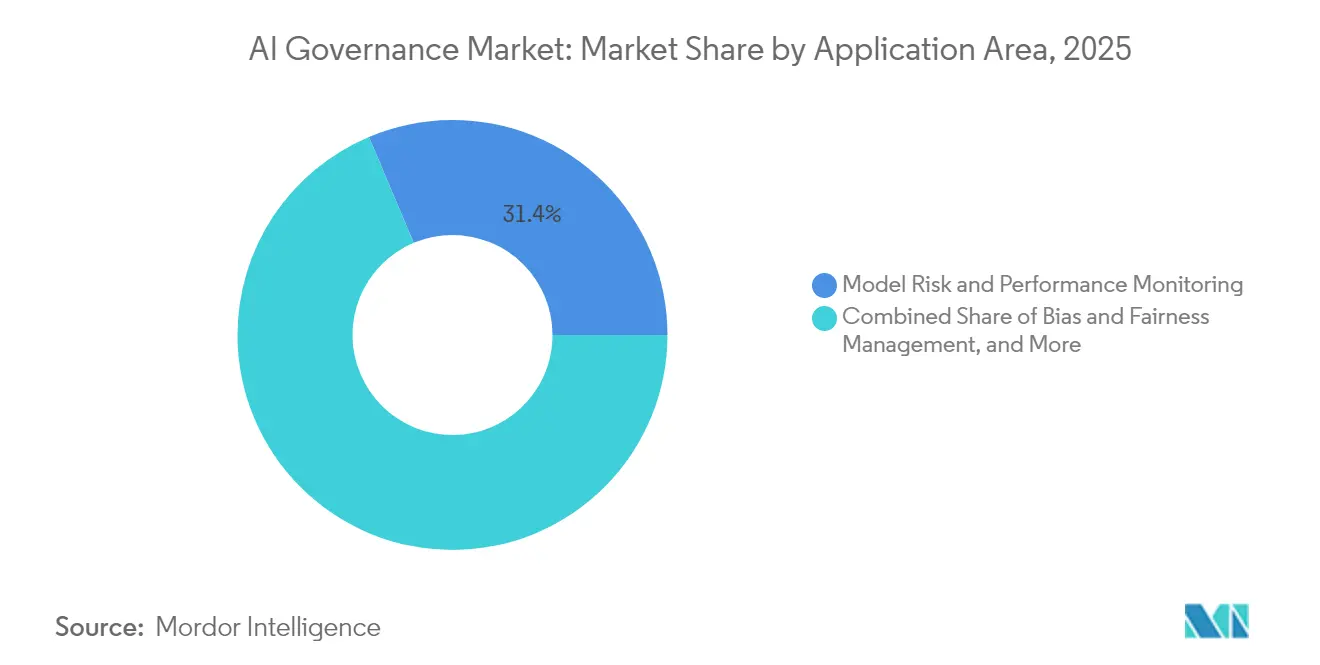
- By application area, model risk and performance monitoring captured a 31.35% share of the AI Governance market size in 2025, while bias and fairness management is growing at a 28.55% CAGR to 2031.
- By organisation size, large companies accounted for 60.20% share of the AI Governance market size in 2025; SMEs are scaling at a 29.05% CAGR to 2031.
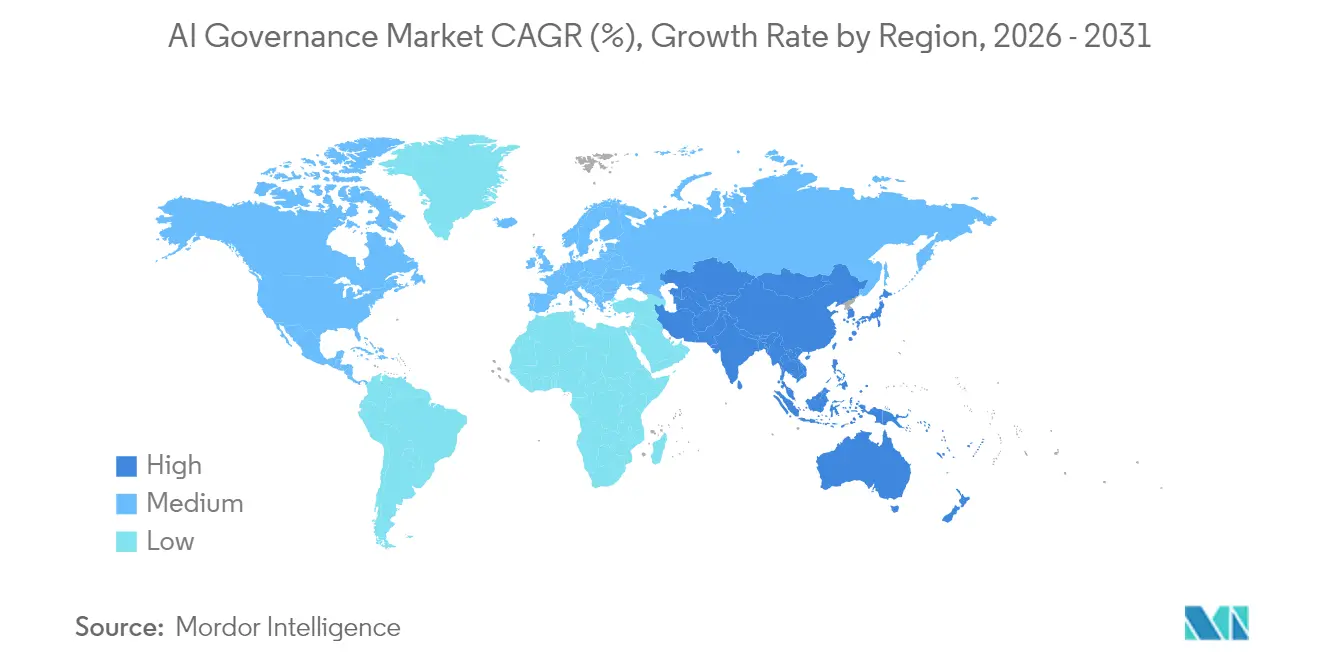
- By geography, North America maintained a 32.85% revenue share in 2025, whereas Asia Pacific is accelerating at a 34.7% CAGR through 2031.
Note: Market size and forecast figures in this report are generated using Mordor Intelligence’s proprietary estimation framework, updated with the latest available data and insights as of 2026.
Market Trends and Insights
Drivers Impact Analysis of AI Governance Market*
| Driver | (~) % Impact on CAGR Forecast | Geographic Relevance | Impact Timeline |
|---|---|---|---|
| Growing demand for model transparency and explainability | +6.2% | Global, strictest in the EU, and California | Medium term (2-4 years) |
| Rapid proliferation of AI-specific regulations | +8.1% | EU, US states, and leading APAC economies | Short term (≤ 2 years) |
| Rising enterprise reputational risk from biased AI | +4.7% | Global, especially BFSI and healthcare | Medium term (2-4 years) |
| Escalating ESG-driven investor pressure | +3.4% | North America and the EU, extending into APAC | Long term (≥ 4 years) |
| Emergence of AI-for-AI autonomous compliance agents | +3.8% | Global, pilot deployments inside large enterprises | Medium term (2-4 years) |
| Insurance carriers linking premium discounts to certified governance | +2.6% | North America and the EU insurance markets | Long term (≥ 4 years) |
| Source: Mordor Intelligence | |||
Growing Demand for Model Transparency and Explainability
Provisions in the EU AI Act now require high-risk AI systems to generate clear technical documentation, traceable audit logs, and human-readable justification for automated decisions. Financial institutions using AI for credit scoring must supply explanations that satisfy both regulators and affected consumers[2]. Enterprises increasingly view interpretability as a competitive asset that speeds internal approval cycles and bolsters customer trust. Vendors respond with platforms that auto-document model lineage and produce real-time natural-language explanations. As a result, procurement teams prioritize solutions certified for transparency, shifting budget away from opaque “black-box” algorithms toward interpretable architectures.
Rapid Proliferation of AI-Specific Regulations
Between 2024 and 2025, more than 70 new legislative or executive directives governing AI entered force worldwide. The EU AI Act sets a global reference point, while China’s generative-AI filing regime introduces a de facto license model that obliges service providers to register training data and safety controls. Jurisdictional divergences force multinational firms to maintain compliance dashboards that map model inventories to each region’s risk categories. Deadlines as short as six months for high-risk systems in the EU contrast with one-year grace periods common in Asia, rewarding companies that embed flexible governance frameworks at design time rather than retrofitting controls late in the lifecycle.
Rising Enterprise Reputational Risk from Unfair or Biased AI Outcomes
Algorithmic discrimination lawsuits have moved from theoretical to material risk. In 2024, Progressive Insurance acknowledged potential liability from AI-generated pricing discrepancies in its 10-K filing. Boards now demand bias dashboards and scenario testing before models reach production. Media coverage amplifies failures, turning single incidents into global talking points within hours. Insurance underwriters have begun offering performance-guarantee policies contingent on documented bias mitigation, further monetizing governance maturity.
Escalating ESG-Driven Investor Pressure to Disclose Algorithmic Impacts
Institutional investors now incorporate AI fairness and environmental footprint metrics into due diligence checklists. Data-center energy use at 2-3% of global emissions draws scrutiny because AI workloads intensify compute density. Roughly 15% of S&P 500 companies elevated AI oversight to board level in 2024. Adoption of the Taskforce on Nature-related Financial Disclosures framework requires businesses to quantify social and ecological outcomes of automated decisions, spurring demand for governance software that auto-generates ESG-conforming impact statements.
Restraints Impact Analysis of AI Governance Market*
| Restraint | (~) % Impact on CAGR Forecast | Geographic Relevance | Impact Timeline |
|---|---|---|---|
| Shortage of AI ethics and compliance talent | −4.9% | Global, acutest in North America and the EU | Short term (≤ 2 years) |
| High integration complexity with legacy MLOps stacks | −3.2% | Global, large enterprises with entrenched infrastructure | Medium term (2-4 years) |
| Fragmented global regulatory definitions | −2.8% | Multinationals operating in BFSI and healthcare | Medium term (2-4 years) |
| Shadow-AI deployments outside formal oversight | −2.1% | Global; intensified by remote and citizen-developer environments | Short term (≤ 2 years) |
| Source: Mordor Intelligence | |||
Widespread Shortage of AI Ethics and Compliance Talent
Demand for multidisciplinary professionals who understand data science, law, and risk oversight far exceeds supply. A 2024 workforce survey found that 65% of organizations believe additional regulation is needed to ensure safe use of generative AI, yet few possess enough internal expertise to comply[3]. European companies urgently recruit AI ethics specialists to satisfy the EU AI Act mandates. High salaries and consulting fees inflate compliance budgets, motivating investment in automation that embeds policy checks into development pipelines.
High Integration Complexity with Legacy MLOps Stacks
Legacy model-ops environments lack built-in control points for versioning, lineage, and audit logging. In a 2024 industry poll, 58% of respondents identified fragmented tooling as the chief governance hurdle. Retrofitting oversight into sprawling data-science workflows can cost millions and extend project timelines by quarters. Vendors that supply pre-built adapters to popular data-science notebooks, experiment trackers, and CI/CD orchestrators, therefore, gain a strategic edge.
*Our forecasts treat driver/restraint impacts as directional, not additive. The impact forecasts reflect baseline growth, mix effects, and variable interactions.
AI Governance Market Segment Analysis
By Component:
Platforms Anchor Enterprise SpendPlatforms and software suites commanded 42.40% revenue in 2025, underlining buyer preference for unified environments that manage policies, monitoring, and documentation together. Vendors such as IBM deliver integrated dashboards that map model inventories to jurisdiction-specific obligations, minimizing audit fatigue. Point tools for bias detection and explainability expand fastest at a 28.6% CAGR because they plug neatly into existing pipelines without a large-scale rip-and-replace. The services sub-segment grows steadily as organizations outsource framework design and regulator liaison amid acute skill shortages.
Enterprise architects favor a single system of record to avoid gaps. Yet in brownfield settings, incremental roll-outs dominate. Teams often start with a bias-scanning API that flags disparate impact, then layer on automated documentation generators. This “modular” journey fuels parallel growth paths where platforms gain share in green-field digital-native firms while point solutions penetrate established corporates. Professional services demand remains resilient, reflecting the heavy lift of mapping data flows, classifying risk tiers, and aligning internal policies to each regulator’s language.

By Deployment:
Cloud First, Yet Hybrid PersistsCloud implementations represented 77.20% of the AI Governance market in 2025 and are slated to compound at 29.4% annually. Providers embed governance hooks directly into platform services, offering automatic upgrades that track evolving rules. A single console can inspect prompts, training runs, and inference logs across multi-region data centers, slicing compliance overhead. SMEs gravitate to these pay-as-you-go options because upfront capital requirements are negligible.
Despite cloud momentum, certain workloads remain on-premises to satisfy data sovereignty or latency constraints. European banks piloting generative-credit scoring often run explainability algorithms on in-house servers to keep sensitive customer data inside national borders. Hybrid designs, therefore, proliferate training may occur in an on-premises sandbox, whereas monitoring dashboards reside in a sovereign cloud enclave. Vendors that deliver parity across deployment modes capture cross-sell opportunities as clients move models through staged environments.
By End-User Industry:
Financial Services Still LeadsFinancial institutions retained 25.40% of 2025 revenue due to stringent audit regimes such as SR 11-7 in the United States and EBA Guidelines on Model Risk Management in the EU. These rules map cleanly onto AI Governance controls, accelerating spend. Risk and compliance teams leverage governance tooling to automate model approval committees, shortening time-to-market for new scoring or fraud algorithms. Insurers further adopt continuous performance monitoring to update actuarial tables in real time.
Healthcare grows fastest at 28.5% as AI-assisted diagnosis and treatment require transparent reasoning. Regulators now ask hospitals to justify triage decisions made by image classifiers. Governance platforms provide pixel-to-decision traceability that satisfies ethical review boards. Pharmaceutical R&D uses similar features to defend AI-driven target discovery paths during FDA or EMA filings. Government, retail, telecom, and mobility verticals follow, guided by sector-specific standards that increasingly reference the EU AI Act taxonomy.
By Application Area:
Monitoring Dominates, Bias Leads GrowthModel risk and performance monitoring owned a 31.35% share in 2025 because every production system demands health checks for drift, latency, and uptime. Dashboards aggregate telemetry and fire alerts when statistical metrics cross warning thresholds. Bias and fairness management, though smaller, escalates at 28.55% CAGR as firms operationalize DEI commitments and shield brands from discrimination claims. Explainability, audit-trail generation, and privacy controls round out the stack, often bundled into single-license packages.
Organizations first deploy monitoring to stabilize operations, then introduce bias scans on sensitive models. Fintech lenders now rerun fairness assessments nightly, recalibrating scorecards when demographic distributions change. Retailers apply similar logic to recommendation engines to avoid reinforcing historical stereotypes. As generative content enters marketing workflows, hallucination detection and toxicity filtering become additional modules stitched into the governance mesh.
By Organisation Size:
Enterprises Set Pace, SMEs Catch UpLarge companies captured 60.20% of 2025 spending. They face multi-regulator exposure and possess dedicated risk offices, which use governance tooling to coordinate legal, compliance, and engineering stakeholders. Budgets also extend to premium service tiers that include 24-hour regulatory hotlines and tailored assurance reports.
SMEs, however, record a 29.05% CAGR because cloud pricing has collapsed, and regulators apply rules proportionately rather than exempting smaller players. Low-code policy editors help lean teams codify controls without bespoke scripting. Vendors launch “starter kits” that ship with pre-templated risk taxonomies mapped to the EU AI Act and California’s forthcoming Automated Decision Systems statute. This democratisation means governance becomes an entry ticket for B2B contracts: large buyers increasingly require evidence of oversight from suppliers, regardless of headcount.
Geography Analysis
North America AI Governance Market
North America’s 32.85% 2025 share reflects early venture funding, high cloud adoption, and a mosaic of state rules that drive demand for centralised oversight. The White House Executive Order on AI sets broad guardrails but defers specifics to agencies, prompting proactive compliance spending while definitions mature. Canada favors voluntary standards but signals an impending AI & Data Act that mirrors European risk tiers. Mexico adopts cross-border data-flow clauses within USMCA, nudging domestic firms toward governance upgrades compatible with North American partners.
APAC AI Governance Market
Asia Pacific is projected to post a 34.7% CAGR to 2031, the fastest worldwide. China blends national security imperatives with provincial implementation guidelines, creating multi-layer checkpoints that reward vendors able to cascade policies down organisational hierarchies. Japan’s light-touch approach encourages voluntary codes complemented by sector guidance, offering growth lanes for modular governance suites that snap into diverse toolchains. South Korea’s AI Basic Act, effective January 2026, extends Europe-style transparency requirements, whereas India’s state initiatives inject funding for responsible-AI sandboxes. Collectively, these schemes create a patchwork that necessitates multilingual interface support and flexible policy engines.
Europe AI Governance Market
Europe shows steady uptake anchored by the EU AI Act. Enforcement authorities can levy penalties equal to 7% of global turnover, compelling swift action. Germany and France lead deployments through established industrial AI hubs and government co-investment in trustworthy AI centres. The United Kingdom pursues an innovation-friendly route centred on existing regulators, yet cross-border businesses still align with EU standards to preserve market access. Nordic countries emphasise public-sector transparency, deploying open-source monitoring scripts to publish algorithm registers, while Eastern European members leverage EU structural funds to adopt turnkey governance platforms.
Regulatory Landscape
AI governance is shifting from voluntary principles to enforceable requirements across major economies, with the EU AI Act (Regulation (EU) 2024/1689) serving as the key anchor for global compliance programs. The Act enters a broad applicability phase on August 2, 2026, including transparency obligations such as those captured under Article 50, which increases demand for audit trails, documentation, and post-deployment monitoring aligned to EU risk categories.
In the United States, the June 2026 Executive Order 14409 (Promoting Advanced Artificial Intelligence Innovation and Security) directs agencies to coordinate security benchmarking for covered frontier models while hardening federal infrastructure against AI-enabled risks. The order also introduces near-term operational requirements, including the formation of an AI cybersecurity clearinghouse by July 2, 2026, involving the Department of the Treasury, CISA, NSA, and the National Cyber Director, reinforcing the linkage between AI governance controls and cybersecurity governance in enterprise procurement.
Value Chain Analysis
The AI governance value chain begins with base model developers, data providers, and cloud infrastructure that shape model capabilities and constraints. It then extends through AI platform and MLOps layers where governance controls are embedded, including model inventory, lineage, evaluation, monitoring, and policy workflows.
Governance software vendors and hyperscalers package these controls into platforms and point solutions, while consulting and system integrators operationalize them through risk taxonomy mapping, control implementation, and regulator-ready documentation for regulated end users such as BFSI and healthcare. Downstream, enterprises distribute governed models through internal product teams and third-party suppliers, making AI supply chain governance a key link between upstream dependencies and accountable deployment. Guidance such as the AI Governance Institute playbook on AI supply chain governance (April 2026) and the OECD update to its AI Recommendation (April 2026) reinforces lifecycle-based accountability, data provenance, and actor roles, pushing buyers to request evidence of training data lineage, evaluation results, and incident processes from vendors. Common bottlenecks include manual intake and documentation processes, disconnected governance tooling across the AI lifecycle, limited capacity to review datasets and algorithms, and opaque dependencies on upstream models, which collectively raise integration and assurance costs and increase demand for interoperable governance layers that connect security, risk, and MLOps.
Competitive Landscape
The AI Governance market remains moderately fragmented. Incumbent tech vendors exploit enterprise footholds to bundle governance features into broader analytics or cloud portfolios. IBM’s watsonx.governance suite exemplifies this approach, offering model-catalogue views, bias scans, and policy workflow orchestration within one license. Microsoft integrates similar controls directly into Azure AI Studio, creating switching costs that lock workflows into its ecosystem. Google Cloud pairs partner services with built-in policy libraries aligned to NIST and ISO standards.
Specialised startups fill niche gaps. Credo AI emphasises policy generation and stakeholder scorecards. Arthur AI delivers model-specific telemetry for drift and outlier detection, while Fairly AI focuses on continuous compliance testing. These firms frequently partner with consulting integrators such as Slalom or Booz Allen to tackle organisational change management. Patent filings underscore innovation intensity: WIPO logged more than 25,000 generative-AI patents in 2023, a notable subset aimed at governance tooling[4].
Strategic alliances multiply as ecosystem players race to deliver end-to-end stacks. Anthropic’s three-way collaboration with AWS and Accenture trains over 1,400 engineers to embed Claude models into regulated industries. IBM’s tie-ups with e& and KPMG Japan illustrate how platform vendors leverage telecom and advisory channels to penetrate geographies with tough regulatory deadlines. Funding momentum persists: Monitaur, ValidMind, and ModelOp collectively raised more than USD 24 million during 2024, signalling sustained investor confidence in the category.
AI Governance Industry Leaders
-
Microsoft Corporation
-
IBM Corporation
-
SAP SE
-
Google LLC (Alphabet Inc.)
-
FICO Inc.
- *Disclaimer: Major Players sorted in no particular order
AI Governance Market Companies Covered in this Report
- IBM Corporation
- Microsoft Corporation
- Google LLC (Alphabet)
- SAP SE
- SAS Institute Inc.
- Salesforce Inc.
- FICO Inc.
- ServiceNow Inc. (Model Risk Governance)
- DataRobot Inc.
- H2O.ai Inc.
- Arthur AI Inc.
- Credo AI Inc.
- Aporia Technologies Ltd.
- Validere Technologies Inc.
- Truera Inc.
- Fairly AI Inc.
- Pymetrics Inc. (HireVue)
- Integrate.ai Inc.
- Meta Platforms Inc.
- IBM-Red Hat (OpenShift AI Governance)
Market Opportunities and Future Outlook
A core opportunity is compliance-ready governance packages aligned to concrete regulatory milestones, especially the EU AI Act becoming broadly applicable on August 2, 2026. This creates room for offerings that translate legal requirements into implementable controls, including model and system inventory, transparency documentation, audit logs, human oversight workflows, and post-deployment monitoring. It also supports accelerators that map obligations across jurisdictions for multinationals facing fragmented definitions.
Enterprise buying criteria are also shifting toward governance that covers frontier and agentic systems, reflected in developer-led governance frameworks that operationalize safety practices into repeatable reporting. Examples include Anthropic publishing Responsible Scaling Policy v3 (February 2026) with formalized risk reporting and safety roadmaps, and OpenAI publishing a Frontier Governance Framework (May 2026) that aligns safety and security practices with regulatory expectations. These moves expand demand for tools that can govern agent behavior, evaluate model changes continuously, and integrate governance evidence into enterprise risk management and security operations, while cloud-first delivery and sovereign or hybrid configurations remain relevant where data sovereignty constraints require controlled environments.
Recent Industry Developments in AI Governance Market
- July 2026: Microsoft launched Microsoft Frontier Company, an AI deployment business backed by a USD 2.5 billion commitment, to help enterprises operationalize AI at scale. The initiative formalizes deployment services that bundle governance, security, and change management into implementation programs, tightening Microsoft's influence over how regulated customers industrialize AI across their estates.
- June 2025: IBM introduced integrated capabilities between watsonx.governance and Guardium AI Security to unify agentic governance and security across 12 compliance frameworks, including the EU AI Act and ISO 42001. By connecting governance workflows with security controls, IBM strengthened a combined assurance approach that enterprises use to manage AI risk, monitoring, and audit evidence in one operating model.
- September 2024: SAP updated its Global AI Ethics policy to align with UNESCO recommendations, expanding principles to address generative AI and third-party systems. The update supports customers using SAP-centric workflows by clarifying governance expectations for AI embedded in enterprise applications and by strengthening policy baselines used in internal assurance and supplier oversight.
AI Governance Market Report Scope and Research Methodology
Market Definition and Coverage
The AI governance market is defined as the revenue generated from software and related services that help organizations set rules for AI use, manage model risk, document decisions, and demonstrate compliance across the AI lifecycle.
Scope exclusions: This sizing excludes general cybersecurity, data governance, and broad GRC tools when they are not purchased or used specifically for AI model governance and oversight.
Segments Covered in This Report
- By Component
- Platforms/Software Suites
- Point Solutions (Bias/Explainability/Monitoring)
- Services
- By Deployment
- Cloud (SaaS)
- On-Premise/Private Cloud
- By End-User Industry
- BFSI
- Healthcare and Life Sciences
- Government and Defense
- Retail and E-commerce
- Automotive and Mobility
- Telecom and Media
- Other Industries
- By Application Area
- Bias and Fairness Management
- Explainability and Transparency
- Model Risk and Performance Monitoring
- Regulatory Compliance and Audit Trail
- Data Privacy and Security Controls
- By Organisation Size
- Large Enterprises
- Small and Mid-size Enterprises (SMEs)
- By Geography
- North America
- United States
- Canada
- Mexico
- South America
- Argentina
- Brazil
- Rest of South America
- Europe
- United Kingdom
- Germany
- France
- Rest of Europe
- Asia-Pacific
- China
- Japan
- India
- South Korea
- Rest of Asia-Pacific
- Middle East and Africa
- United Arab Emirates
- Saudi Arabia
- Turkey
- South Africa
- Rest of Middle East and Africa
- North America
Data Sources, Market Sizing, and Validation
Desk Research
Desk work started by mapping what buyers typically mean by AI governance, then linking that to observable demand signals and policy timelines. We used public sources such as the NIST AI Risk Management Framework materials, OECD AI policy and responsible AI resources, European Commission publications on the EU AI Act, and U.S. government releases from agencies such as NIST and the FTC for enforcement direction. For market context, we also reviewed non-paywalled statistics and research from sources such as the World Bank for digital adoption indicators, plus peer-reviewed journals that track AI risk management practices.
After that, public company filings, earnings call notes, and investor presentations were used to understand how budgets are being allocated to governance, risk, and compliance programs that include AI. We also used paid subscriptions for company financials and intelligence, and a patent database to spot where governance features were being productized. The desk source list above is illustrative, and many other public documents and datasets were reviewed to collect, cross-check, and clarify inputs.
Primary Interviews and Surveys
Primary work focused on validating what is truly counted as AI governance spend and how it is packaged in real contracts, including platform licenses, add-on modules, and services. We spoke with a mix of solution providers, implementation and advisory teams, and enterprise buyers across APAC, EMEA, and the Americas, so assumptions on adoption timing, pricing structure, and compliance-driven purchasing could be checked and adjusted.
Distribution of primary research fieldwork respondents
| Company type | Respondent position | Region |
|---|---|---|
| Top tier: 27% | CXOs: 21% | APAC: 51% |
| Mid tier: 51% | Functional/Unit leaders: 24% | EMEA: 29% |
| Smaller Players: 22% | Managers: 55% | Americas: 20% |
Market-Sizing & Forecasting
Sizing was built using top-down and bottom-up logic. We started with regulation-led adoption and enterprise AI rollout levels to reconstruct a realistic demand pool by region, then tested it using selective supplier and channel checks. In practice, we begin with the number of AI projects moving from pilot to production, the share of regulated and high-risk use cases, and the portion of deployments that require formal governance controls, including policy, risk scoring, monitoring, and audit trails. Those demand indicators are then translated into spending using typical license and services mixes, with inputs validated in interviews.
To keep the model grounded, we tracked and updated measurable inputs as they shifted, including the timing of major compliance deadlines, enterprise cloud and AI platform adoption trends, average contract value ranges for governance modules, services attach rates during implementation, and renewal behavior once governance is embedded in workflows. Forecasts were built using scenario analysis, since policy timelines and enforcement intensity can move faster or slower by region, and the scenario weights were tuned using expert feedback. Where bottom-up checks had gaps, such as limited visibility into smaller vendor revenues, the missing portion was handled through penetration-based adjustments rather than assuming full supplier coverage.
Data Validation & Update Cycle
Outputs were validated through multiple checks so the final totals stayed consistent with real-world buying patterns. We compared implied spending per AI deployment against interview ranges, reviewed regional splits against known enterprise AI adoption indicators, and investigated outliers such as sudden jumps in ASPs or unrealistic services shares before sign-off. When a variance could not be explained by a clear market event, we re-checked inputs and, when needed, re-contacted sources to confirm the assumption.
The report is refreshed on an annual cycle, and interim updates are triggered by material events such as new enforcement guidance, major regulatory milestones, or sharp shifts in enterprise AI investment. Before delivery, a final pass is completed to capture the latest public signals and interview-based corrections so clients receive a current view.
Mordor Intelligence's AI Governance Market Size Compared With Other Published Estimates
Published AI governance market values often differ because the scope can be set in different ways, and the same spend can be counted under adjacent categories like data governance, general GRC, or AI development tooling. Differences can also come from the base year chosen, how services are treated, and whether pricing is modeled as module add-ons or as full platform deals.
The main gap comes from whether general compliance platforms and broad data governance suites are counted as AI governance spend. In that regard, Mordor Intelligence counts revenue only when governance functions are directly tied to AI model oversight, documentation, monitoring, and audit readiness. Other gaps are often created by aggressive adoption curves that assume rapid, uniform compliance uptake across regions, plus faster ASP expansion that is not always supported by contract reality, currency timing, or renewal behavior.
Benchmark comparison
| Source | Market Size | Gaps in Research Methodology |
|---|---|---|
| Mordor Intelligence | USD 0.34 B (2025) | |
| Industry Research Group A | USD 0.31 B (2025) | Uses a narrower monetization view that tends to undercount services and implementation work linked to governance rollouts, which reduces total captured spend in early years. |
| Global Consultancy B | USD 0.84 B (2025) | Expands the scope by folding in broader GRC and data governance spend that is not always AI-model specific, and applies faster adoption and pricing lift assumptions across regions. |
The spread in published values is mainly explained by what gets included as AI governance and how quickly adoption and pricing are allowed to ramp. Using clear inclusion rules, observable demand signals, and interview-checked pricing logic makes the final number easier to trace and repeat when the market changes.
Key Questions Answered in the Report
How big is the AI Governance market today, and how fast will it grow?
The market is USD 0.44 billion in 2026 and is projected to reach USD 1.51 billion by 2031 at a 28.15% CAGR.
Which regions contribute most to AI Governance revenue?
North America holds 32.85% revenue share, while Asia Pacific is the fastest-growing region at a 34.7% CAGR through 2031.
Why are cloud deployments dominating adoption?
Cloud platforms make up 77.20% of implementations because they deliver rapid scalability, automatic regulation-aligned updates, and lower upfront costs.
What is driving the surge in bias and fairness management tools?
A rise in lawsuits and insurer-mandated guarantees has turned bias mitigation into a board-level priority, fuelling a 28.55% CAGR in this application area.
Which industries are the earliest adopters of AI Governance frameworks?
Financial services leads with a 25.40% share due to strict supervisory mandates; healthcare follows with the highest growth rate at 28.5% through 2031.
How severe is the skills bottleneck?
Talent shortages subtract an estimated 4.9 percentage points from forecast growth, forcing organisations to automate compliance checkpoints wherever possible.