Market Overview
| Study Period | 2021 - 2031 |
|---|---|
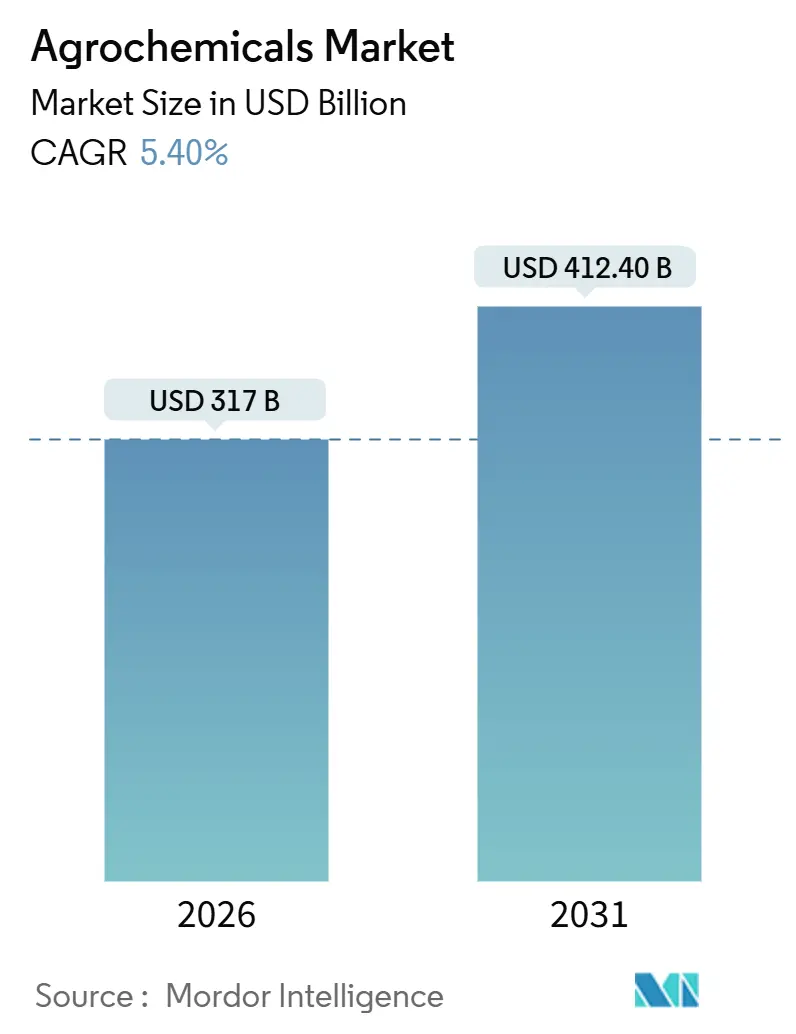
| Market Size (2026) | USD 317 Billion |
| Market Size (2031) | USD 412.40 Billion |
| Growth Rate (2026 - 2031) | 5.40% CAGR |
| Fastest Growing Market | Asia Pacific |
| Largest Market | Asia Pacific |
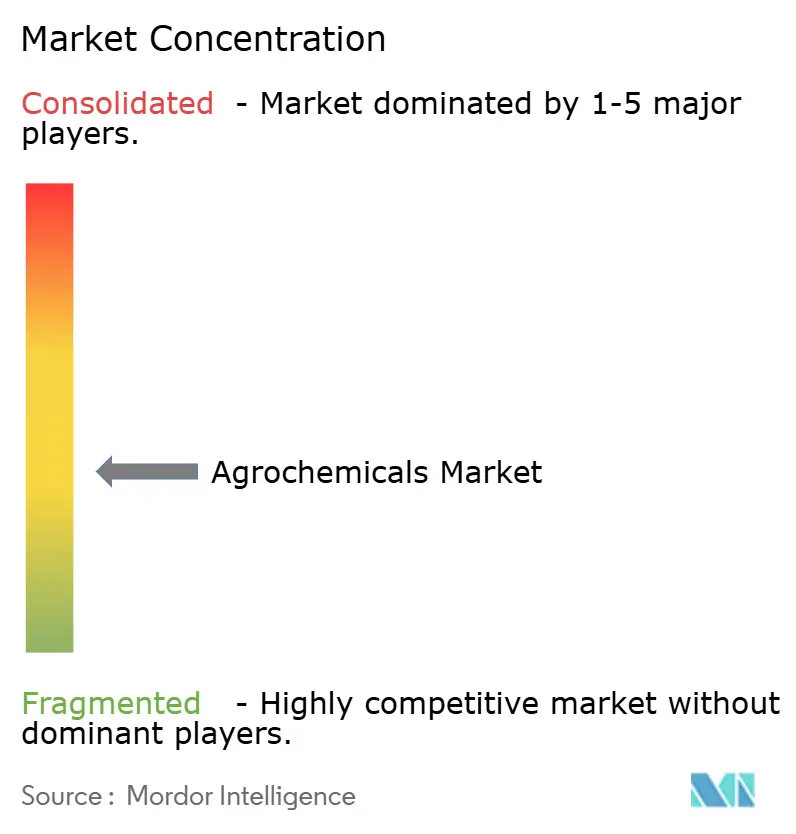
| Market Concentration | Medium |
Major Players *Disclaimer: Major Players sorted in no particular order Image © Mordor Intelligence. Reuse requires attribution under CC BY 4.0. | |
Agrochemicals Market Analysis by Mordor Intelligence
The agrochemicals market size is estimated to be USD 317.00 billion in 2026 and is forecast to reach USD 412.40 billion by 2031, reflecting a 5.40% CAGR. This growth is driven not only by volume increases but also by a shift toward premium herbicides that address resistant weeds and regulatory measures phasing out high-toxicity chemicals. These trends are steering investments toward controlled-release fertilizers and advanced crop protection solutions. Initiatives such as Nutrien's carbon-aligned nitrogen program and Yara's green ammonia projects underscore the rising importance of combining product performance with sustainability compliance. Additionally, factors like carbon pricing, pesticide taxes, and stricter residue limits are reshaping product pipelines, favoring coated fertilizers that enable verified emission credits. However, litigation risks and re-registration costs are narrowing product portfolios, increasing entry barriers, and benefiting diversified companies capable of managing compliance costs effectively.
Key Report Takeaways
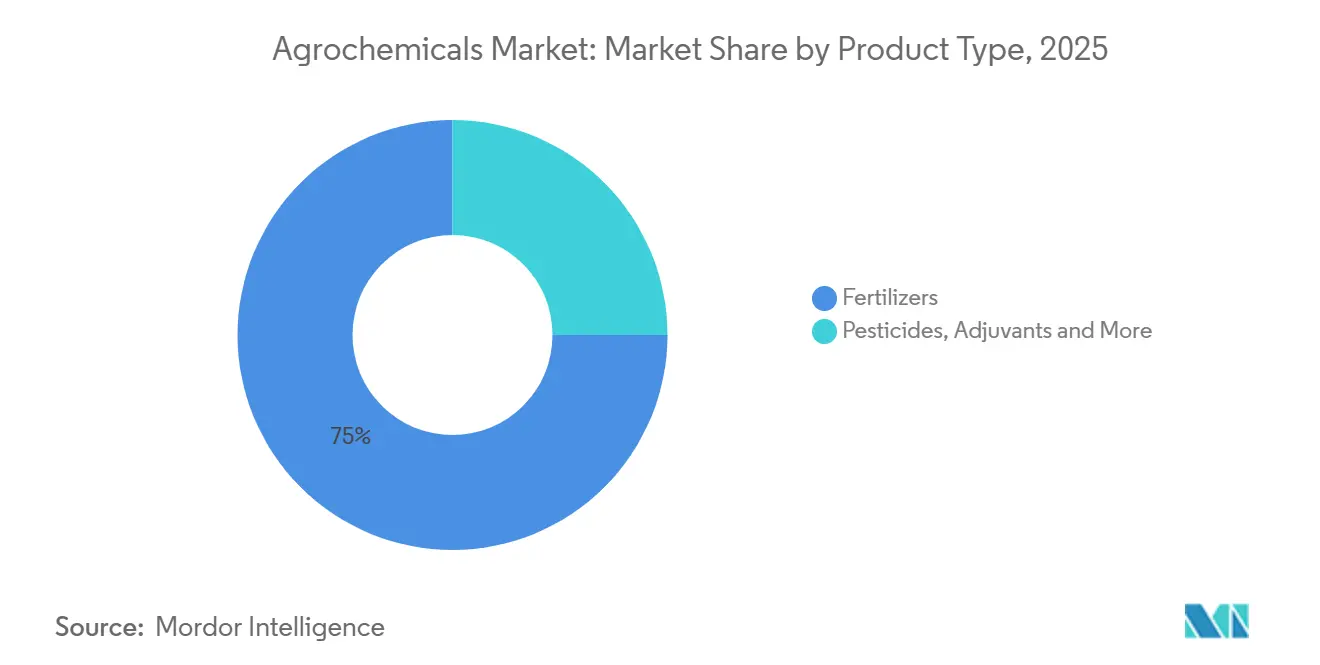
- By product type, fertilizers accounted for 75% of the agrochemicals market share in 2025, while plant growth regulators are projected to expand at a 13.0% CAGR to 2031.
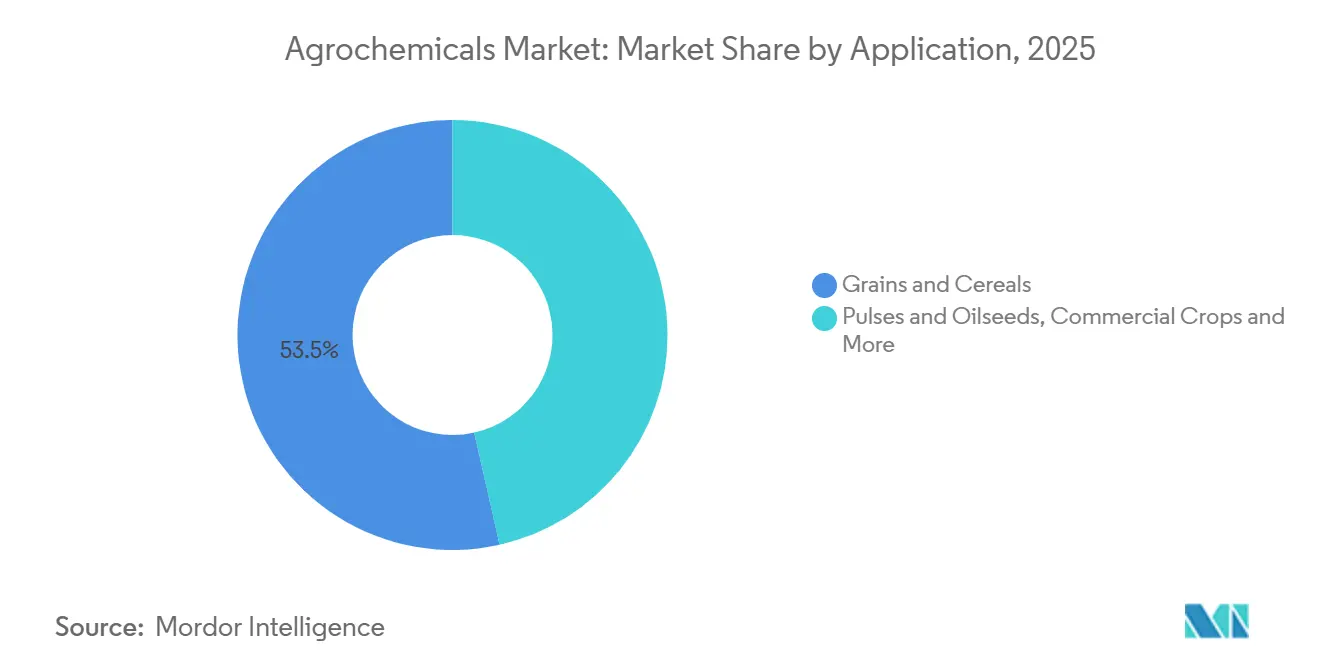
- By crop type, grains and cereals held 53.5% share of the agrochemicals market in 2025, whereas fruits and vegetables are advancing at a 7.4% CAGR through 2031.
- By geography, Asia-Pacific captured a 53% of the agrochemicals market size in 2025, and is the fastest-growing region at a 6.6% CAGR to 2031.
Note: Market size and forecast figures in this report are generated using Mordor Intelligence’s proprietary estimation framework, updated with the latest available data and insights as of January 2026.
Global Agrochemicals Market Trends and Insights
Drivers Impact Analysis
| Driver | (~) % Impact on CAGR Forecast | Geographic Relevance | Impact Timeline |
|---|---|---|---|
| Rising Incidence of Herbicide-Resistant Weeds Fuels Demand for Premium Herbicides | 0.9% | North America, South America, and Australia | Medium term (2-4 years) |
| Precision Agriculture and Data Subscription Models Scale Globally | 0.7% | North America, Europe, Asia-Pacific, and Africa | Long term (≥4 years) |
| Major Pesticide Patent Cliff (2024-2028) Fuels Low-cost Generic Uptake | 1.0% | South America, Asia-Pacific, North America, and Europe | Medium term (2-4 years) |
| Carbon-Credit Monetization of Nitrogen-Efficiency Products | 0.5% | North America, Europe, Australia, and South America | Long term (≥4 years) |
| Controlled-release and Inhibitor-Coated Fertilizers Gain Mainstream Adoption | 0.8% | Asia-Pacific, Middle East, and Africa | Medium term (2-4 years) |
| European Union Carbon Border Adjustment Mechanism (CBAM) and Similar Carbon Policies Accelerate Low-Carbon Ammonia Uptake | 0.6% | Europe, Middle East, and North America | Long term (≥4 years) |
| Source: Mordor Intelligence | |||
Rising Incidence of Herbicide-Resistant Weeds Fuels Demand for Premium Herbicides
Palmer amaranth infestations now span 31 United States states, and glyphosate-resistant ryegrass covers more than 2 million hectares in Australia. Growers are substituting generic glyphosate with premium Group 15 and Group 27 chemistries, commanding 40–60% price uplifts. Revenue per treated hectare is rising even as acreage stays flat, rewarding portfolios that rotate multiple modes of action within a season. Trait-herbicide bundles such as Corteva’s Enlist E3 soybean, which reached 35% of U.S. soybean acres in 2025, illustrate how integrated solutions secure recurring sales and temper resistance evolution. Regulators are tightening stewardship rules that formalize rotation and refuge planting, increasing demand for multi-site chemistry access. Growers, therefore, prioritize suppliers able to deliver complete resistance-management programs[1]Source: Weed Science Society of America, “Herbicide Resistance in U.S. Row Crops,” wssa.net.
Precision Agriculture and Data Subscription Models Scale Globally
Input-as-a-Service contracts convert one-time input purchases into recurring revenue and data loops. Corteva’s Granular platform guided 60 million acres in 2025, while Yara’s Atfarm advised 1.2 million hectares in Europe, cutting nitrogen waste by 12% and spawning carbon credits priced at EUR 25 per metric ton (USD 27 per metric ton). Smartphone penetration in India and Indonesia is extending similar services to smallholders, and telematics are embedding Bayer’s Climate FieldView across 4 million farms worldwide. Control of prescription data lets incumbents steer seed, fertilizer, and crop-protection mix, positioning platforms as profit centers equal in importance to active-ingredient pipelines.
Controlled-Release and Inhibitor-Coated Fertilizers Gain Mainstream Adoption
Polymer-coated urea and dual-inhibitor blends are transitioning from niche products to broader adoption as factors such as labor constraints, runoff regulations, and yield requirements converge. Nutrien Ltd. reported significant growth in ESN (Environmentally Smart Nitrogen) sales in 2025 compared to 2024, driven by demand from the United States corn and Canadian canola markets. ICL Group’s eqo.x platform, implemented across Europe and the Asia-Pacific region, achieved notable improvements in wheat and rice yields. Policy initiatives, including the United States Environmental Protection Agency (EPA) Chesapeake Bay nitrogen cap and China’s 40% fertilizer-efficiency target, are positioning coated products as risk mitigation tools for distributors undergoing stewardship audits. Consequently, Companies with advanced coating technologies can maintain price stability during volatile commodity cycles.
Carbon-Credit Monetization of Nitrogen-Efficiency Products
Enhanced-efficiency fertilizers qualify for verified emission reductions valued at USD 15–40 per metric ton of CO₂ equivalent. Nutrien piloted the practice over 500,000 United States corn acres in 2025, pairing Environmentally Smart Nitrogen (ESN) controlled-release urea with on-farm verification and selling credits to Microsoft and Cargill at USD 32 per metric ton, delivering USD 8–12 per acre back to growers. Yara’s YaraVera stabilizer cut N₂O emissions by 38% in Iowa trials and secured ISO 14064 verification, converting compliance into brand premium. The economics prove that environmental attributes, once externalities, now represent cash flows shared among supplier, farmer, and buyer, reshaping marketing language around nutrient products[3]Source: Nutrien Ltd., “Carbon Program Overview,” nutrien.com.
Restraints Impact Analysis
| Restraint | (~) % Impact on CAGR Forecast | Geographic Relevance | Impact Timeline |
|---|---|---|---|
| Accelerating Phase-Outs of High-Toxicity Actives in the European Union, Brazil, and China | −0.7% | Europe, South America, and Asia-Pacific | Short term (≤2 years) |
| Volatile Glyphosate Pricing Squeezes Formulator Margins | −0.4% | Global, notably South America and Asia-Pacific | Short term (≤2 years) |
| Rising Regulatory Data-Package and Re-registration Costs | −0.5% | North America, Europe, and Brazil | Medium term (2-4 years) |
| Chronic Activist Litigation Risk in North America | −0.3% | United States and Canada | Long term (≥4 years) |
| Source: Mordor Intelligence | |||
Accelerating Phase-Outs of High-Toxicity Actives in the European Union, Brazil, and China
European Union proposals to retire 12 additional neonics and organophosphates by 2027, Brazil’s reclassification of paraquat as “extremely toxic,” and China’s ban on 41 pesticide actives are shrinking registrant portfolios. Portfolio churn shortens effective patent lives for replacement molecules, forcing companies to accelerate product launches or pivot into biologicals to protect revenue. Smaller formulators, unable to fund reformulation, are exiting segments, further concentrating market power among diversified incumbents that can spread compliance costs[2]Source: European Commission, “Sustainable Use of Pesticides Regulation,” ec.europa.eu.
Volatile Glyphosate Pricing Squeezes Formulator Margins
Chinese technical-grade glyphosate rose from USD 4.20 per kilogram in January 2025 to USD 6.80 per kilogram by December 2025 after environmental shutdowns and speculative restocking. South American and Asian formulators, sourcing 70% of supply from China, saw 15 to 25% margin erosion because retail price lists lagged spot spikes. Nufarm’s 2025 gross margin dropped 19% as procurement costs outpaced selling-price recoveries. The volatility is accelerating exits by small formulators and steering portfolios toward higher-margin specialty herbicides.
Segment Analysis
By Product Type: Fertilizers Anchor Revenue, Plant Growth Regulators Lead Innovation
Fertilizers dominated the agrochemicals market in 2025, holding 75% of revenue. Nitrogenous grades urea, ammonium nitrate, and Urea Ammonium Nitrate (UAN) solutions remain indispensable in cereal production across Asia-Pacific and North America. In contrast, plant growth regulators are forecast to post the fastest expansion at 13.0% CAGR, propelled by applications that synchronize flowering and extend shelf life in fruits and vegetables. Herbicides constitute a significant portion of pesticide value, reshaping product portfolios in regions with stringent zero-residue mandates. Adjuvants, though a small share, generate outsize strategic value because they reduce spray rates by up to 25%, preserving efficacy while easing regulatory pressure. Corteva Agriscience’s ProGibb, a gibberellin-based regulator, recorded significant revenue in 2025, reflecting increasing demand for yield-enhancement molecules beyond traditional fertilizer expenditures. The agrochemicals market size for fertilizers is projected to grow steadily, with discretionary growth likely to center on high-margin regulators and other products that align with sustainability initiatives.
The ongoing phase-out of toxic active ingredients and the increasing preference for coated formulations enable companies to integrate fertilizer and crop protection solutions. Firms offering nutrient efficiency alongside pest control can cross-sell within the same acreage, strengthening relationships with channel partners and capturing additional market share. These trends allow agrochemical companies to maintain profitability despite fluctuations in commodity fertilizer cycles. Additionally, companies that validate environmental performance through third-party protocols are securing pricing premiums, indicating a long-term shift away from volume-based competition.
Note: Segment shares of all individual segments available upon report purchase
Get Detailed Market Forecasts at the Most Granular Levels
Download PDF
By Crop Type: Grains and Cereals Dominate, Fruits and Vegetables Accelerate
Grains and cereals accounted for 53.5% of the agrochemicals market share in 2025. Covering extensive areas of crops such as wheat, rice, corn, and sorghum, this segment utilized the largest volumes of nitrogen fertilizers and herbicides, driven by the use of mechanized broadcast equipment that ensures uniform application. In the United States, glyphosate-tolerant corn and soybean programs contributed to increased input spending, with trait-herbicide bundles, such as Corteva Agriscience’s Enlist E3, being widely adopted in U.S. soybean cultivation, thereby sustaining demand for complementary chemical products. In the Asia-Pacific region, the adoption of controlled-release urea and inhibitor coatings, such as ICL Group’s eqo.x, improved rice yields, reflecting the influence of nutrient-efficiency policies in promoting premium formulations.
Fruits and vegetables, while representing a smaller share of the agrochemicals market, are growing at a faster rate with a 7.4% through 2031, driven by export-oriented growers seeking residue-compliant premiums. Producers in countries such as Kenya, Ethiopia, Peru, and Vietnam are utilizing plant growth regulators and specialty fungicides to meet European supermarket standards. For instance, Corteva Agriscience’s ProGibb is anticipated to see significant demand by optimizing flowering in table grapes and citrus. Pulses and oilseeds account for a notable portion of market revenue, with Argentine farmers reducing herbicide costs per hectare by transitioning to generic dicamba and glyphosate blends after patent expirations. Wheat growers in Europe and Australia are increasingly adopting BASF and Bosch spot-spraying systems, which significantly reduce herbicide usage, demonstrating the cost-saving potential of sensor-based technologies even in large-scale cereal production. While grains and cereals will continue to lead in terms of volume, fruits and vegetables offer higher margins, encouraging specialty formulators to focus on environmentally certified chemistries combined with precision-application solutions.
Note: Segment shares of all individual segments available upon report purchase
Get Detailed Market Forecasts at the Most Granular Levels
Download PDF
Geography Analysis
Asia-Pacific accounted for 53% of the agrochemicals market share in 2025 and is projected to grow at a CAGR of 6.6% through 2031. Key factors supporting baseline demand include China’s zero-growth fertilizer mandate, which aims to stabilize fertilizer usage while maintaining agricultural productivity, and India’s subsidized urea program, which ensures affordability for farmers and sustains demand. Additionally, Japan’s precision agriculture platforms demonstrate how carbon monetization initiatives can incentivize the adoption of premium agricultural inputs, further driving market growth in the region. These developments position Asia-Pacific as a critical driver of the global agrochemicals market.
In Africa, digital advisory services are increasingly being adopted to enhance yields among smallholder farmers, addressing challenges such as restricted access to traditional inputs and climate variability. Egypt and South Africa stand out as anchor markets due to their well-developed irrigation infrastructure and focus on export-oriented horticulture, which supports higher-value crop production. Meanwhile, South America’s market growth is primarily driven by Brazil’s expanding soybean and corn acreage, supported by favorable climatic conditions and government policies, and Argentina’s export-oriented agricultural practices, which emphasize competitiveness in global markets.
In North America, market growth reflects the challenges of mature acreage and the impact of litigation, yet advancements in data platforms and carbon programs are creating new service revenue opportunities for agrochemical companies. Europe's market growth is the slowest among regions, hindered by the Farm to Fork pesticide-reduction targets. However, the region is becoming a leader in adopting low-carbon fertilizers, supported by regulatory initiatives like the Carbon Border Adjustment Mechanism (CBAM). The Middle East is capitalizing on its low-cost natural gas resources to produce ammonia for export while actively exploring blue and green ammonia production pathways. These regional trends highlight that while Asia-Pacific dominates in absolute sales, Africa and South America offer significant growth opportunities, shaping expansion strategies in the agrochemicals market.

Get Analysis on Important Geographic Markets
Download PDF
Competitive Landscape
The agrochemicals market demonstrates moderate concentration, with key players such as Syngenta Group, Bayer AG, Nutrien Ltd., Yara International ASA, and BASF SE holding a significant share of the projected 2026 revenue. Syngenta Group leads the market, leveraging its integrated seed and chemical portfolios. Nutrien Ltd.'s market position is supported by its dominance in North America's potash market and its extensive 1,700-store retail network. The industry's strategic focus has shifted from developing blockbuster molecules to adopting platform-based approaches. For instance, Corteva Agriscience’s Granular platform managed 60 million subscription acres, while Yara International ASA’s Atfarm platform guided 1.2 million hectares.
White-space opportunities in the market include innovations such as controlled-release coatings tailored for sub-Saharan Africa, carbon-credit verification systems for nitrogen-efficient fertilizers, and adjuvant formulations that enable dose reductions without compromising yield. These advancements address critical challenges in agriculture, such as improving efficiency and sustainability in resource-limited regions. Companies like UPL Ltd. and Sumitomo Chemical Co., Ltd. are gaining market share in the Asia-Pacific and African regions by offering bundled solutions that include seeds, treatments, and post-harvest products. These bundled offerings provide farmers with comprehensive solutions, enhancing productivity and reducing post-harvest losses.
The market is witnessing increasing technological intensity, driven by innovations aimed at optimizing agricultural practices. Bayer AG’s FieldView platform enables prescription maps to be directly integrated into planters and sprayers, allowing for precise application of inputs. Yara International ASA is testing autonomous spreaders, which aim to improve efficiency and reduce labor dependency. Meanwhile, BASF SE and Bosch are commercializing sensor-guided spot spraying technology, which reduces herbicide usage by up to 70%, contributing to cost savings and environmental benefits. These advancements highlight the growing role of technology in transforming traditional agricultural practices. Rising dossier costs, reinforce the scale advantages of established players. These high costs create significant barriers to entry for smaller companies, limiting competition and consolidating market power among incumbents. Additionally, ongoing litigation is filtering out smaller entrants, gradually increasing market concentration over time. This trend underscores the importance of scale and financial resources in maintaining competitiveness within the agrochemicals market.
Agrochemicals Industry Leaders
Syngenta Group
Bayer AG
Nutrien Ltd.
Yara International ASA
BASF SE
- *Disclaimer: Major Players sorted in no particular order
Need More Details on Market Players and Competitors?
Download PDF
Recent Industry Developments
- November 2025: Insecticides India Limited has introduced Altair, a herbicide specifically formulated for paddy farmers. Altair is developed to manage a wide range of grasses and sedges in paddy fields, offering an effective solution for improved weed control during critical stages of crop growth. This launch supports the growth of the agrochemicals market in India by addressing key challenges in paddy farming.
- July 2025: Bayer AG has launched globally the insecticide Plenexos Care, aimed at supporting growth in the agrochemicals market by addressing pest management challenges and improving crop protection for farmers globally.
- March 2025: FMC Corporation and Bayer AG agreed to co-commercialize Isoflex herbicide technology in Europe, with regulatory approval anticipated between 2025 and 2026.
Research Methodology Framework and Report Scope
Market Definitions and Key Coverage
According to Mordor Intelligence, the agrochemicals market comprises all factory-made fertilizers, synthetic and biological crop-protection chemicals, adjuvants, and plant-growth regulators that are traded through commercial channels for field and protected agriculture. Usage in forestry and home gardening is included only when the products and pack sizes mirror farm-grade specifications.
Scope exclusion: The study omits on-farm nutrient blends mixed by growers, biotech seed traits, and application machinery.
Segmentation Overview
- By Product Type
- Fertilizers
- Nitrogenous
- Phosphatic
- Potassic
- Other Fertilizers
- Pesticides
- Herbicides
- Insecticides
- Fungicides
- Other Pesticides
- Adjuvants
- Plant Growth Regulators
- Fertilizers
- By Crop Type
- Grains and Cereals
- Pulses and Oilseeds
- Fruits and Vegetables
- Commercial Crops
- Turf and Ornamental
- By Geography
- North America
- United States
- Canada
- Mexico
- Rest of North America
- Europe
- Germany
- France
- United Kingdom
- Italy
- Spain
- Russia
- Rest of Europe
- Asia-Pacific
- China
- India
- Japan
- Australia
- Rest of Asia-Pacific
- South America
- Brazil
- Argentina
- Rest of South America
- Middle East
- Saudi Arabia
- United Arab Emirates
- Rest of Middle East
- Africa
- South Africa
- Egypt
- Rest of Africa
- North America
Detailed Research Methodology and Data Validation
Primary Research
Structured interviews with agronomists, farm input distributors, regional regulators, and procurement heads across Asia-Pacific, the Americas, Europe, and Africa clarified adoption rates of enhanced efficiency fertilizers, average selling prices, and the likely phase-out timeline of high toxicity actives, thereby anchoring desk findings.
Desk Research
Our analysts started with publicly available macro and trade indicators from tier-1 bodies such as FAO, OECD-FAOSTAT, UN Comtrade, USDA ERS, and Eurostat, complemented by annual reports and 10-Ks of major input suppliers. Price curves and company financials were cross-verified with D&B Hoovers and Dow Jones Factiva. Specialist datasets, WSTS for active ingredient capacity signals and Volza for shipment level pesticide flows, helped fine-tune regional splits. This list is illustrative; many additional sources were reviewed to validate trends and fill gaps.
Market-Sizing & Forecasting
The model begins with a top-down reconstruction of demand using country-level fertilizer application rates (kg/ha), FAO pesticide use statistics, and cropped area forecasts; volumes are then multiplied by blended ASPs collected from trade data. Select bottom-up checks, supplier revenue roll-ups and dealer channel audits, catch anomalies. Key variables include urea spot prices, corn-soy acreage switches, pesticide maximum residue limit revisions, and biologicals' penetration. A multivariate regression with lagged rainfall normals and farm income indices projects consumption to 2030; scenario analysis adjusts for regulatory shocks. Gaps in bottom-up inputs are bridged by regional proxy ratios tested during expert calls.
Data Validation & Update Cycle
Outputs move through variance checks, senior analyst peer review, and a final reconciliation against independent trade and price indices. The dashboard refreshes annually, with interim updates when material events, such as an EU active ban, alter demand.
Why Mordor's Agrochemicals Baseline Commands Reliability
Published figures often vary because providers select different product baskets, pricing points, and update cadences.
We acknowledge these disparities upfront.
Benchmark comparison
| Market Size | Anonymized source | Primary gap driver |
|---|---|---|
| USD 251 B (2025) | Mordor Intelligence | - |
| USD 235.2 B (2023) | Global Consultancy A | Excludes plant growth regulators; uses 2022 average prices; update cycle biennial |
| USD 285.1 B (2024) | Global Consultancy B | Includes pesticide formulation services revenue; constant 2020 dollars without FX adjustment |
| USD 287.9 B (2024) | Industry Analyst C | Counts antibiotic feed additives; mixes wholesale and retail price points |
In sum, Mordor's disciplined scope, annual refresh, and dual validation steps deliver a balanced, transparent market baseline that decision makers can trace back to clear variables and reproducible calculations.
Need A Different Region or Segment?
Customize Now
Key Questions Answered in the Report
How large is the agrochemicals market in 2026?
The agrochemicals market size is valued at USD 317.0 billion in 2026 and is projected to grow at a 5.40% CAGR to 2031.
Which product category drives most revenue?
Fertilizers lead with 75% of 2025 revenue, though plant growth regulators are the fastest-growing at a 13.0% CAGR through 2031.
Which region is expanding fastest?
The Asia-Pacific region records the highest regional growth, with a CAGR of 6.6%. This growth is supported by baseline demand factors such as China's zero-growth fertilizer mandate, and India's subsidized urea program.
What role do carbon credits play in fertilizer sales?
Enhanced-efficiency fertilizers now earn verified carbon credits valued at USD 15 to 40 per metric ton of CO₂, creating a new revenue stream for suppliers and growers.


